Pineville, AR
Pineville Map
Pineville Overview
172
TOTAL POPULATION
85
MALE POPULATION
87
FEMALE POPULATION
97.70
MALES / 100 FEMALES
102.35
FEMALES / 100 MALES
50.5
MEDIAN AGE
3.0
AVG FAMILY SIZE
2.6
AVG HOUSEHOLD SIZE
$18,974
PER CAPITA INCOME
$17,733
FAMILY INCOME DEFICIT
0.61
INEQUALITY / GINI INDEX
63
LABOR FORCE [ PEOPLE ]
42.3%
PERCENT IN LABOR FORCE
34.4%
UNEMPLOYMENT RATE
Pineville Zip Codes
Pineville Area Codes
Race in Pineville
The most populous races in Pineville are White / Caucasian (162 | 94.2%), and Two or more Races (10 | 5.8%).
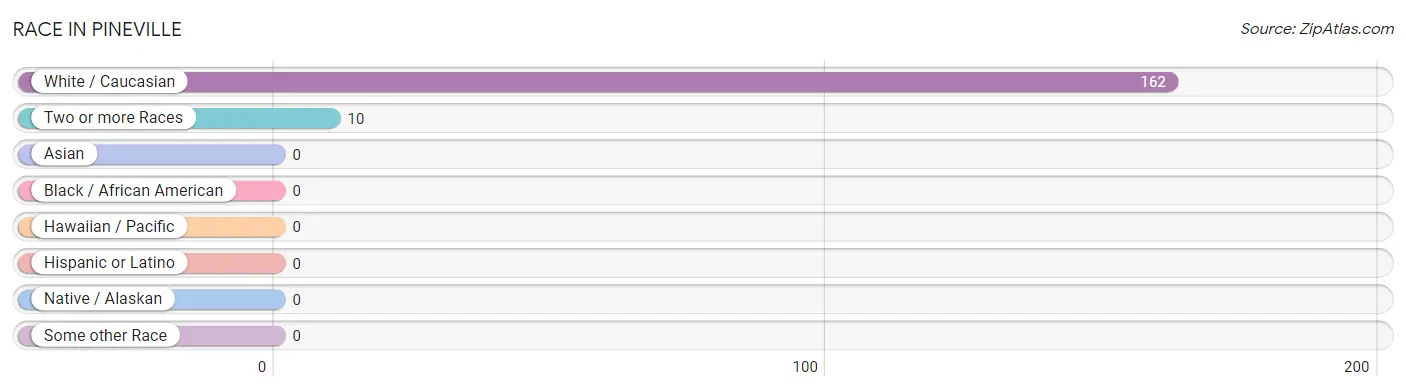
| Race | # Population | % Population |
| Asian | 0 | 0.0% |
| Black / African American | 0 | 0.0% |
| Hawaiian / Pacific | 0 | 0.0% |
| Hispanic or Latino | 0 | 0.0% |
| Native / Alaskan | 0 | 0.0% |
| White / Caucasian | 162 | 94.2% |
| Two or more Races | 10 | 5.8% |
| Some other Race | 0 | 0.0% |
| Total | 172 | 100.0% |
Ancestry in Pineville
The most populous ancestries reported in Pineville are Irish (36 | 20.9%), German (21 | 12.2%), Italian (12 | 7.0%), American (4 | 2.3%), and English (1 | 0.6%), together accounting for 43.0% of all Pineville residents.
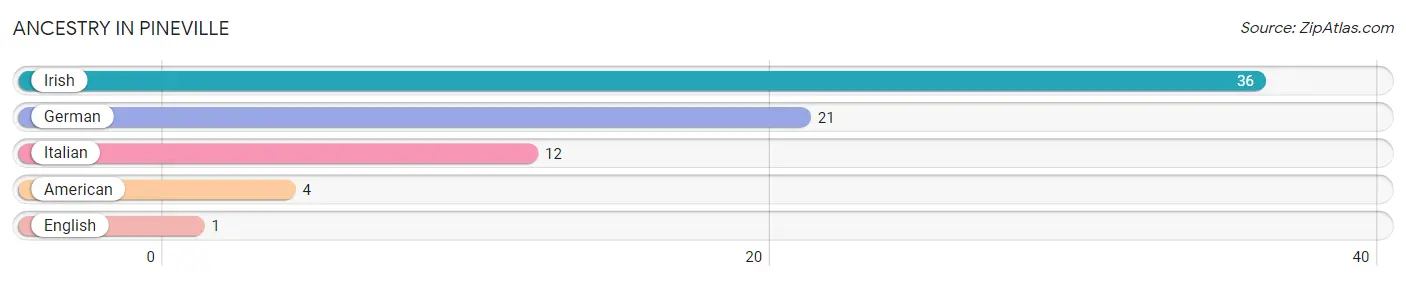
| Ancestry | # Population | % Population |
| American | 4 | 2.3% |
| English | 1 | 0.6% |
| German | 21 | 12.2% |
| Irish | 36 | 20.9% |
| Italian | 12 | 7.0% | View All 5 Rows |
Immigrants in Pineville

| Immigration Origin | # Population | % Population | View All 0 Rows |
Sex and Age in Pineville
Sex and Age in Pineville
The most populous age groups in Pineville are 80 to 84 Years (18 | 21.2%) for men and 40 to 44 Years (28 | 32.2%) for women.
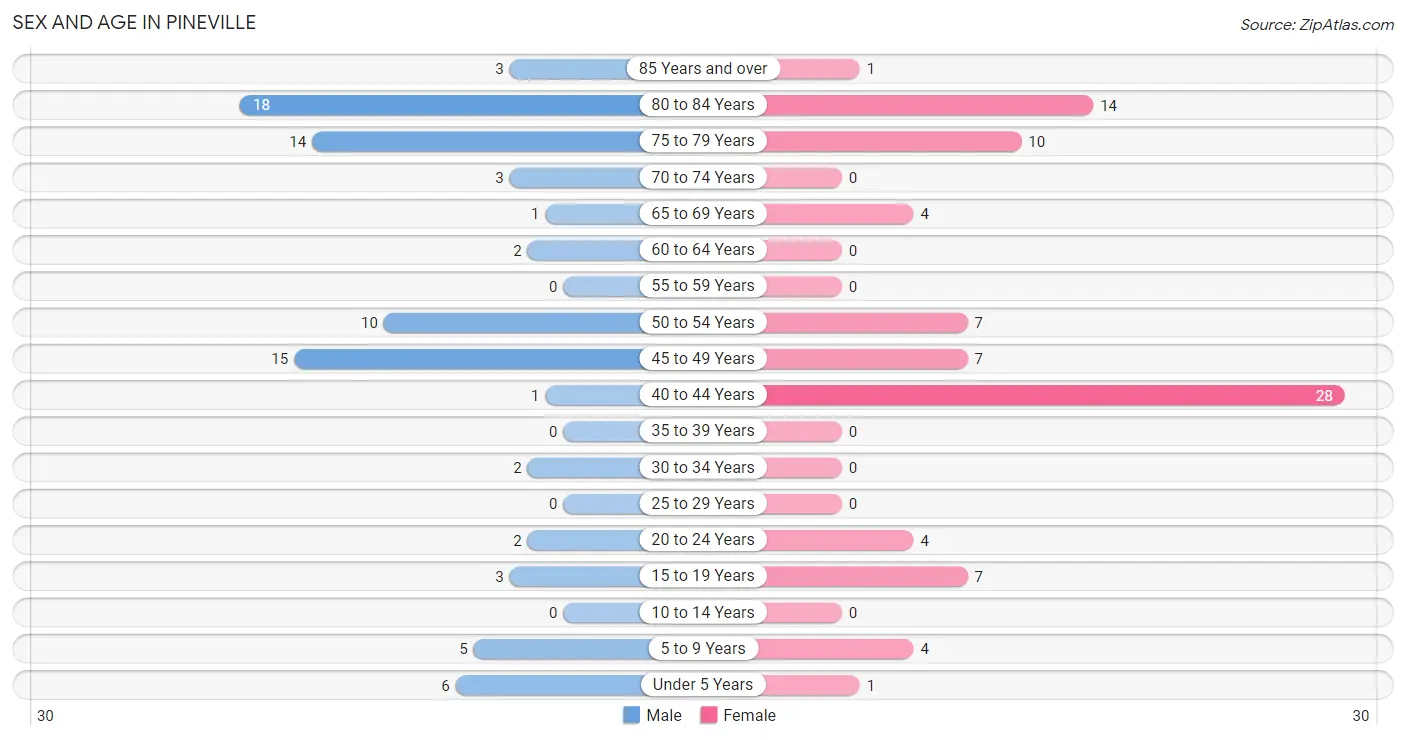
| Age Bracket | Male | Female |
| Under 5 Years | 6 (7.1%) | 1 (1.1%) |
| 5 to 9 Years | 5 (5.9%) | 4 (4.6%) |
| 10 to 14 Years | 0 (0.0%) | 0 (0.0%) |
| 15 to 19 Years | 3 (3.5%) | 7 (8.1%) |
| 20 to 24 Years | 2 (2.4%) | 4 (4.6%) |
| 25 to 29 Years | 0 (0.0%) | 0 (0.0%) |
| 30 to 34 Years | 2 (2.4%) | 0 (0.0%) |
| 35 to 39 Years | 0 (0.0%) | 0 (0.0%) |
| 40 to 44 Years | 1 (1.2%) | 28 (32.2%) |
| 45 to 49 Years | 15 (17.6%) | 7 (8.1%) |
| 50 to 54 Years | 10 (11.8%) | 7 (8.1%) |
| 55 to 59 Years | 0 (0.0%) | 0 (0.0%) |
| 60 to 64 Years | 2 (2.4%) | 0 (0.0%) |
| 65 to 69 Years | 1 (1.2%) | 4 (4.6%) |
| 70 to 74 Years | 3 (3.5%) | 0 (0.0%) |
| 75 to 79 Years | 14 (16.5%) | 10 (11.5%) |
| 80 to 84 Years | 18 (21.2%) | 14 (16.1%) |
| 85 Years and over | 3 (3.5%) | 1 (1.1%) |
| Total | 85 (100.0%) | 87 (100.0%) |
Families and Households in Pineville
Median Family Size in Pineville
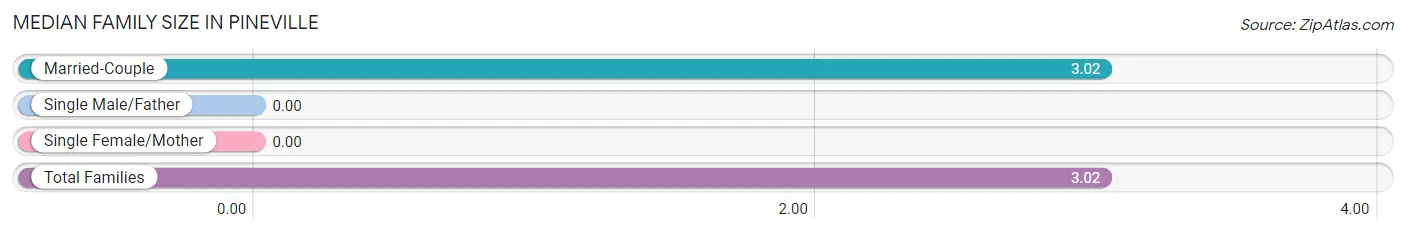
| Family Type | # Families | Family Size |
| Married-Couple | 52 (100.0%) | 3.02 |
| Single Male/Father | 0 (0.0%) | - |
| Single Female/Mother | 0 (0.0%) | - |
| Total Families | 52 (100.0%) | 3.02 |
Median Household Size in Pineville
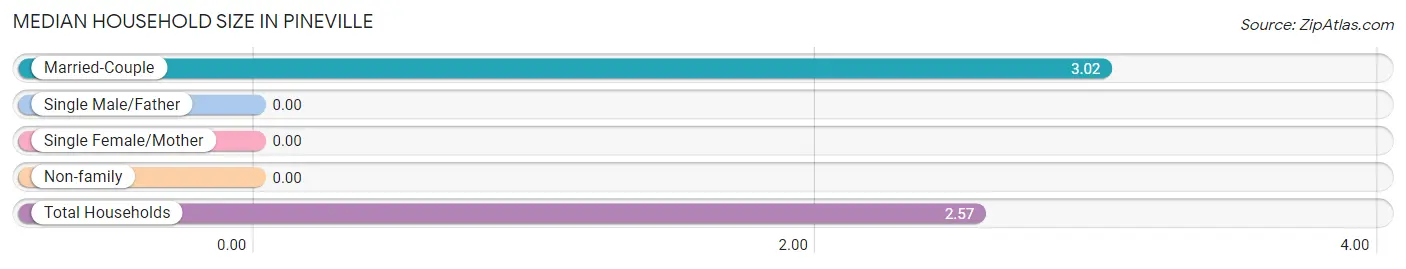
| Household Type | # Households | Household Size |
| Married-Couple | 52 (77.6%) | 3.02 |
| Single Male/Father | 0 (0.0%) | - |
| Single Female/Mother | 0 (0.0%) | - |
| Non-family | 15 (22.4%) | - |
| Total Households | 67 (100.0%) | 2.57 |
Household Size by Marriage Status in Pineville
Out of a total of 67 households in Pineville, 52 (77.6%) are family households, while 15 (22.4%) are nonfamily households. The most numerous type of family households are 2-person households, comprising 26, and the most common type of nonfamily households are 1-person households, comprising 15.
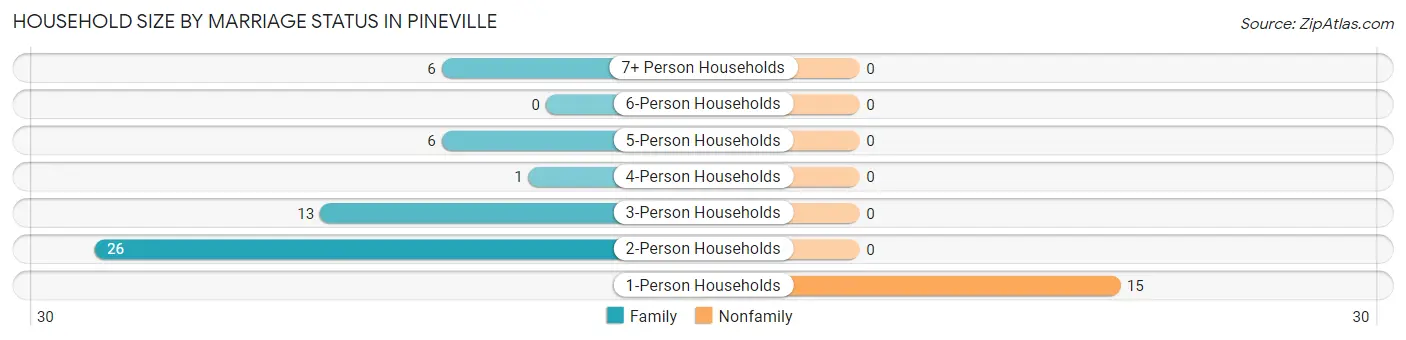
| Household Size | Family Households | Nonfamily Households |
| 1-Person Households | - | 15 (22.4%) |
| 2-Person Households | 26 (38.8%) | 0 (0.0%) |
| 3-Person Households | 13 (19.4%) | 0 (0.0%) |
| 4-Person Households | 1 (1.5%) | 0 (0.0%) |
| 5-Person Households | 6 (9.0%) | 0 (0.0%) |
| 6-Person Households | 0 (0.0%) | 0 (0.0%) |
| 7+ Person Households | 6 (9.0%) | 0 (0.0%) |
| Total | 52 (77.6%) | 15 (22.4%) |
Female Fertility in Pineville
Fertility by Age in Pineville
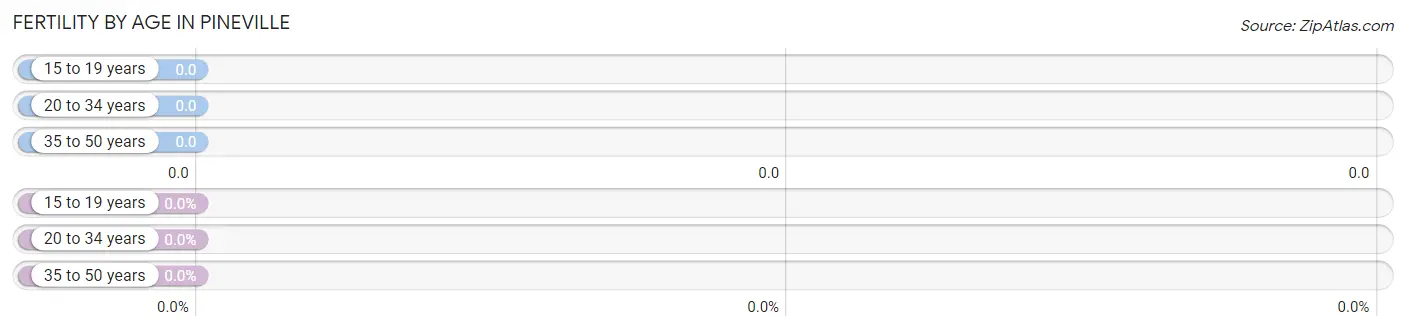
| Age Bracket | Women with Births | Births / 1,000 Women |
| 15 to 19 years | 0 (0.0%) | 0.0 |
| 20 to 34 years | 0 (0.0%) | 0.0 |
| 35 to 50 years | 0 (0.0%) | 0.0 |
| Total | 0 (0.0%) | 0.0 |
Fertility by Age by Marriage Status in Pineville
| Age Bracket | Married | Unmarried |
| 15 to 19 years | 0 (0.0%) | 0 (0.0%) |
| 20 to 34 years | 0 (0.0%) | 0 (0.0%) |
| 35 to 50 years | 0 (0.0%) | 0 (0.0%) |
| Total | 0 (0.0%) | 0 (0.0%) |
Fertility by Education in Pineville
| Educational Attainment | Women with Births | Births / 1,000 Women |
| Less than High School | 0 (0.0%) | 0.0 |
| High School Diploma | 0 (0.0%) | 0.0 |
| College or Associate's Degree | 0 (0.0%) | 0.0 |
| Bachelor's Degree | 0 (0.0%) | 0.0 |
| Graduate Degree | 0 (0.0%) | 0.0 |
| Total | 0 (0.0%) | 0.0 |
Fertility by Education by Marriage Status in Pineville
| Educational Attainment | Married | Unmarried |
| Less than High School | 0 (0.0%) | 0 (0.0%) |
| High School Diploma | 0 (0.0%) | 0 (0.0%) |
| College or Associate's Degree | 0 (0.0%) | 0 (0.0%) |
| Bachelor's Degree | 0 (0.0%) | 0 (0.0%) |
| Graduate Degree | 0 (0.0%) | 0 (0.0%) |
| Total | 0 (0.0%) | 0 (0.0%) |
Income in Pineville
Income Overview in Pineville
| Characteristic | Number | Measure |
| Per Capita Income | 172 | $18,974 |
| Median Family Income | 52 | $0 |
| Mean Family Income | 52 | $60,327 |
| Median Household Income | 67 | $0 |
| Mean Household Income | 67 | $50,999 |
| Income Deficit | 52 | $17,733 |
| Wage / Income Gap (%) | 172 | 0.00% |
| Wage / Income Gap ($) | 172 | 100.00¢ per $1 |
| Gini / Inequality Index | 172 | 0.61 |
Earnings by Sex in Pineville
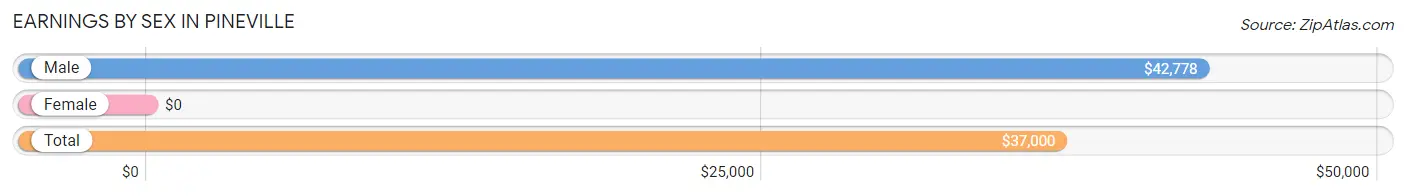
| Sex | Number | Average Earnings |
| Male | 22 (52.4%) | $42,778 |
| Female | 20 (47.6%) | $0 |
| Total | 42 (100.0%) | $37,000 |
Earnings by Sex by Income Bracket in Pineville
The most common earnings brackets in Pineville are $40,000 to $44,999 for men (9 | 40.9%) and $100,000+ for women (6 | 30.0%).
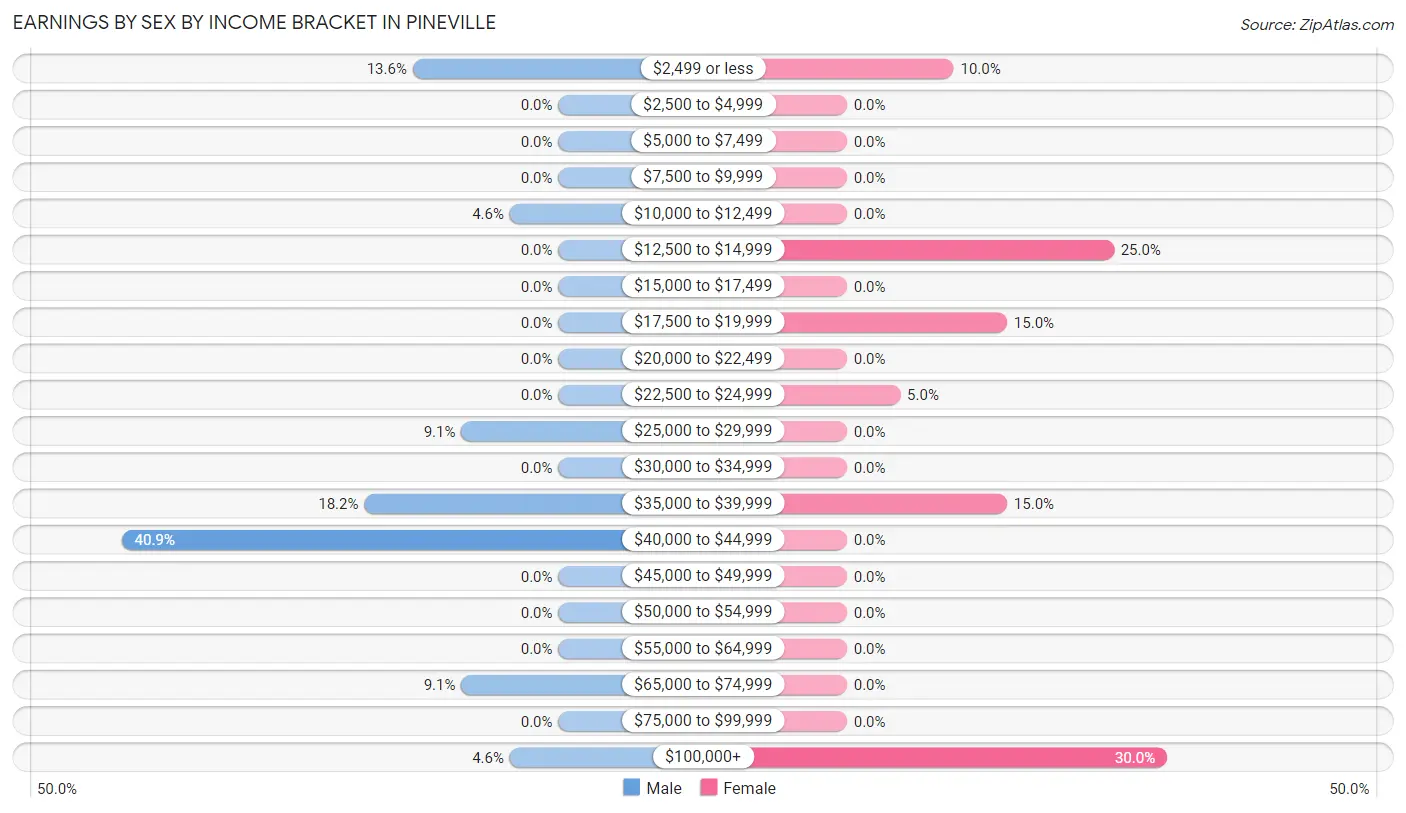
| Income | Male | Female |
| $2,499 or less | 3 (13.6%) | 2 (10.0%) |
| $2,500 to $4,999 | 0 (0.0%) | 0 (0.0%) |
| $5,000 to $7,499 | 0 (0.0%) | 0 (0.0%) |
| $7,500 to $9,999 | 0 (0.0%) | 0 (0.0%) |
| $10,000 to $12,499 | 1 (4.5%) | 0 (0.0%) |
| $12,500 to $14,999 | 0 (0.0%) | 5 (25.0%) |
| $15,000 to $17,499 | 0 (0.0%) | 0 (0.0%) |
| $17,500 to $19,999 | 0 (0.0%) | 3 (15.0%) |
| $20,000 to $22,499 | 0 (0.0%) | 0 (0.0%) |
| $22,500 to $24,999 | 0 (0.0%) | 1 (5.0%) |
| $25,000 to $29,999 | 2 (9.1%) | 0 (0.0%) |
| $30,000 to $34,999 | 0 (0.0%) | 0 (0.0%) |
| $35,000 to $39,999 | 4 (18.2%) | 3 (15.0%) |
| $40,000 to $44,999 | 9 (40.9%) | 0 (0.0%) |
| $45,000 to $49,999 | 0 (0.0%) | 0 (0.0%) |
| $50,000 to $54,999 | 0 (0.0%) | 0 (0.0%) |
| $55,000 to $64,999 | 0 (0.0%) | 0 (0.0%) |
| $65,000 to $74,999 | 2 (9.1%) | 0 (0.0%) |
| $75,000 to $99,999 | 0 (0.0%) | 0 (0.0%) |
| $100,000+ | 1 (4.5%) | 6 (30.0%) |
| Total | 22 (100.0%) | 20 (100.0%) |
Earnings by Sex by Educational Attainment in Pineville
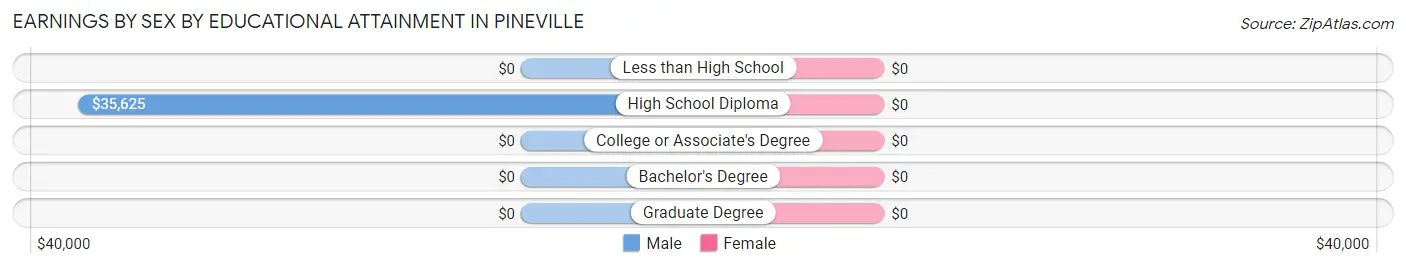
| Educational Attainment | Male Income | Female Income |
| Less than High School | - | - |
| High School Diploma | $35,625 | $0 |
| College or Associate's Degree | - | - |
| Bachelor's Degree | - | - |
| Graduate Degree | - | - |
| Total | $43,472 | $0 |
Family Income in Pineville
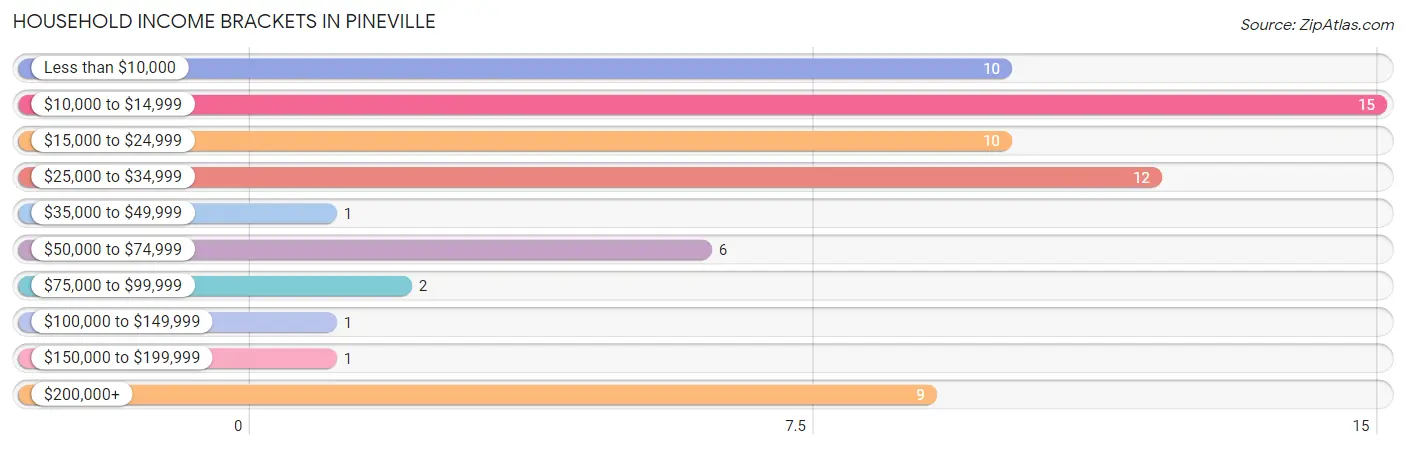
Family Income Brackets in Pineville
According to the Pineville family income data, there are 11 families falling into the $10,000 to $14,999 income range, which is the most common income bracket and makes up 21.1% of all families. Conversely, the $35,000 to $49,999 income bracket is the least frequent group with only 1 families (1.9%) belonging to this category.
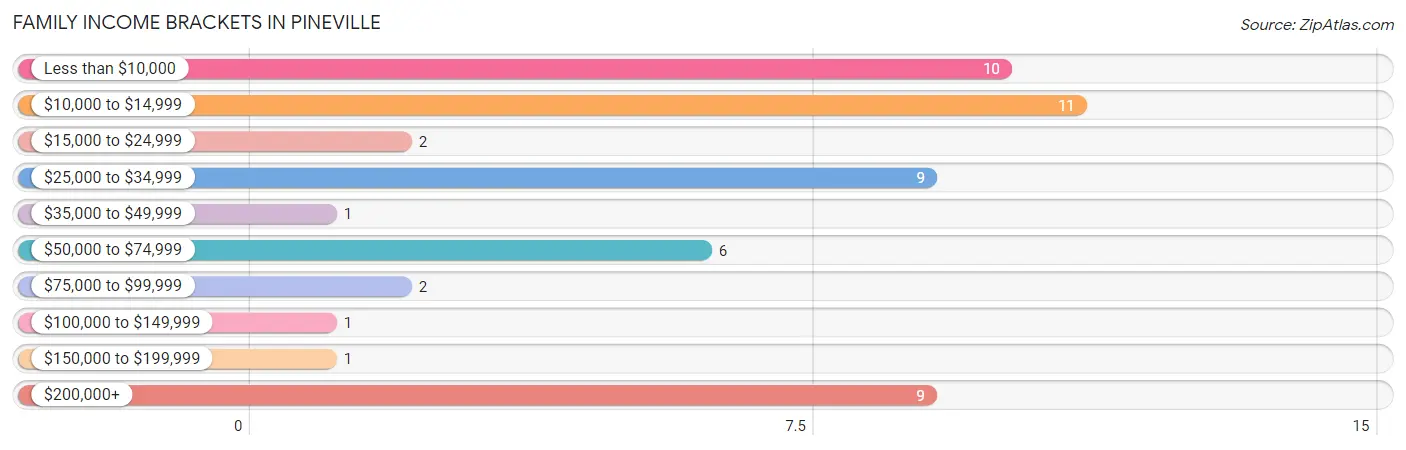
| Income Bracket | # Families | % Families |
| Less than $10,000 | 10 | 19.2% |
| $10,000 to $14,999 | 11 | 21.2% |
| $15,000 to $24,999 | 2 | 3.8% |
| $25,000 to $34,999 | 9 | 17.3% |
| $35,000 to $49,999 | 1 | 1.9% |
| $50,000 to $74,999 | 6 | 11.5% |
| $75,000 to $99,999 | 2 | 3.8% |
| $100,000 to $149,999 | 1 | 1.9% |
| $150,000 to $199,999 | 1 | 1.9% |
| $200,000+ | 9 | 17.3% |
Family Income by Famaliy Size in Pineville
3-person families (13 | 25.0%) account for the highest median family income in Pineville with $208,194 per family, while 3-person families (13 | 25.0%) have the highest median income of $69,398 per family member.
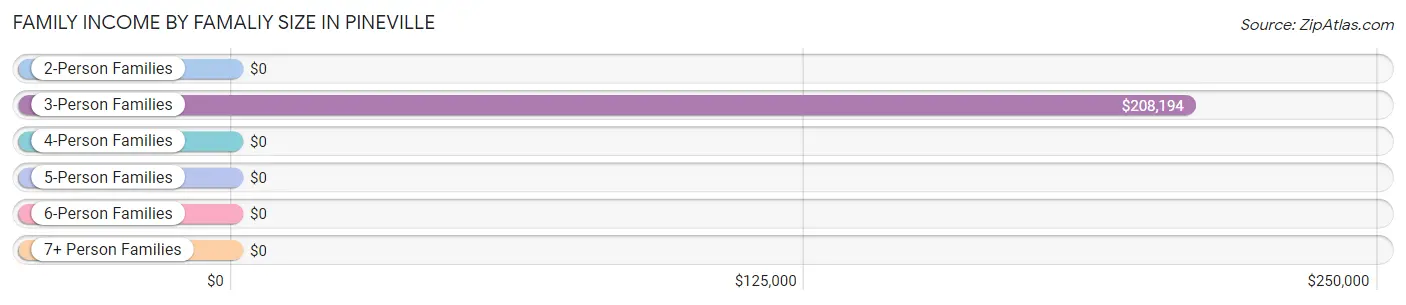
| Income Bracket | # Families | Median Income |
| 2-Person Families | 26 (50.0%) | $0 |
| 3-Person Families | 13 (25.0%) | $208,194 |
| 4-Person Families | 1 (1.9%) | $0 |
| 5-Person Families | 6 (11.5%) | $0 |
| 6-Person Families | 0 (0.0%) | $0 |
| 7+ Person Families | 6 (11.5%) | $0 |
| Total | 52 (100.0%) | $0 |
Family Income by Number of Earners in Pineville
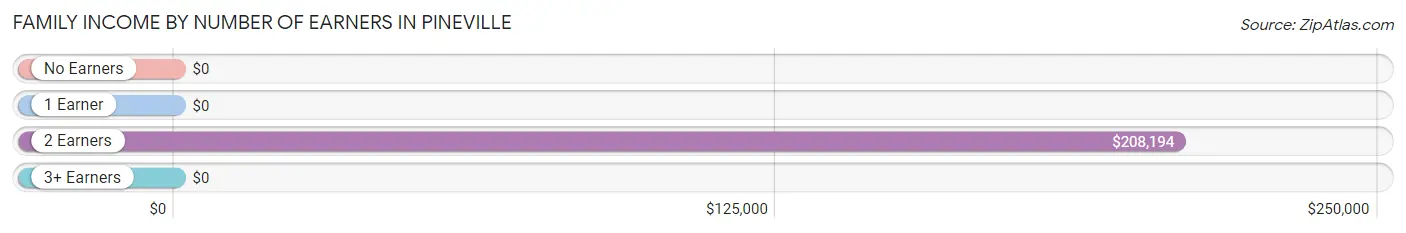
| Number of Earners | # Families | Median Income |
| No Earners | 21 (40.4%) | $0 |
| 1 Earner | 17 (32.7%) | $0 |
| 2 Earners | 13 (25.0%) | $208,194 |
| 3+ Earners | 1 (1.9%) | $0 |
| Total | 52 (100.0%) | $0 |
Household Income in Pineville
Household Income Brackets in Pineville
With 15 households falling in the category, the $10,000 to $14,999 income range is the most frequent in Pineville, accounting for 22.4% of all households. In contrast, only 1 households (1.5%) fall into the $35,000 to $49,999 income bracket, making it the least populous group.
| Income Bracket | # Households | % Households |
| Less than $10,000 | 10 | 14.9% |
| $10,000 to $14,999 | 15 | 22.4% |
| $15,000 to $24,999 | 10 | 14.9% |
| $25,000 to $34,999 | 12 | 17.9% |
| $35,000 to $49,999 | 1 | 1.5% |
| $50,000 to $74,999 | 6 | 9.0% |
| $75,000 to $99,999 | 2 | 3.0% |
| $100,000 to $149,999 | 1 | 1.5% |
| $150,000 to $199,999 | 1 | 1.5% |
| $200,000+ | 9 | 13.4% |
Household Income by Householder Age in Pineville
| Income Bracket | # Households | Median Income |
| 15 to 24 Years | 1 (1.5%) | $0 |
| 25 to 44 Years | 1 (1.5%) | $0 |
| 45 to 64 Years | 25 (37.3%) | $0 |
| 65+ Years | 40 (59.7%) | $0 |
| Total | 67 (100.0%) | $0 |
Poverty in Pineville
Income Below Poverty by Sex and Age in Pineville
With 36.5% poverty level for males and 28.7% for females among the residents of Pineville, under 5 year old males and 6 to 11 year old females are the most vulnerable to poverty, with 6 males (100.0%) and 4 females (100.0%) in their respective age groups living below the poverty level.
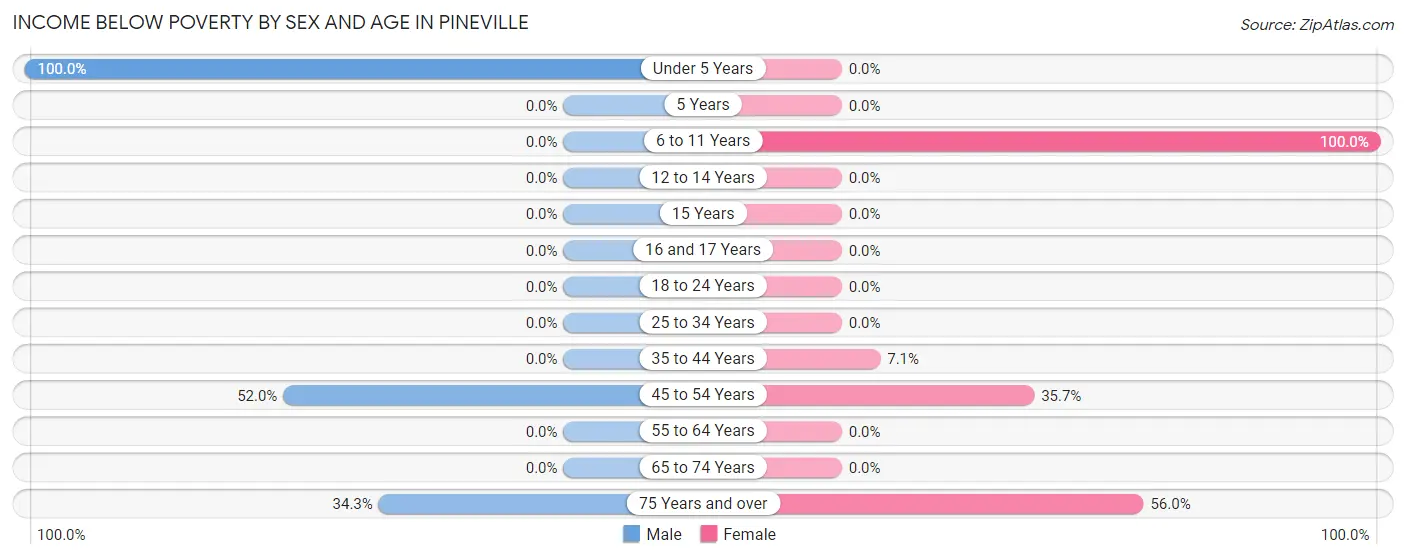
| Age Bracket | Male | Female |
| Under 5 Years | 6 (100.0%) | 0 (0.0%) |
| 5 Years | 0 (0.0%) | 0 (0.0%) |
| 6 to 11 Years | 0 (0.0%) | 4 (100.0%) |
| 12 to 14 Years | 0 (0.0%) | 0 (0.0%) |
| 15 Years | 0 (0.0%) | 0 (0.0%) |
| 16 and 17 Years | 0 (0.0%) | 0 (0.0%) |
| 18 to 24 Years | 0 (0.0%) | 0 (0.0%) |
| 25 to 34 Years | 0 (0.0%) | 0 (0.0%) |
| 35 to 44 Years | 0 (0.0%) | 2 (7.1%) |
| 45 to 54 Years | 13 (52.0%) | 5 (35.7%) |
| 55 to 64 Years | 0 (0.0%) | 0 (0.0%) |
| 65 to 74 Years | 0 (0.0%) | 0 (0.0%) |
| 75 Years and over | 12 (34.3%) | 14 (56.0%) |
| Total | 31 (36.5%) | 25 (28.7%) |
Income Above Poverty by Sex and Age in Pineville
According to the poverty statistics in Pineville, males aged 6 to 11 years and females aged under 5 years are the age groups that are most secure financially, with 100.0% of males and 100.0% of females in these age groups living above the poverty line.
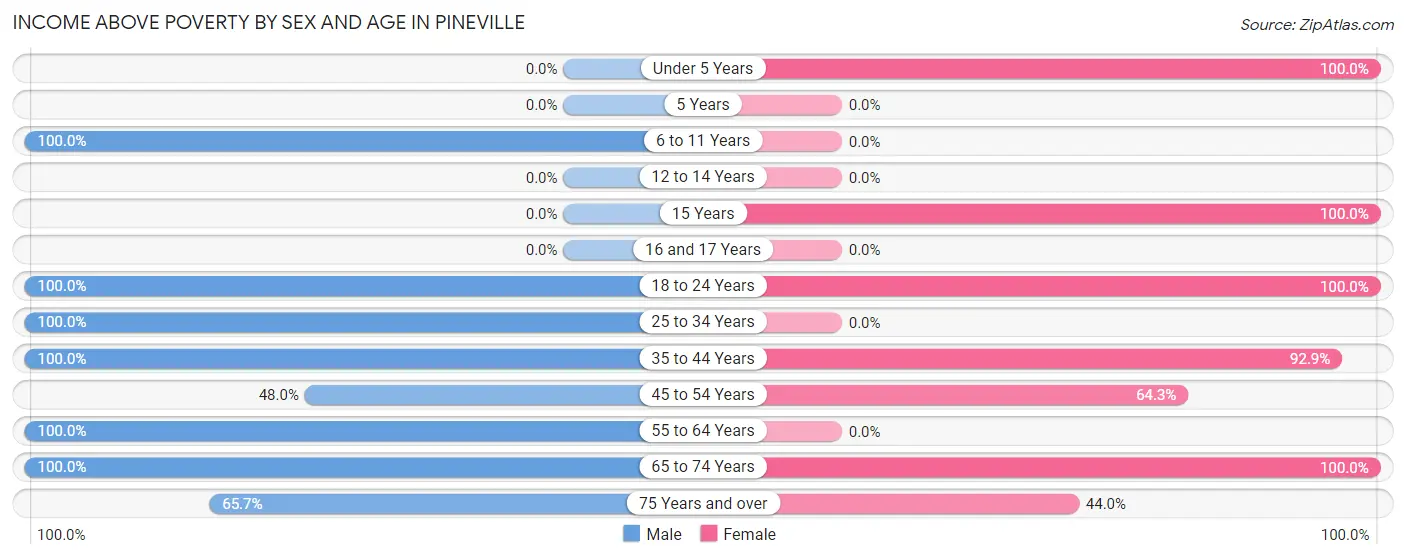
| Age Bracket | Male | Female |
| Under 5 Years | 0 (0.0%) | 1 (100.0%) |
| 5 Years | 0 (0.0%) | 0 (0.0%) |
| 6 to 11 Years | 5 (100.0%) | 0 (0.0%) |
| 12 to 14 Years | 0 (0.0%) | 0 (0.0%) |
| 15 Years | 0 (0.0%) | 7 (100.0%) |
| 16 and 17 Years | 0 (0.0%) | 0 (0.0%) |
| 18 to 24 Years | 5 (100.0%) | 4 (100.0%) |
| 25 to 34 Years | 2 (100.0%) | 0 (0.0%) |
| 35 to 44 Years | 1 (100.0%) | 26 (92.9%) |
| 45 to 54 Years | 12 (48.0%) | 9 (64.3%) |
| 55 to 64 Years | 2 (100.0%) | 0 (0.0%) |
| 65 to 74 Years | 4 (100.0%) | 4 (100.0%) |
| 75 Years and over | 23 (65.7%) | 11 (44.0%) |
| Total | 54 (63.5%) | 62 (71.3%) |
Income Below Poverty Among Married-Couple Families in Pineville
The poverty statistics for married-couple families in Pineville show that 40.4% or 21 of the total 52 families live below the poverty line. Families with 5 or more children have the highest poverty rate of 100.0%, comprising of 6 families. On the other hand, families with 1 or 2 children have the lowest poverty rate of 0.0%, which includes 0 families.

| Children | Above Poverty | Below Poverty |
| No Children | 15 (50.0%) | 15 (50.0%) |
| 1 or 2 Children | 16 (100.0%) | 0 (0.0%) |
| 3 or 4 Children | 0 (0.0%) | 0 (0.0%) |
| 5 or more Children | 0 (0.0%) | 6 (100.0%) |
| Total | 31 (59.6%) | 21 (40.4%) |
Income Below Poverty Among Single-Parent Households in Pineville
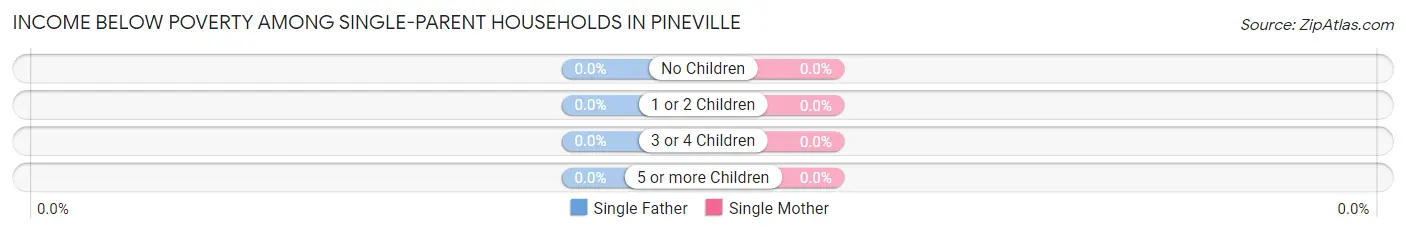
| Children | Single Father | Single Mother |
| No Children | 0 (0.0%) | 0 (0.0%) |
| 1 or 2 Children | 0 (0.0%) | 0 (0.0%) |
| 3 or 4 Children | 0 (0.0%) | 0 (0.0%) |
| 5 or more Children | 0 (0.0%) | 0 (0.0%) |
| Total | 0 (0.0%) | 0 (0.0%) |
Income Below Poverty Among Married-Couple vs Single-Parent Households in Pineville
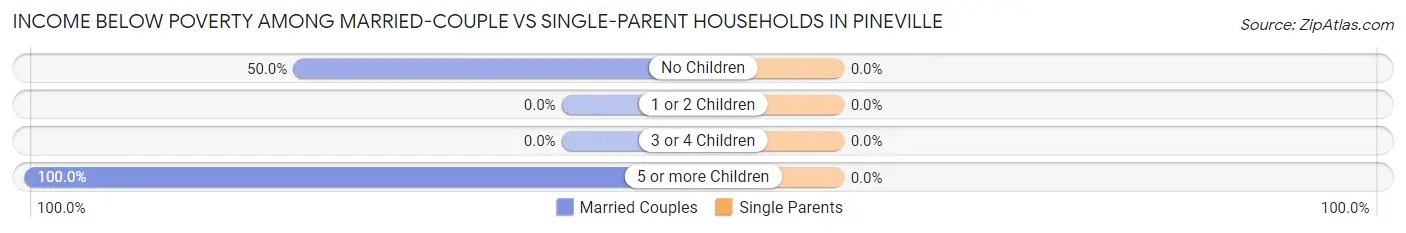
| Children | Married-Couple Families | Single-Parent Households |
| No Children | 15 (50.0%) | 0 (0.0%) |
| 1 or 2 Children | 0 (0.0%) | 0 (0.0%) |
| 3 or 4 Children | 0 (0.0%) | 0 (0.0%) |
| 5 or more Children | 6 (100.0%) | 0 (0.0%) |
| Total | 21 (40.4%) | 0 (0.0%) |
Employment Characteristics in Pineville
Employment by Class of Employer in Pineville
Among the 42 employed individuals in Pineville, self-employed (incorporated) (19 | 45.2%), private company employees (8 | 19.1%), and self-employed (not incorporated) (5 | 11.9%) make up the most common classes of employment.
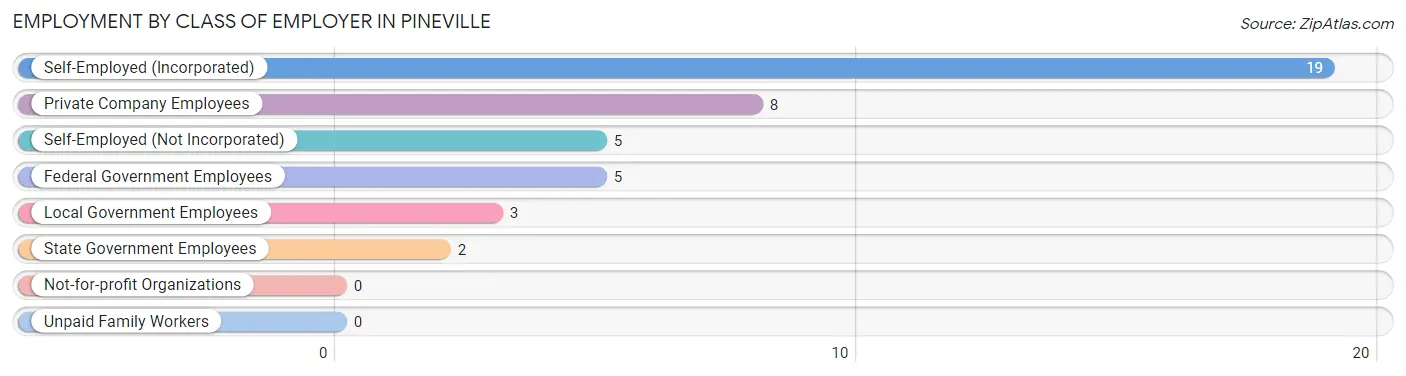
| Employer Class | # Employees | % Employees |
| Private Company Employees | 8 | 19.1% |
| Self-Employed (Incorporated) | 19 | 45.2% |
| Self-Employed (Not Incorporated) | 5 | 11.9% |
| Not-for-profit Organizations | 0 | 0.0% |
| Local Government Employees | 3 | 7.1% |
| State Government Employees | 2 | 4.8% |
| Federal Government Employees | 5 | 11.9% |
| Unpaid Family Workers | 0 | 0.0% |
| Total | 42 | 100.0% |
Employment Status by Age in Pineville
According to the labor force statistics for Pineville, out of the total population over 16 years of age (149), 42.3% or 63 individuals are in the labor force, with 34.4% or 22 of them unemployed. The age group with the highest labor force participation rate is 16 to 19 years, with 100.0% or 3 individuals in the labor force. Within the labor force, the 35 to 44 years age range has the highest percentage of unemployed individuals, with 77.8% or 14 of them being unemployed.
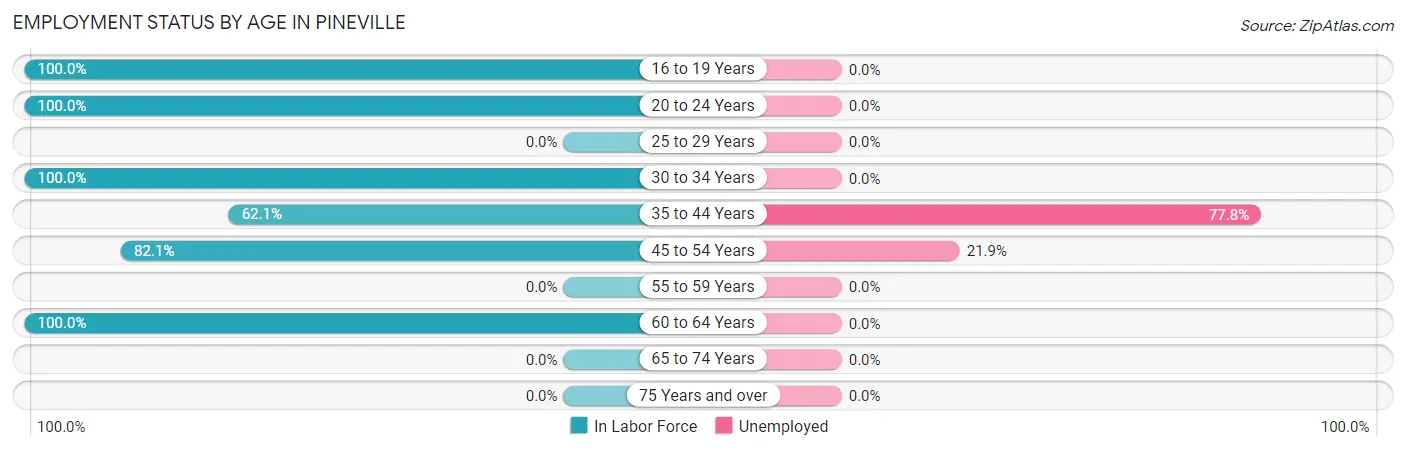
| Age Bracket | In Labor Force | Unemployed |
| 16 to 19 Years | 3 (100.0%) | 0 (0.0%) |
| 20 to 24 Years | 6 (100.0%) | 0 (0.0%) |
| 25 to 29 Years | 0 (0.0%) | 0 (0.0%) |
| 30 to 34 Years | 2 (100.0%) | 0 (0.0%) |
| 35 to 44 Years | 18 (62.1%) | 14 (77.8%) |
| 45 to 54 Years | 32 (82.1%) | 7 (21.9%) |
| 55 to 59 Years | 0 (0.0%) | 0 (0.0%) |
| 60 to 64 Years | 2 (100.0%) | 0 (0.0%) |
| 65 to 74 Years | 0 (0.0%) | 0 (0.0%) |
| 75 Years and over | 0 (0.0%) | 0 (0.0%) |
| Total | 63 (42.3%) | 22 (34.4%) |
Employment Status by Educational Attainment in Pineville
According to labor force statistics for Pineville, 75.0% of individuals (54) out of the total population between 25 and 64 years of age (72) are in the labor force, with 38.9% or 21 of them being unemployed. The group with the highest labor force participation rate are those with the educational attainment of college / associate degree, with 100.0% or 26 individuals in the labor force. Within the labor force, individuals with college / associate degree education have the highest percentage of unemployment, with 80.8% or 21 of them being unemployed.
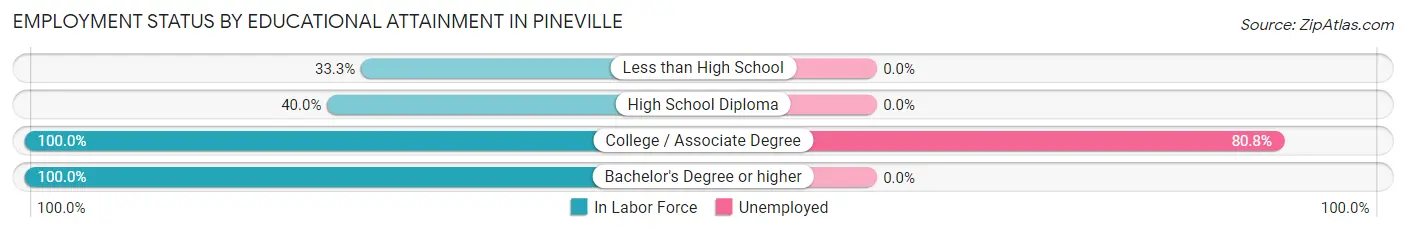
| Educational Attainment | In Labor Force | Unemployed |
| Less than High School | 3 (33.3%) | 0 (0.0%) |
| High School Diploma | 8 (40.0%) | 0 (0.0%) |
| College / Associate Degree | 26 (100.0%) | 21 (80.8%) |
| Bachelor's Degree or higher | 17 (100.0%) | 0 (0.0%) |
| Total | 54 (75.0%) | 28 (38.9%) |
Employment Occupations by Sex in Pineville
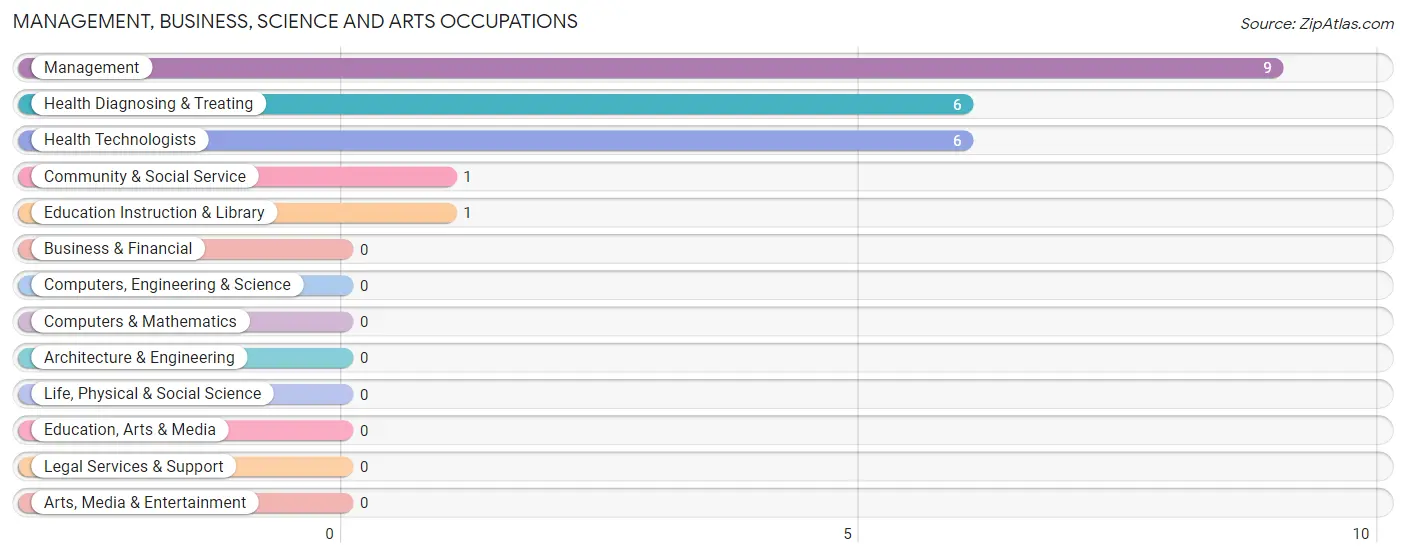
Management, Business, Science and Arts Occupations
The most common Management, Business, Science and Arts occupations in Pineville are Management (9 | 22.5%), Health Diagnosing & Treating (6 | 15.0%), Health Technologists (6 | 15.0%), Community & Social Service (1 | 2.5%), and Education Instruction & Library (1 | 2.5%).
Management, Business, Science and Arts Occupations by Sex
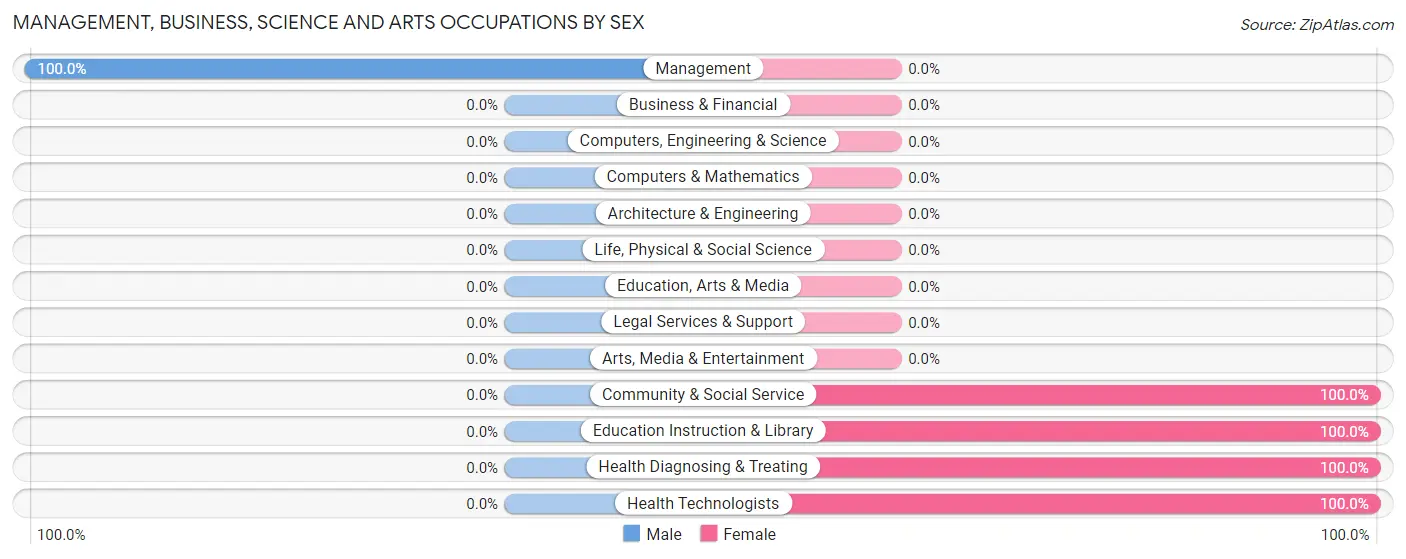
| Occupation | Male | Female |
| Management | 9 (100.0%) | 0 (0.0%) |
| Business & Financial | 0 (0.0%) | 0 (0.0%) |
| Computers, Engineering & Science | 0 (0.0%) | 0 (0.0%) |
| Computers & Mathematics | 0 (0.0%) | 0 (0.0%) |
| Architecture & Engineering | 0 (0.0%) | 0 (0.0%) |
| Life, Physical & Social Science | 0 (0.0%) | 0 (0.0%) |
| Community & Social Service | 0 (0.0%) | 1 (100.0%) |
| Education, Arts & Media | 0 (0.0%) | 0 (0.0%) |
| Legal Services & Support | 0 (0.0%) | 0 (0.0%) |
| Education Instruction & Library | 0 (0.0%) | 1 (100.0%) |
| Arts, Media & Entertainment | 0 (0.0%) | 0 (0.0%) |
| Health Diagnosing & Treating | 0 (0.0%) | 6 (100.0%) |
| Health Technologists | 0 (0.0%) | 6 (100.0%) |
| Total (Category) | 9 (56.2%) | 7 (43.8%) |
| Total (Overall) | 20 (50.0%) | 20 (50.0%) |
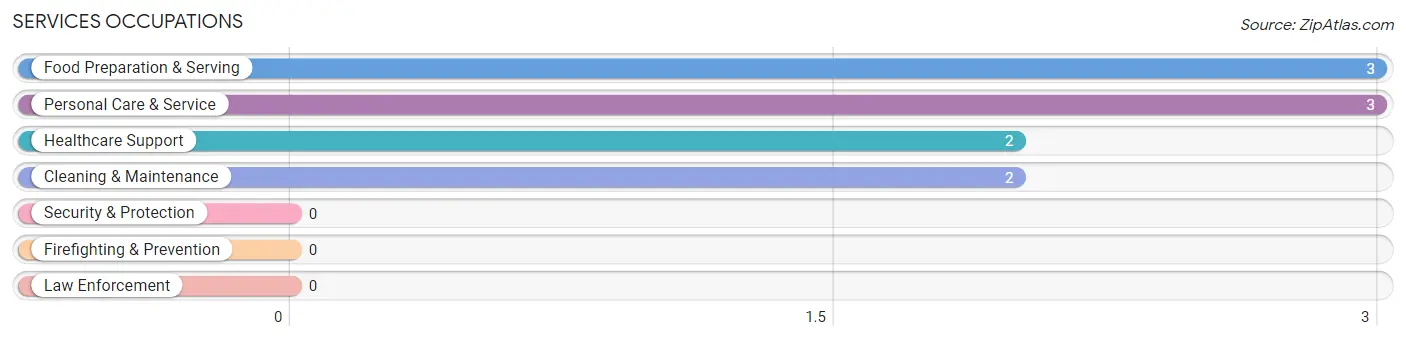
Services Occupations
The most common Services occupations in Pineville are Food Preparation & Serving (3 | 7.5%), Personal Care & Service (3 | 7.5%), Healthcare Support (2 | 5.0%), and Cleaning & Maintenance (2 | 5.0%).
Services Occupations by Sex
Within the Services occupations in Pineville, the most male-oriented occupations are Food Preparation & Serving (100.0%), and Cleaning & Maintenance (100.0%), while the most female-oriented occupations are Healthcare Support (100.0%), and Personal Care & Service (100.0%).
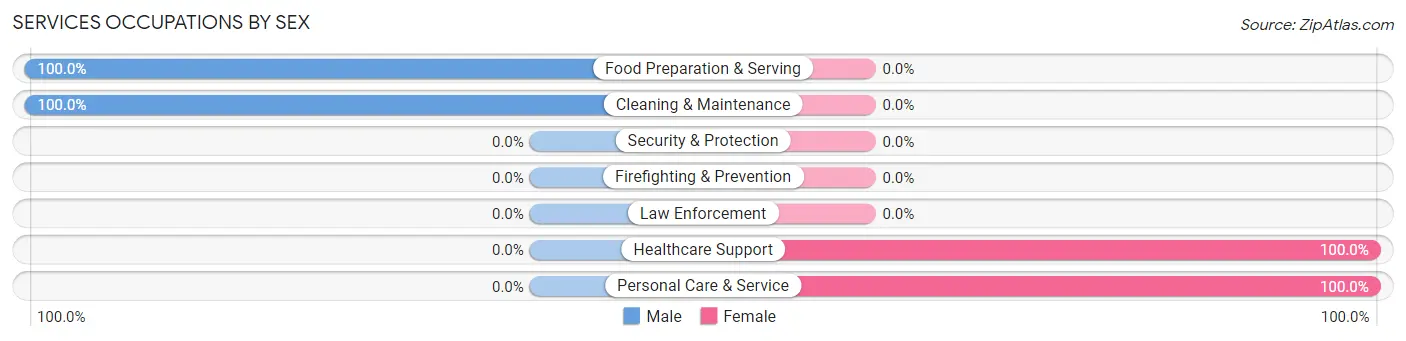
| Occupation | Male | Female |
| Healthcare Support | 0 (0.0%) | 2 (100.0%) |
| Security & Protection | 0 (0.0%) | 0 (0.0%) |
| Firefighting & Prevention | 0 (0.0%) | 0 (0.0%) |
| Law Enforcement | 0 (0.0%) | 0 (0.0%) |
| Food Preparation & Serving | 3 (100.0%) | 0 (0.0%) |
| Cleaning & Maintenance | 2 (100.0%) | 0 (0.0%) |
| Personal Care & Service | 0 (0.0%) | 3 (100.0%) |
| Total (Category) | 5 (50.0%) | 5 (50.0%) |
| Total (Overall) | 20 (50.0%) | 20 (50.0%) |
Sales and Office Occupations
The most common Sales and Office occupations in Pineville are Office & Administration (5 | 12.5%), and Sales & Related (1 | 2.5%).

Sales and Office Occupations by Sex
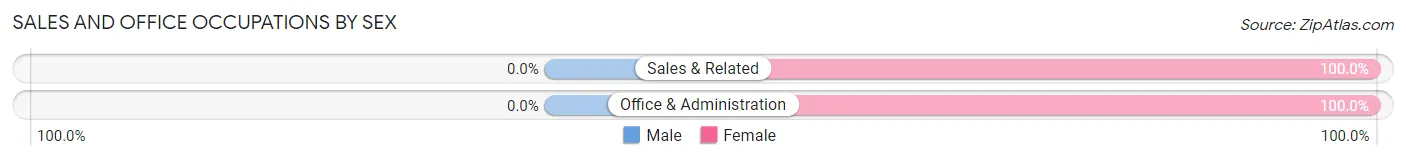
| Occupation | Male | Female |
| Sales & Related | 0 (0.0%) | 1 (100.0%) |
| Office & Administration | 0 (0.0%) | 5 (100.0%) |
| Total (Category) | 0 (0.0%) | 6 (100.0%) |
| Total (Overall) | 20 (50.0%) | 20 (50.0%) |
Natural Resources, Construction and Maintenance Occupations
The most common Natural Resources, Construction and Maintenance occupations in Pineville are , and Construction & Extraction (1 | 2.5%).
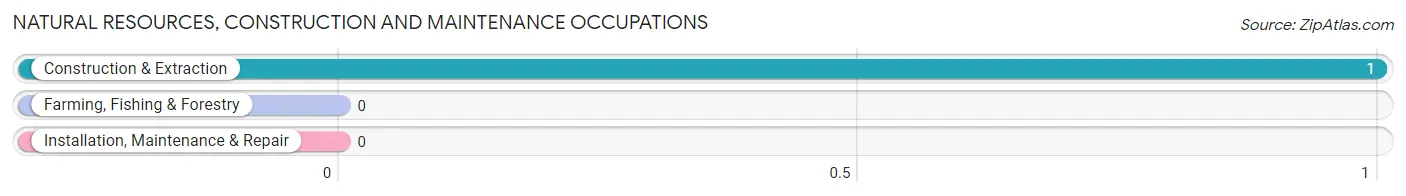
Natural Resources, Construction and Maintenance Occupations by Sex
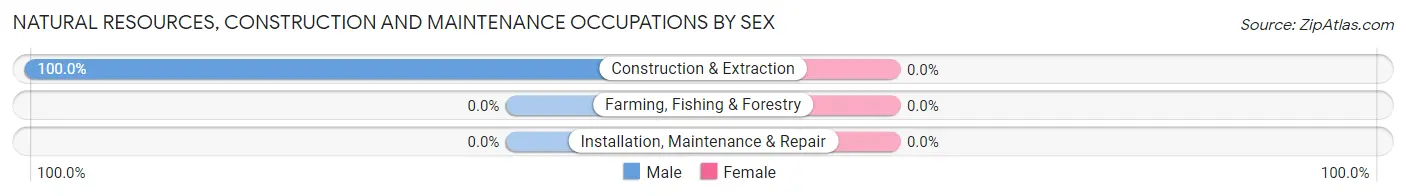
| Occupation | Male | Female |
| Farming, Fishing & Forestry | 0 (0.0%) | 0 (0.0%) |
| Construction & Extraction | 1 (100.0%) | 0 (0.0%) |
| Installation, Maintenance & Repair | 0 (0.0%) | 0 (0.0%) |
| Total (Category) | 1 (100.0%) | 0 (0.0%) |
| Total (Overall) | 20 (50.0%) | 20 (50.0%) |
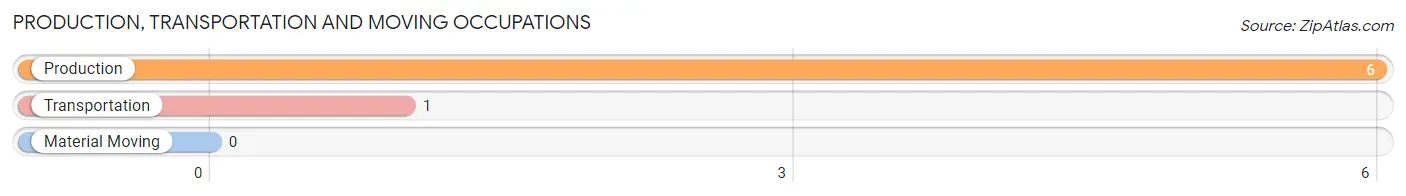
Production, Transportation and Moving Occupations
The most common Production, Transportation and Moving occupations in Pineville are Production (6 | 15.0%), and Transportation (1 | 2.5%).
Production, Transportation and Moving Occupations by Sex
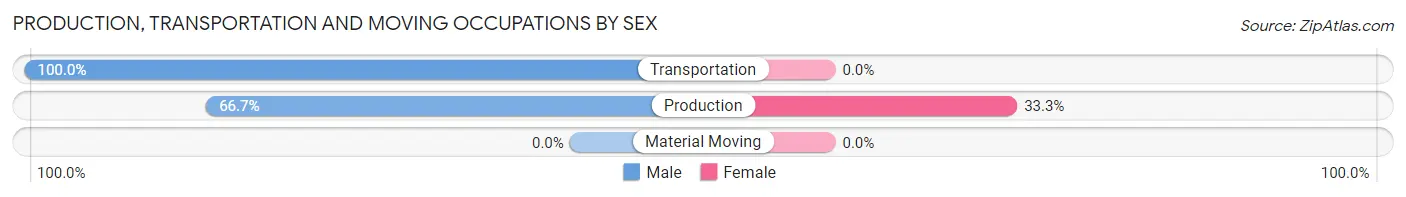
| Occupation | Male | Female |
| Production | 4 (66.7%) | 2 (33.3%) |
| Transportation | 1 (100.0%) | 0 (0.0%) |
| Material Moving | 0 (0.0%) | 0 (0.0%) |
| Total (Category) | 5 (71.4%) | 2 (28.6%) |
| Total (Overall) | 20 (50.0%) | 20 (50.0%) |
Employment Industries by Sex in Pineville
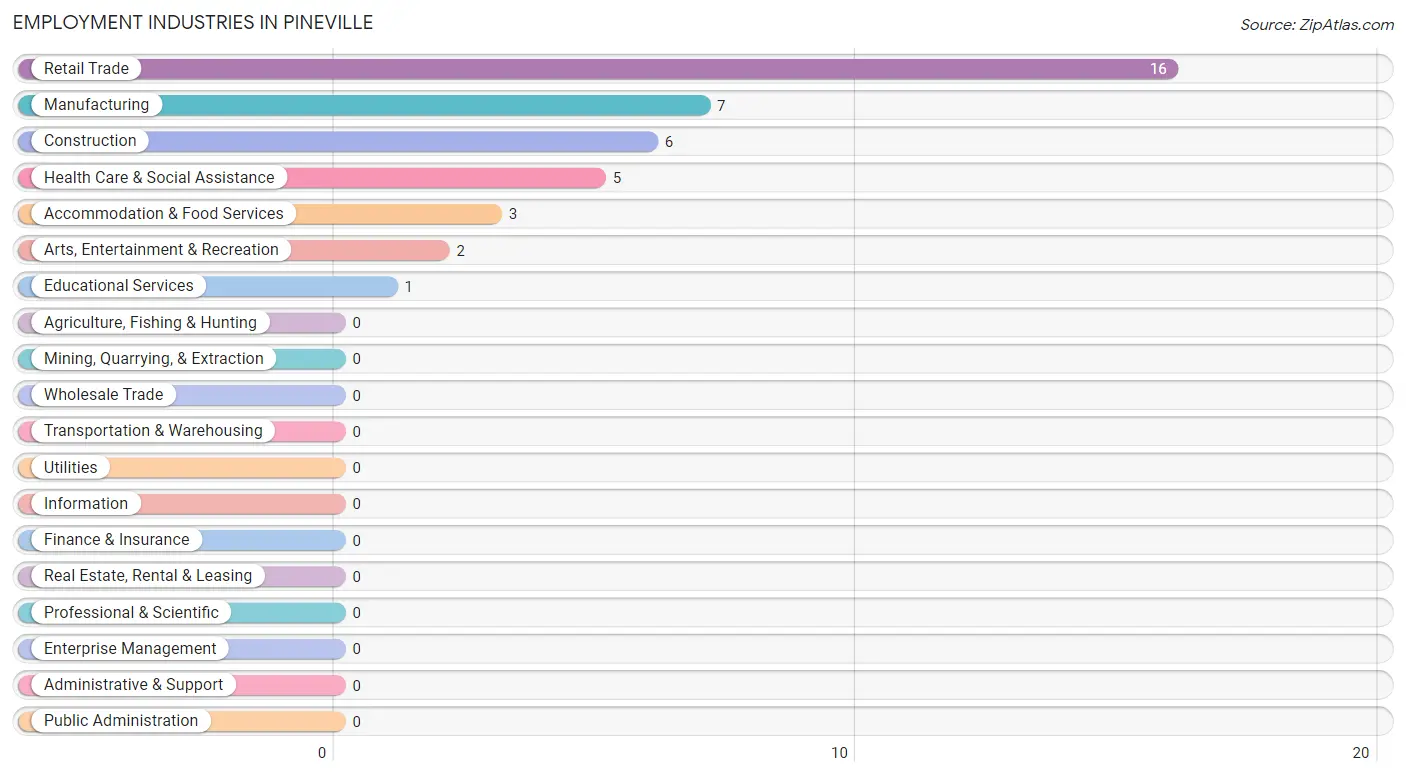
Employment Industries in Pineville
The major employment industries in Pineville include Retail Trade (16 | 40.0%), Manufacturing (7 | 17.5%), Construction (6 | 15.0%), Health Care & Social Assistance (5 | 12.5%), and Accommodation & Food Services (3 | 7.5%).
Employment Industries by Sex in Pineville
The Pineville industries that see more men than women are Arts, Entertainment & Recreation (100.0%), Accommodation & Food Services (100.0%), and Manufacturing (71.4%), whereas the industries that tend to have a higher number of women are Educational Services (100.0%), Health Care & Social Assistance (100.0%), and Construction (83.3%).
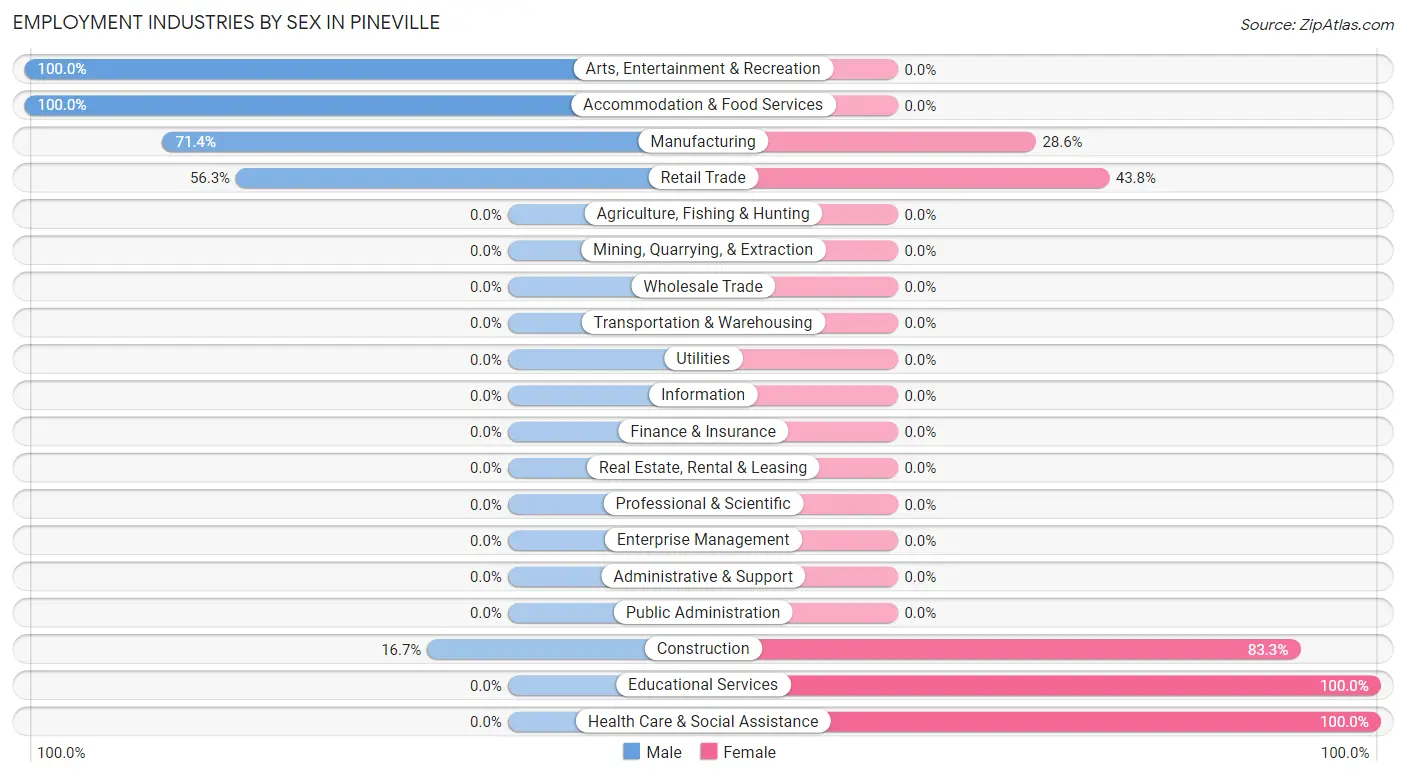
| Industry | Male | Female |
| Agriculture, Fishing & Hunting | 0 (0.0%) | 0 (0.0%) |
| Mining, Quarrying, & Extraction | 0 (0.0%) | 0 (0.0%) |
| Construction | 1 (16.7%) | 5 (83.3%) |
| Manufacturing | 5 (71.4%) | 2 (28.6%) |
| Wholesale Trade | 0 (0.0%) | 0 (0.0%) |
| Retail Trade | 9 (56.2%) | 7 (43.8%) |
| Transportation & Warehousing | 0 (0.0%) | 0 (0.0%) |
| Utilities | 0 (0.0%) | 0 (0.0%) |
| Information | 0 (0.0%) | 0 (0.0%) |
| Finance & Insurance | 0 (0.0%) | 0 (0.0%) |
| Real Estate, Rental & Leasing | 0 (0.0%) | 0 (0.0%) |
| Professional & Scientific | 0 (0.0%) | 0 (0.0%) |
| Enterprise Management | 0 (0.0%) | 0 (0.0%) |
| Administrative & Support | 0 (0.0%) | 0 (0.0%) |
| Educational Services | 0 (0.0%) | 1 (100.0%) |
| Health Care & Social Assistance | 0 (0.0%) | 5 (100.0%) |
| Arts, Entertainment & Recreation | 2 (100.0%) | 0 (0.0%) |
| Accommodation & Food Services | 3 (100.0%) | 0 (0.0%) |
| Public Administration | 0 (0.0%) | 0 (0.0%) |
| Total | 20 (50.0%) | 20 (50.0%) |
Education in Pineville
School Enrollment in Pineville
The most common levels of schooling among the 18 students in Pineville are elementary school (7 | 38.9%), high school (7 | 38.9%), and kindergarten (2 | 11.1%).
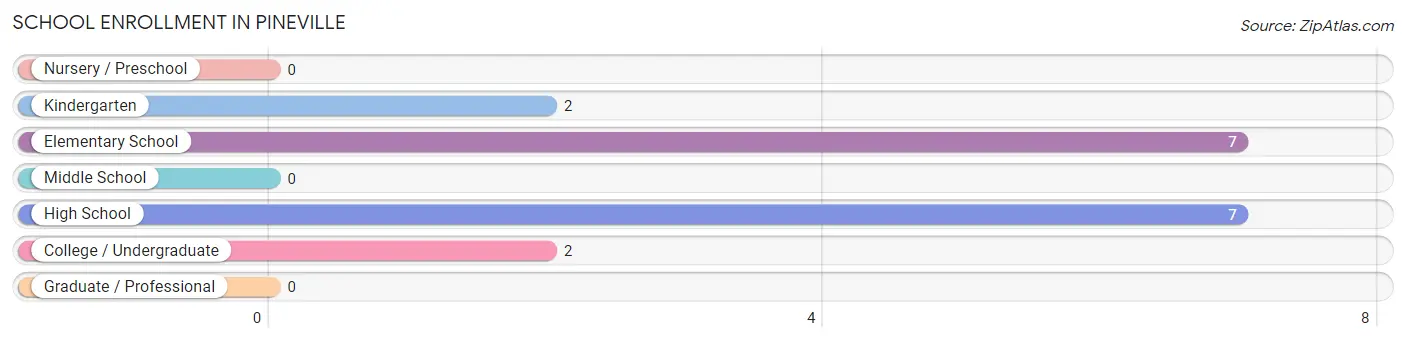
| School Level | # Students | % Students |
| Nursery / Preschool | 0 | 0.0% |
| Kindergarten | 2 | 11.1% |
| Elementary School | 7 | 38.9% |
| Middle School | 0 | 0.0% |
| High School | 7 | 38.9% |
| College / Undergraduate | 2 | 11.1% |
| Graduate / Professional | 0 | 0.0% |
| Total | 18 | 100.0% |
School Enrollment by Age by Funding Source in Pineville
Out of a total of 18 students who are enrolled in schools in Pineville, 2 (11.1%) attend a private institution, while the remaining 16 (88.9%) are enrolled in public schools. The age group of 20 to 24 year olds has the highest likelihood of being enrolled in private schools, with 2 (100.0% in the age bracket) enrolled. Conversely, the age group of 5 to 9 year old has the lowest likelihood of being enrolled in a private school, with 9 (100.0% in the age bracket) attending a public institution.
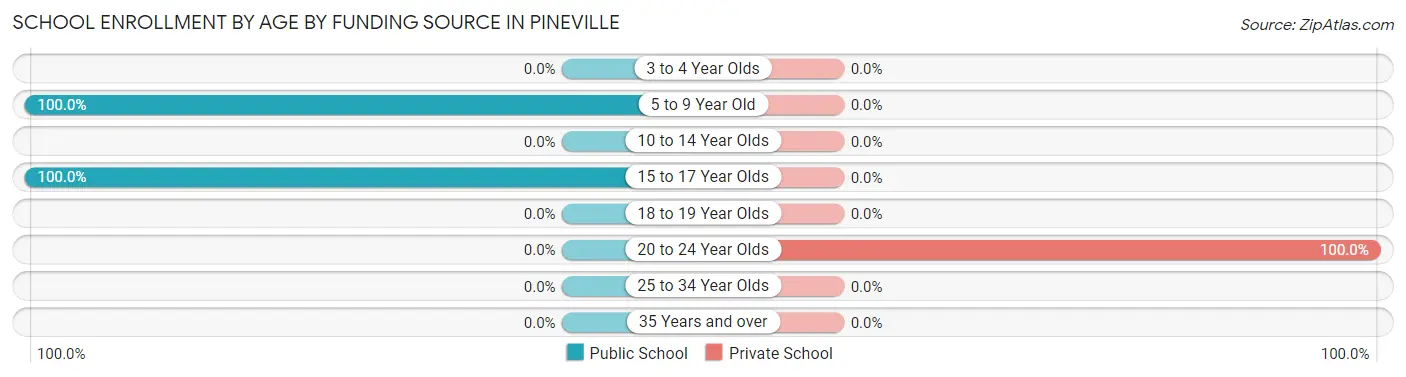
| Age Bracket | Public School | Private School |
| 3 to 4 Year Olds | 0 (0.0%) | 0 (0.0%) |
| 5 to 9 Year Old | 9 (100.0%) | 0 (0.0%) |
| 10 to 14 Year Olds | 0 (0.0%) | 0 (0.0%) |
| 15 to 17 Year Olds | 7 (100.0%) | 0 (0.0%) |
| 18 to 19 Year Olds | 0 (0.0%) | 0 (0.0%) |
| 20 to 24 Year Olds | 0 (0.0%) | 2 (100.0%) |
| 25 to 34 Year Olds | 0 (0.0%) | 0 (0.0%) |
| 35 Years and over | 0 (0.0%) | 0 (0.0%) |
| Total | 16 (88.9%) | 2 (11.1%) |
Educational Attainment by Field of Study in Pineville
Bio, nature & agricultural (9 | 34.6%), physical & health sciences (9 | 34.6%), science & technology (6 | 23.1%), and business (2 | 7.7%) are the most common fields of study among 26 individuals in Pineville who have obtained a bachelor's degree or higher.
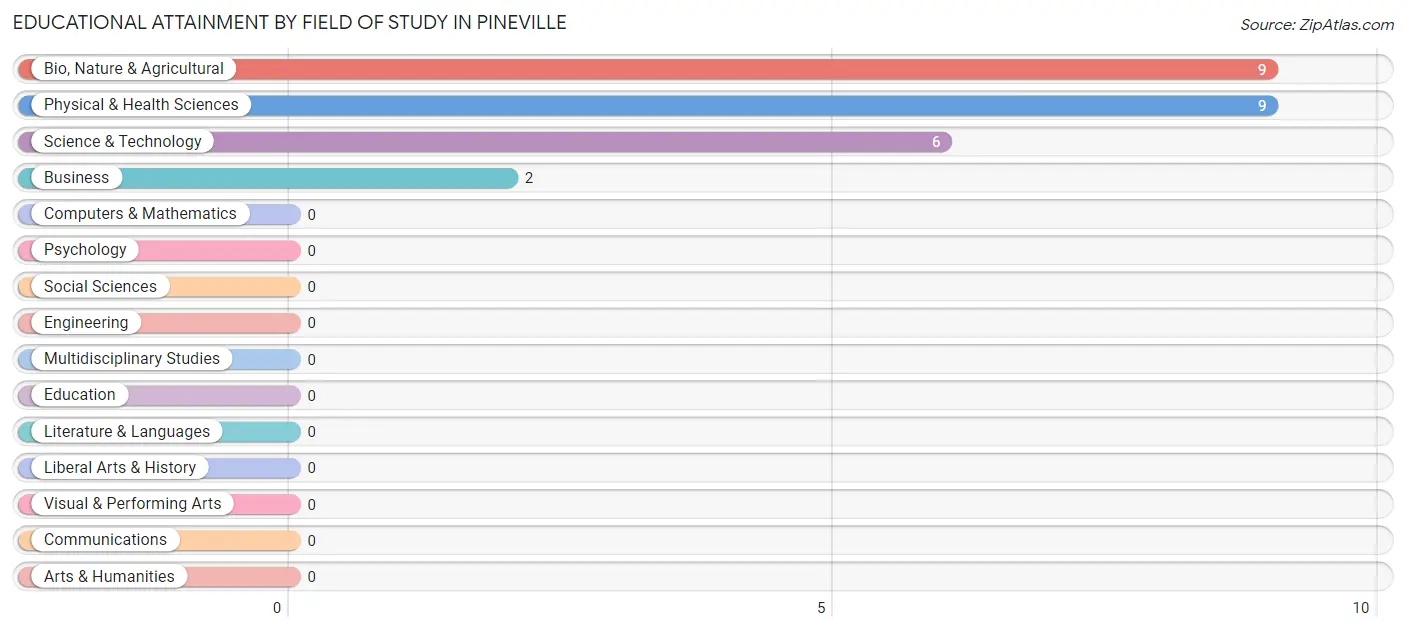
| Field of Study | # Graduates | % Graduates |
| Computers & Mathematics | 0 | 0.0% |
| Bio, Nature & Agricultural | 9 | 34.6% |
| Physical & Health Sciences | 9 | 34.6% |
| Psychology | 0 | 0.0% |
| Social Sciences | 0 | 0.0% |
| Engineering | 0 | 0.0% |
| Multidisciplinary Studies | 0 | 0.0% |
| Science & Technology | 6 | 23.1% |
| Business | 2 | 7.7% |
| Education | 0 | 0.0% |
| Literature & Languages | 0 | 0.0% |
| Liberal Arts & History | 0 | 0.0% |
| Visual & Performing Arts | 0 | 0.0% |
| Communications | 0 | 0.0% |
| Arts & Humanities | 0 | 0.0% |
| Total | 26 | 100.0% |
Transportation & Commute in Pineville
Vehicle Availability by Sex in Pineville
The most prevalent vehicle ownership categories in Pineville are males with 2 vehicles (10, accounting for 45.5%) and females with 2 vehicles (11, making up 50.0%).
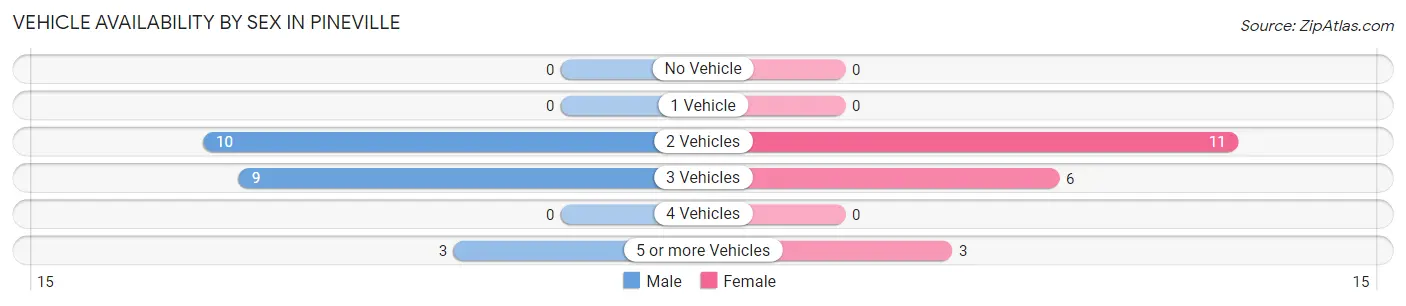
| Vehicles Available | Male | Female |
| No Vehicle | 0 (0.0%) | 0 (0.0%) |
| 1 Vehicle | 0 (0.0%) | 0 (0.0%) |
| 2 Vehicles | 10 (45.5%) | 11 (55.0%) |
| 3 Vehicles | 9 (40.9%) | 6 (30.0%) |
| 4 Vehicles | 0 (0.0%) | 0 (0.0%) |
| 5 or more Vehicles | 3 (13.6%) | 3 (15.0%) |
| Total | 22 (100.0%) | 20 (100.0%) |
Commute Time in Pineville
The most frequently occuring commute durations in Pineville are 5 to 9 minutes (22 commuters, 52.4%), 10 to 14 minutes (6 commuters, 14.3%), and less than 5 minutes (5 commuters, 11.9%).
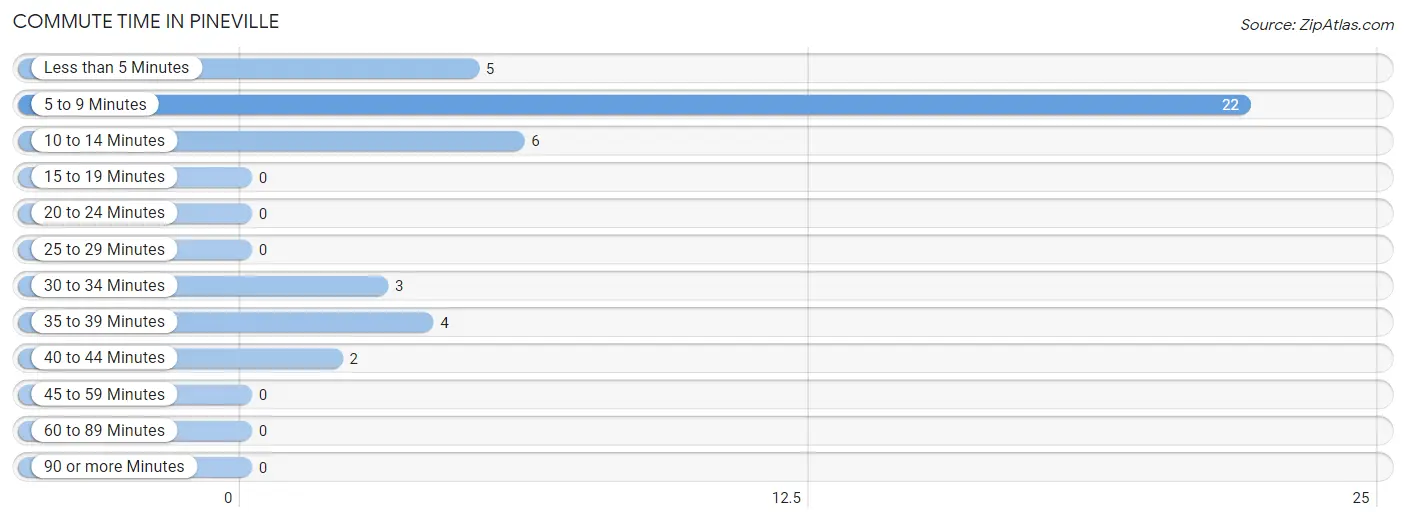
| Commute Time | # Commuters | % Commuters |
| Less than 5 Minutes | 5 | 11.9% |
| 5 to 9 Minutes | 22 | 52.4% |
| 10 to 14 Minutes | 6 | 14.3% |
| 15 to 19 Minutes | 0 | 0.0% |
| 20 to 24 Minutes | 0 | 0.0% |
| 25 to 29 Minutes | 0 | 0.0% |
| 30 to 34 Minutes | 3 | 7.1% |
| 35 to 39 Minutes | 4 | 9.5% |
| 40 to 44 Minutes | 2 | 4.8% |
| 45 to 59 Minutes | 0 | 0.0% |
| 60 to 89 Minutes | 0 | 0.0% |
| 90 or more Minutes | 0 | 0.0% |
Commute Time by Sex in Pineville
The most common commute times in Pineville are 5 to 9 minutes (11 commuters, 50.0%) for males and 5 to 9 minutes (11 commuters, 55.0%) for females.
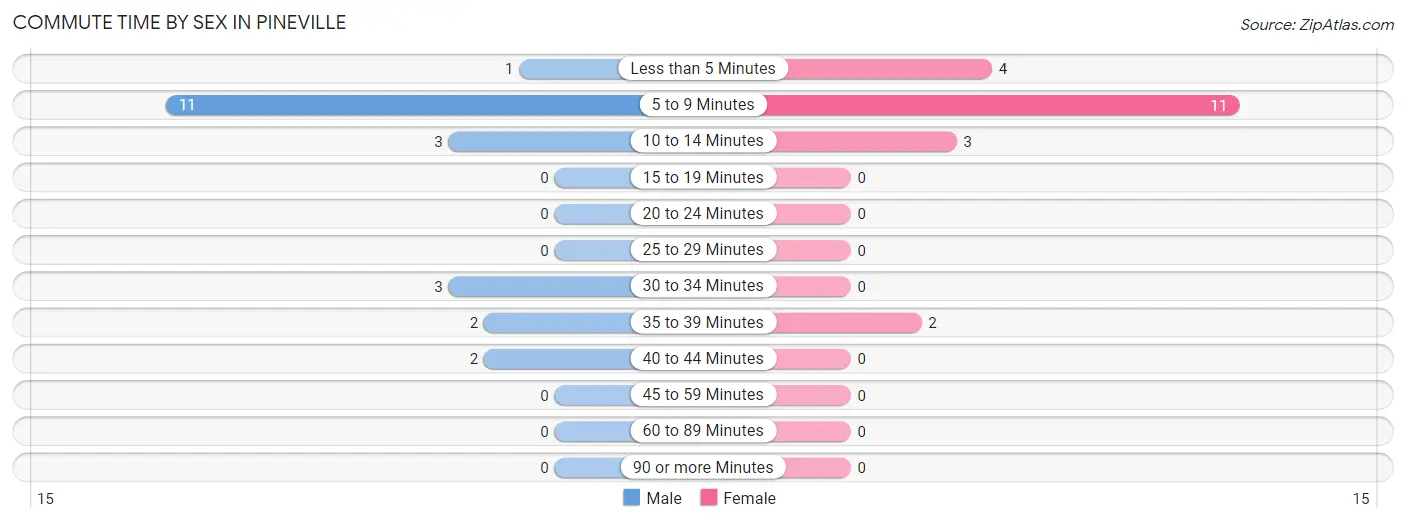
| Commute Time | Male | Female |
| Less than 5 Minutes | 1 (4.5%) | 4 (20.0%) |
| 5 to 9 Minutes | 11 (50.0%) | 11 (55.0%) |
| 10 to 14 Minutes | 3 (13.6%) | 3 (15.0%) |
| 15 to 19 Minutes | 0 (0.0%) | 0 (0.0%) |
| 20 to 24 Minutes | 0 (0.0%) | 0 (0.0%) |
| 25 to 29 Minutes | 0 (0.0%) | 0 (0.0%) |
| 30 to 34 Minutes | 3 (13.6%) | 0 (0.0%) |
| 35 to 39 Minutes | 2 (9.1%) | 2 (10.0%) |
| 40 to 44 Minutes | 2 (9.1%) | 0 (0.0%) |
| 45 to 59 Minutes | 0 (0.0%) | 0 (0.0%) |
| 60 to 89 Minutes | 0 (0.0%) | 0 (0.0%) |
| 90 or more Minutes | 0 (0.0%) | 0 (0.0%) |
Time of Departure to Work by Sex in Pineville
The most frequent times of departure to work in Pineville are 8:00 AM to 8:29 AM (10, 45.5%) for males and 8:00 AM to 8:29 AM (13, 65.0%) for females.
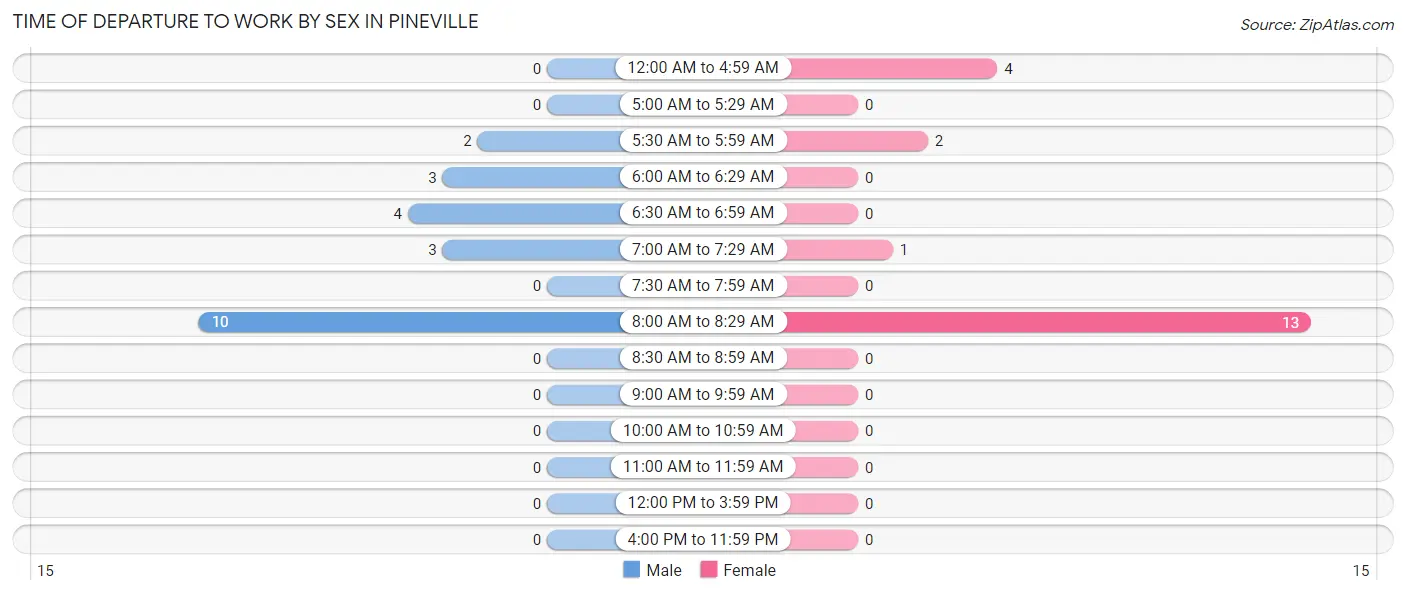
| Time of Departure | Male | Female |
| 12:00 AM to 4:59 AM | 0 (0.0%) | 4 (20.0%) |
| 5:00 AM to 5:29 AM | 0 (0.0%) | 0 (0.0%) |
| 5:30 AM to 5:59 AM | 2 (9.1%) | 2 (10.0%) |
| 6:00 AM to 6:29 AM | 3 (13.6%) | 0 (0.0%) |
| 6:30 AM to 6:59 AM | 4 (18.2%) | 0 (0.0%) |
| 7:00 AM to 7:29 AM | 3 (13.6%) | 1 (5.0%) |
| 7:30 AM to 7:59 AM | 0 (0.0%) | 0 (0.0%) |
| 8:00 AM to 8:29 AM | 10 (45.5%) | 13 (65.0%) |
| 8:30 AM to 8:59 AM | 0 (0.0%) | 0 (0.0%) |
| 9:00 AM to 9:59 AM | 0 (0.0%) | 0 (0.0%) |
| 10:00 AM to 10:59 AM | 0 (0.0%) | 0 (0.0%) |
| 11:00 AM to 11:59 AM | 0 (0.0%) | 0 (0.0%) |
| 12:00 PM to 3:59 PM | 0 (0.0%) | 0 (0.0%) |
| 4:00 PM to 11:59 PM | 0 (0.0%) | 0 (0.0%) |
| Total | 22 (100.0%) | 20 (100.0%) |
Housing Occupancy in Pineville
Occupancy by Ownership in Pineville
Of the total 67 dwellings in Pineville, owner-occupied units account for 59 (88.1%), while renter-occupied units make up 8 (11.9%).
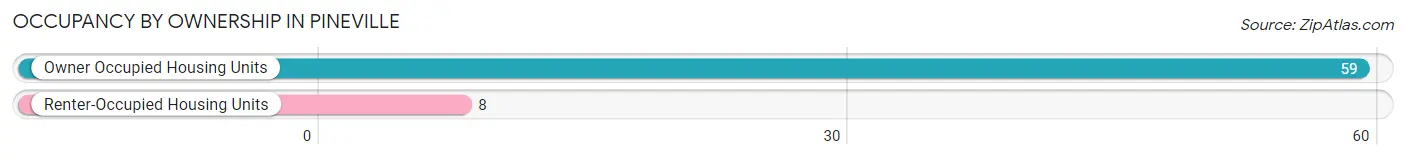
| Occupancy | # Housing Units | % Housing Units |
| Owner Occupied Housing Units | 59 | 88.1% |
| Renter-Occupied Housing Units | 8 | 11.9% |
| Total Occupied Housing Units | 67 | 100.0% |
Occupancy by Household Size in Pineville
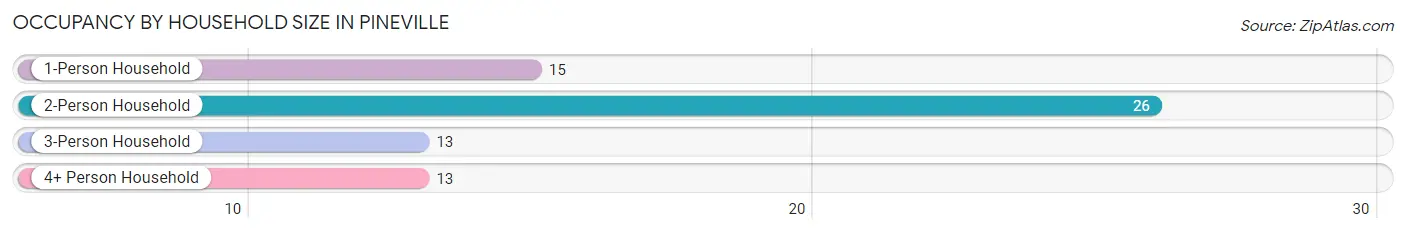
| Household Size | # Housing Units | % Housing Units |
| 1-Person Household | 15 | 22.4% |
| 2-Person Household | 26 | 38.8% |
| 3-Person Household | 13 | 19.4% |
| 4+ Person Household | 13 | 19.4% |
| Total Housing Units | 67 | 100.0% |
Occupancy by Ownership by Household Size in Pineville
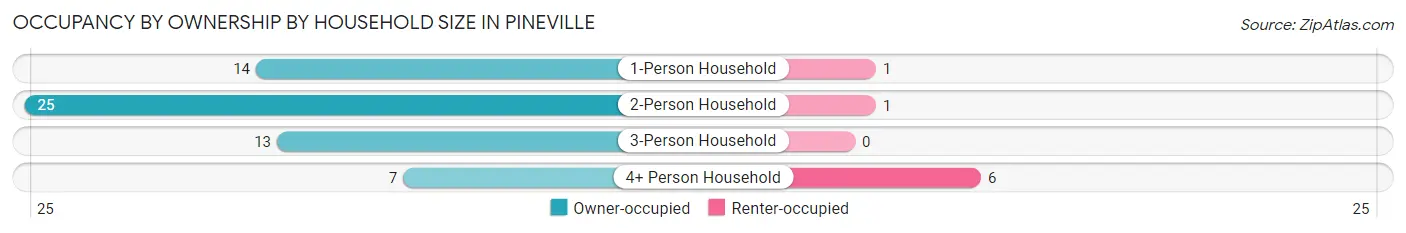
| Household Size | Owner-occupied | Renter-occupied |
| 1-Person Household | 14 (93.3%) | 1 (6.7%) |
| 2-Person Household | 25 (96.2%) | 1 (3.8%) |
| 3-Person Household | 13 (100.0%) | 0 (0.0%) |
| 4+ Person Household | 7 (53.8%) | 6 (46.2%) |
| Total Housing Units | 59 (88.1%) | 8 (11.9%) |
Occupancy by Educational Attainment in Pineville
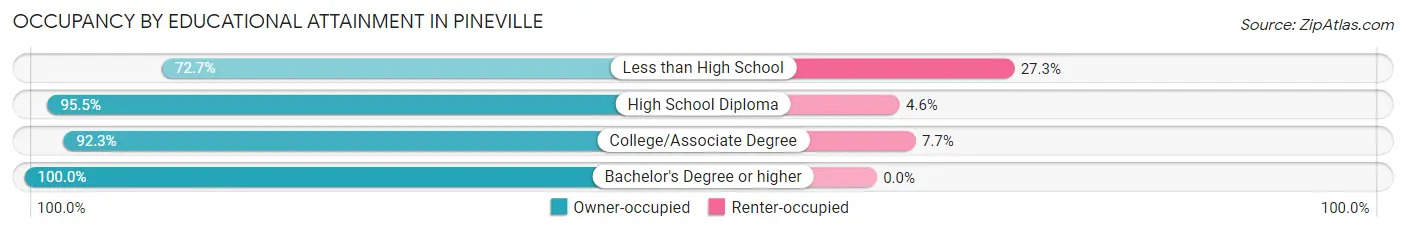
| Household Size | Owner-occupied | Renter-occupied |
| Less than High School | 16 (72.7%) | 6 (27.3%) |
| High School Diploma | 21 (95.5%) | 1 (4.5%) |
| College/Associate Degree | 12 (92.3%) | 1 (7.7%) |
| Bachelor's Degree or higher | 10 (100.0%) | 0 (0.0%) |
Occupancy by Age of Householder in Pineville
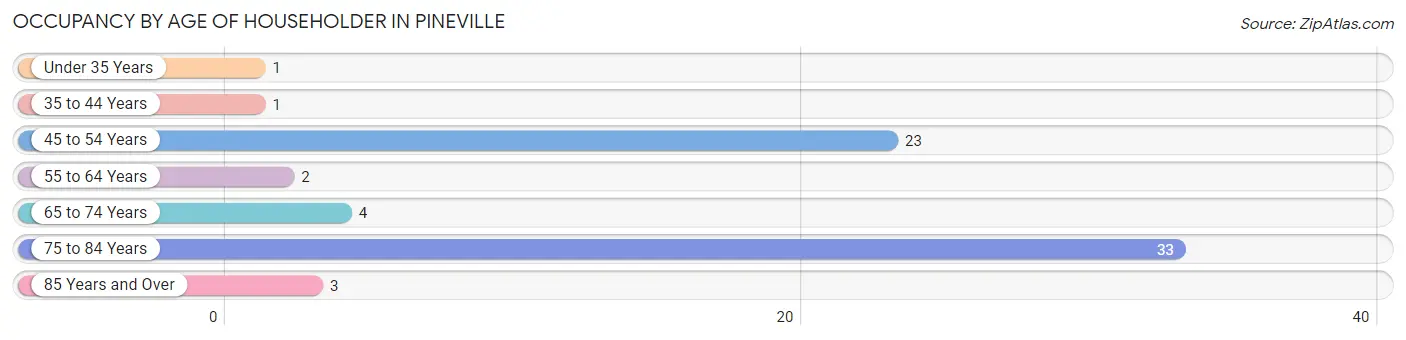
| Age Bracket | # Households | % Households |
| Under 35 Years | 1 | 1.5% |
| 35 to 44 Years | 1 | 1.5% |
| 45 to 54 Years | 23 | 34.3% |
| 55 to 64 Years | 2 | 3.0% |
| 65 to 74 Years | 4 | 6.0% |
| 75 to 84 Years | 33 | 49.2% |
| 85 Years and Over | 3 | 4.5% |
| Total | 67 | 100.0% |
Housing Finances in Pineville
Median Income by Occupancy in Pineville
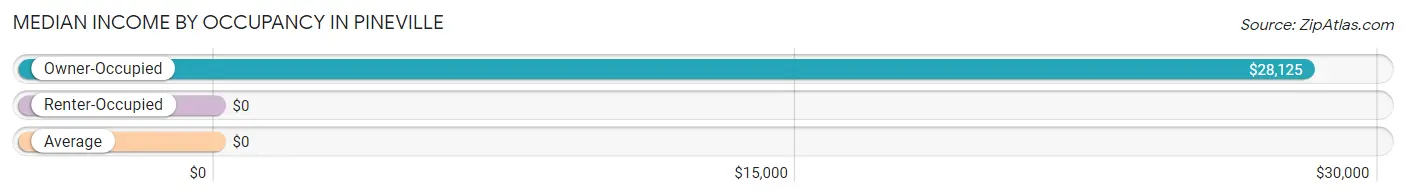
| Occupancy Type | # Households | Median Income |
| Owner-Occupied | 59 (88.1%) | $28,125 |
| Renter-Occupied | 8 (11.9%) | $0 |
| Average | 67 (100.0%) | $0 |
Occupancy by Householder Income Bracket in Pineville
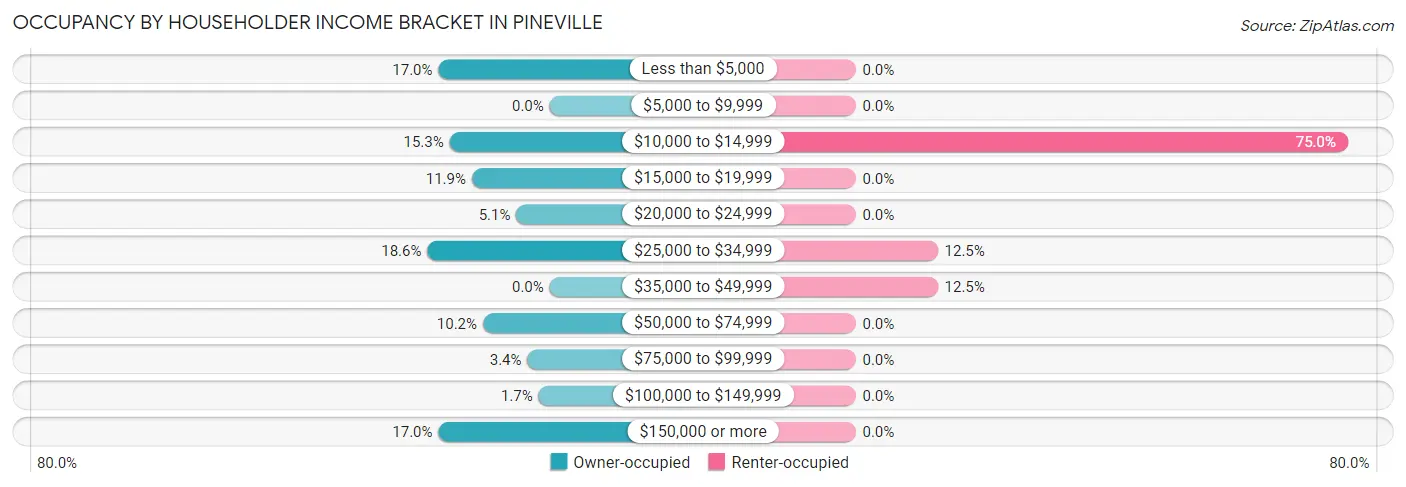
| Income Bracket | Owner-occupied | Renter-occupied |
| Less than $5,000 | 10 (17.0%) | 0 (0.0%) |
| $5,000 to $9,999 | 0 (0.0%) | 0 (0.0%) |
| $10,000 to $14,999 | 9 (15.2%) | 6 (75.0%) |
| $15,000 to $19,999 | 7 (11.9%) | 0 (0.0%) |
| $20,000 to $24,999 | 3 (5.1%) | 0 (0.0%) |
| $25,000 to $34,999 | 11 (18.6%) | 1 (12.5%) |
| $35,000 to $49,999 | 0 (0.0%) | 1 (12.5%) |
| $50,000 to $74,999 | 6 (10.2%) | 0 (0.0%) |
| $75,000 to $99,999 | 2 (3.4%) | 0 (0.0%) |
| $100,000 to $149,999 | 1 (1.7%) | 0 (0.0%) |
| $150,000 or more | 10 (17.0%) | 0 (0.0%) |
| Total | 59 (100.0%) | 8 (100.0%) |
Monthly Housing Cost Tiers in Pineville
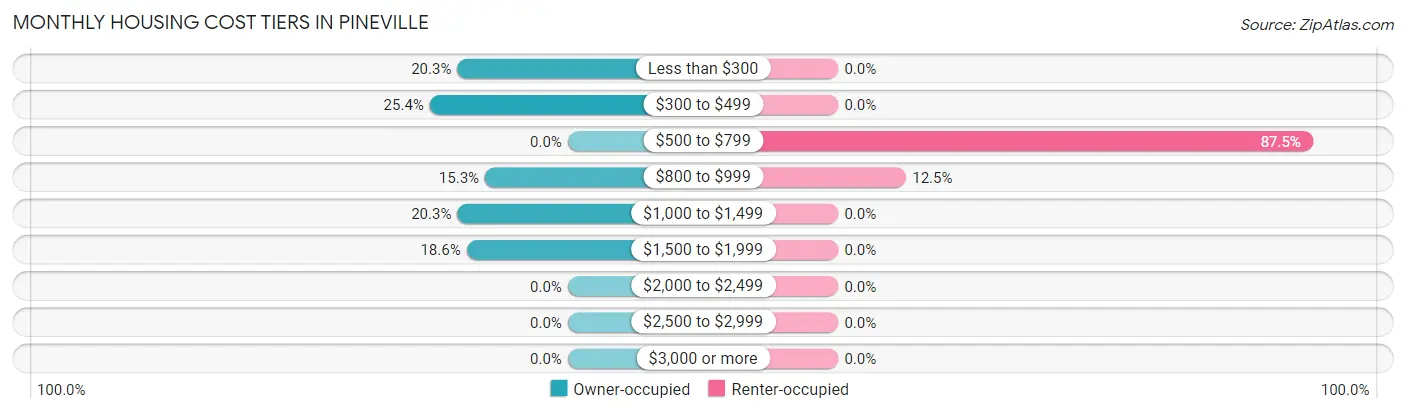
| Monthly Cost | Owner-occupied | Renter-occupied |
| Less than $300 | 12 (20.3%) | 0 (0.0%) |
| $300 to $499 | 15 (25.4%) | 0 (0.0%) |
| $500 to $799 | 0 (0.0%) | 7 (87.5%) |
| $800 to $999 | 9 (15.2%) | 1 (12.5%) |
| $1,000 to $1,499 | 12 (20.3%) | 0 (0.0%) |
| $1,500 to $1,999 | 11 (18.6%) | 0 (0.0%) |
| $2,000 to $2,499 | 0 (0.0%) | 0 (0.0%) |
| $2,500 to $2,999 | 0 (0.0%) | 0 (0.0%) |
| $3,000 or more | 0 (0.0%) | 0 (0.0%) |
| Total | 59 (100.0%) | 8 (100.0%) |
Physical Housing Characteristics in Pineville
Housing Structures in Pineville
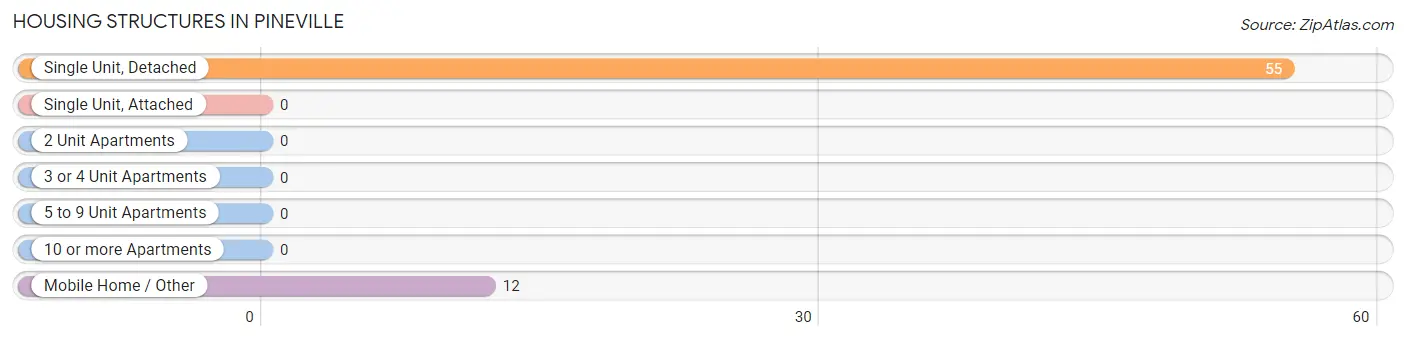
| Structure Type | # Housing Units | % Housing Units |
| Single Unit, Detached | 55 | 82.1% |
| Single Unit, Attached | 0 | 0.0% |
| 2 Unit Apartments | 0 | 0.0% |
| 3 or 4 Unit Apartments | 0 | 0.0% |
| 5 to 9 Unit Apartments | 0 | 0.0% |
| 10 or more Apartments | 0 | 0.0% |
| Mobile Home / Other | 12 | 17.9% |
| Total | 67 | 100.0% |
Housing Structures by Occupancy in Pineville
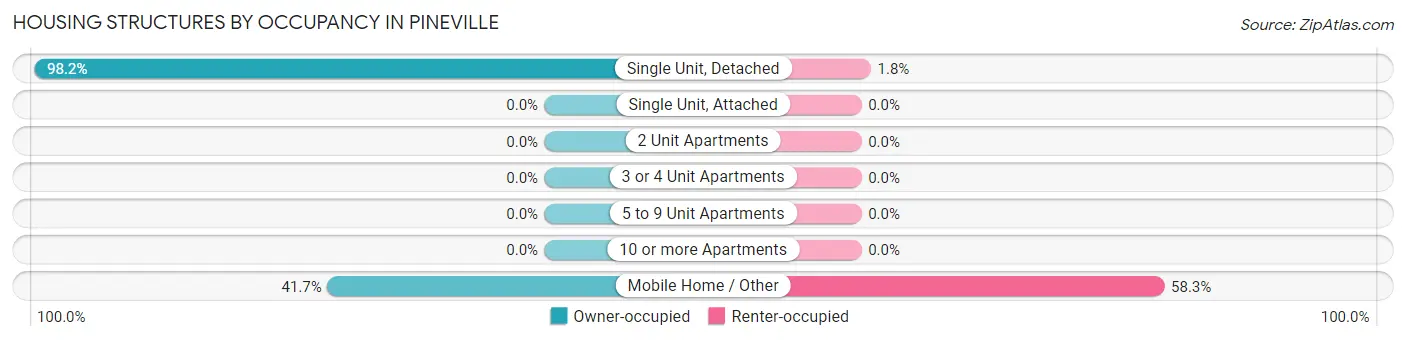
| Structure Type | Owner-occupied | Renter-occupied |
| Single Unit, Detached | 54 (98.2%) | 1 (1.8%) |
| Single Unit, Attached | 0 (0.0%) | 0 (0.0%) |
| 2 Unit Apartments | 0 (0.0%) | 0 (0.0%) |
| 3 or 4 Unit Apartments | 0 (0.0%) | 0 (0.0%) |
| 5 to 9 Unit Apartments | 0 (0.0%) | 0 (0.0%) |
| 10 or more Apartments | 0 (0.0%) | 0 (0.0%) |
| Mobile Home / Other | 5 (41.7%) | 7 (58.3%) |
| Total | 59 (88.1%) | 8 (11.9%) |
Housing Structures by Number of Rooms in Pineville
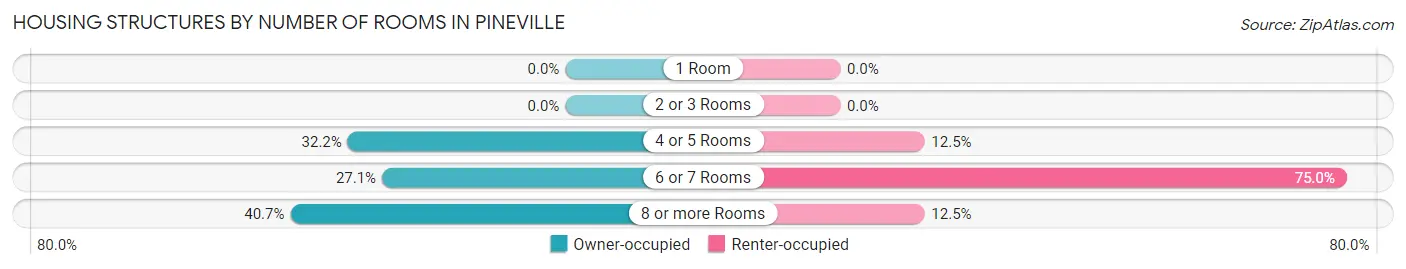
| Number of Rooms | Owner-occupied | Renter-occupied |
| 1 Room | 0 (0.0%) | 0 (0.0%) |
| 2 or 3 Rooms | 0 (0.0%) | 0 (0.0%) |
| 4 or 5 Rooms | 19 (32.2%) | 1 (12.5%) |
| 6 or 7 Rooms | 16 (27.1%) | 6 (75.0%) |
| 8 or more Rooms | 24 (40.7%) | 1 (12.5%) |
| Total | 59 (100.0%) | 8 (100.0%) |
Housing Structure by Heating Type in Pineville
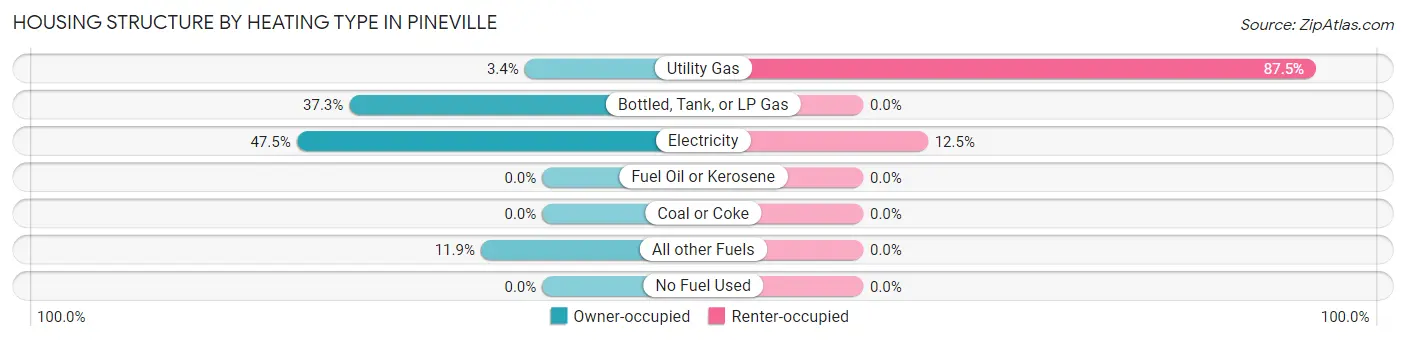
| Heating Type | Owner-occupied | Renter-occupied |
| Utility Gas | 2 (3.4%) | 7 (87.5%) |
| Bottled, Tank, or LP Gas | 22 (37.3%) | 0 (0.0%) |
| Electricity | 28 (47.5%) | 1 (12.5%) |
| Fuel Oil or Kerosene | 0 (0.0%) | 0 (0.0%) |
| Coal or Coke | 0 (0.0%) | 0 (0.0%) |
| All other Fuels | 7 (11.9%) | 0 (0.0%) |
| No Fuel Used | 0 (0.0%) | 0 (0.0%) |
| Total | 59 (100.0%) | 8 (100.0%) |
Household Vehicle Usage in Pineville
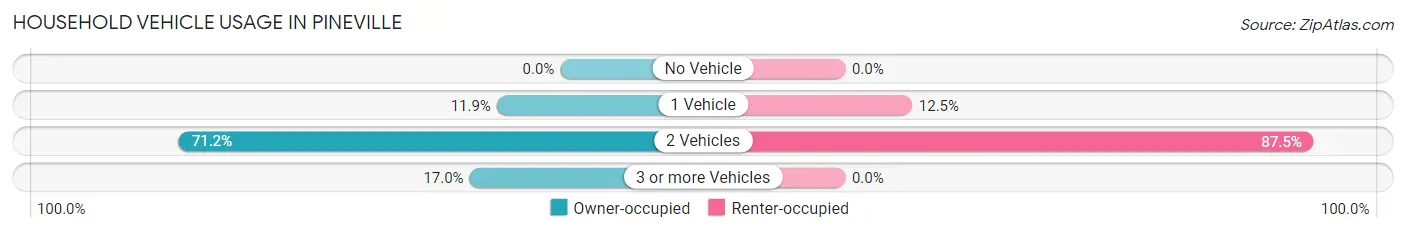
| Vehicles per Household | Owner-occupied | Renter-occupied |
| No Vehicle | 0 (0.0%) | 0 (0.0%) |
| 1 Vehicle | 7 (11.9%) | 1 (12.5%) |
| 2 Vehicles | 42 (71.2%) | 7 (87.5%) |
| 3 or more Vehicles | 10 (17.0%) | 0 (0.0%) |
| Total | 59 (100.0%) | 8 (100.0%) |
Real Estate & Mortgages in Pineville
Real Estate and Mortgage Overview in Pineville
| Characteristic | Without Mortgage | With Mortgage |
| Housing Units | 30 | 29 |
| Median Property Value | - | - |
| Median Household Income | - | - |
| Monthly Housing Costs | $338 | $0 |
| Real Estate Taxes | - | - |
Property Value by Mortgage Status in Pineville
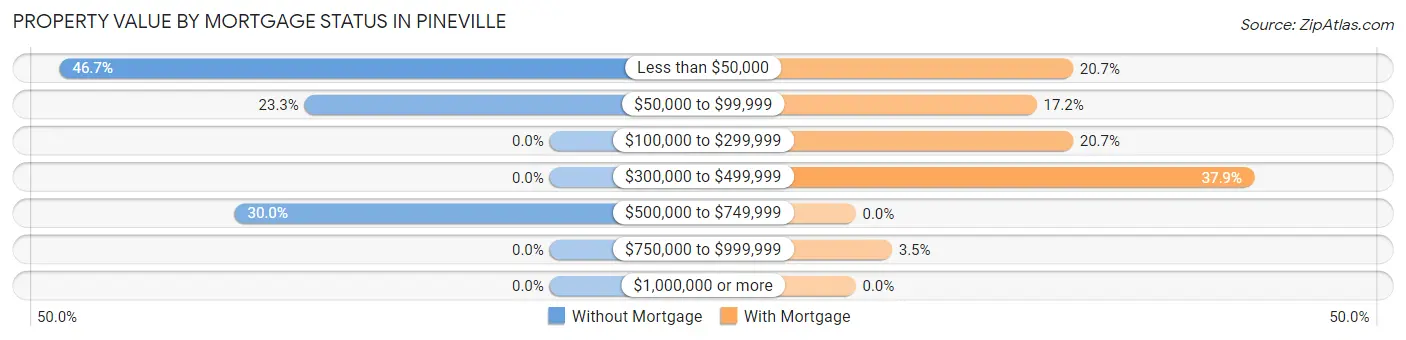
| Property Value | Without Mortgage | With Mortgage |
| Less than $50,000 | 14 (46.7%) | 6 (20.7%) |
| $50,000 to $99,999 | 7 (23.3%) | 5 (17.2%) |
| $100,000 to $299,999 | 0 (0.0%) | 6 (20.7%) |
| $300,000 to $499,999 | 0 (0.0%) | 11 (37.9%) |
| $500,000 to $749,999 | 9 (30.0%) | 0 (0.0%) |
| $750,000 to $999,999 | 0 (0.0%) | 1 (3.5%) |
| $1,000,000 or more | 0 (0.0%) | 0 (0.0%) |
| Total | 30 (100.0%) | 29 (100.0%) |
Household Income by Mortgage Status in Pineville
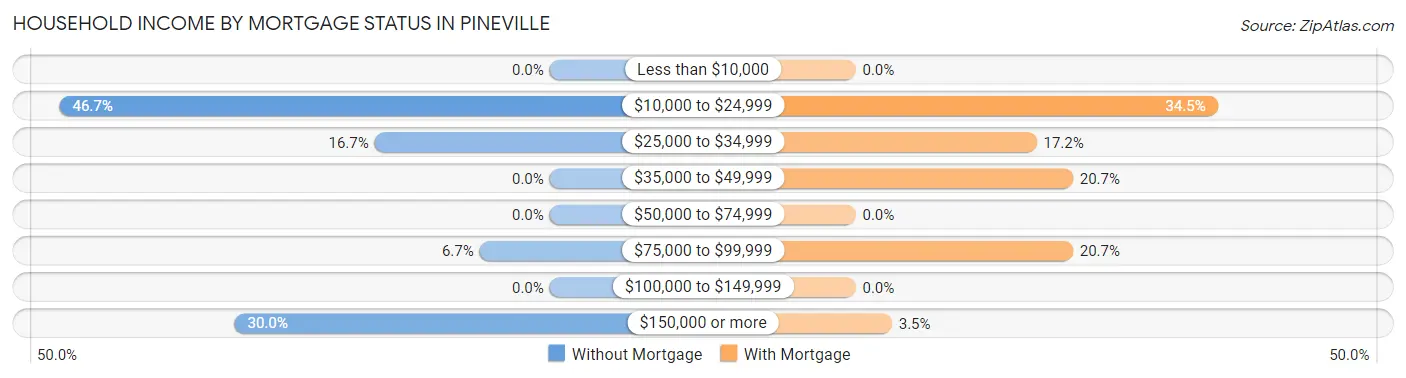
| Household Income | Without Mortgage | With Mortgage |
| Less than $10,000 | 0 (0.0%) | 0 (0.0%) |
| $10,000 to $24,999 | 14 (46.7%) | 10 (34.5%) |
| $25,000 to $34,999 | 5 (16.7%) | 5 (17.2%) |
| $35,000 to $49,999 | 0 (0.0%) | 6 (20.7%) |
| $50,000 to $74,999 | 0 (0.0%) | 0 (0.0%) |
| $75,000 to $99,999 | 2 (6.7%) | 6 (20.7%) |
| $100,000 to $149,999 | 0 (0.0%) | 0 (0.0%) |
| $150,000 or more | 9 (30.0%) | 1 (3.5%) |
| Total | 30 (100.0%) | 29 (100.0%) |
Property Value to Household Income Ratio in Pineville
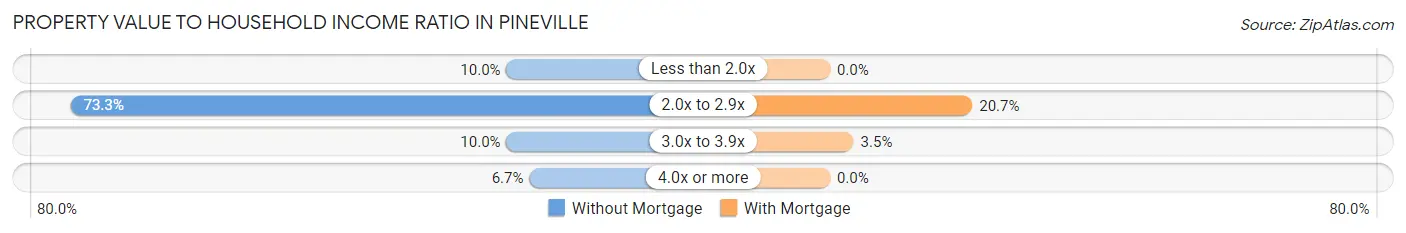
| Value-to-Income Ratio | Without Mortgage | With Mortgage |
| Less than 2.0x | 3 (10.0%) | 0 (0.0%) |
| 2.0x to 2.9x | 22 (73.3%) | 6 (20.7%) |
| 3.0x to 3.9x | 3 (10.0%) | 1 (3.5%) |
| 4.0x or more | 2 (6.7%) | 0 (0.0%) |
| Total | 30 (100.0%) | 29 (100.0%) |
Real Estate Taxes by Mortgage Status in Pineville
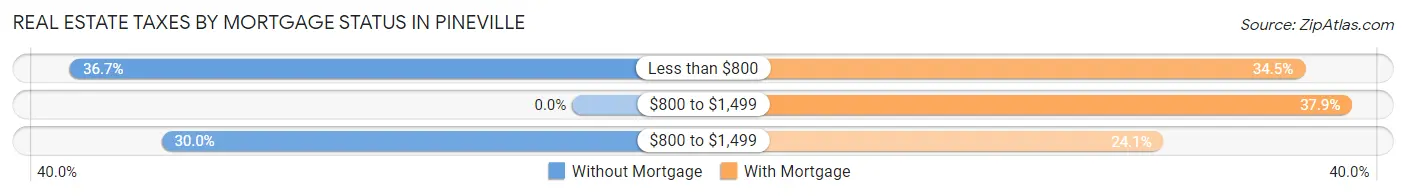
| Property Taxes | Without Mortgage | With Mortgage |
| Less than $800 | 11 (36.7%) | 10 (34.5%) |
| $800 to $1,499 | 0 (0.0%) | 11 (37.9%) |
| $800 to $1,499 | 9 (30.0%) | 7 (24.1%) |
| Total | 30 (100.0%) | 29 (100.0%) |
Health & Disability in Pineville
Health Insurance Coverage by Age in Pineville
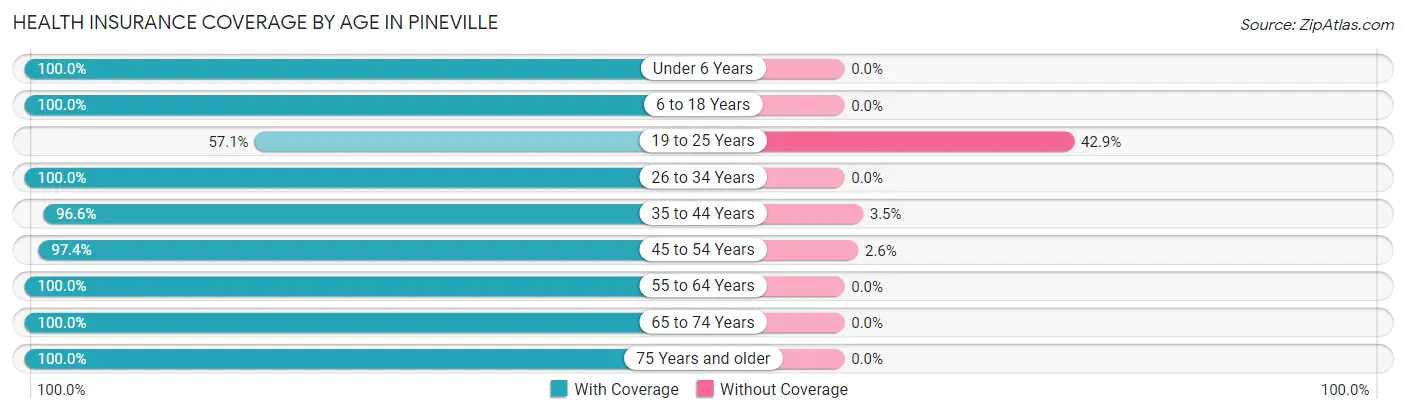
| Age Bracket | With Coverage | Without Coverage |
| Under 6 Years | 7 (100.0%) | 0 (0.0%) |
| 6 to 18 Years | 16 (100.0%) | 0 (0.0%) |
| 19 to 25 Years | 4 (57.1%) | 3 (42.9%) |
| 26 to 34 Years | 2 (100.0%) | 0 (0.0%) |
| 35 to 44 Years | 28 (96.6%) | 1 (3.5%) |
| 45 to 54 Years | 38 (97.4%) | 1 (2.6%) |
| 55 to 64 Years | 2 (100.0%) | 0 (0.0%) |
| 65 to 74 Years | 8 (100.0%) | 0 (0.0%) |
| 75 Years and older | 60 (100.0%) | 0 (0.0%) |
| Total | 165 (97.1%) | 5 (2.9%) |
Health Insurance Coverage by Citizenship Status in Pineville

| Citizenship Status | With Coverage | Without Coverage |
| Native Born | 7 (100.0%) | 0 (0.0%) |
| Foreign Born, Citizen | 16 (100.0%) | 0 (0.0%) |
| Foreign Born, not a Citizen | 4 (57.1%) | 3 (42.9%) |
Health Insurance Coverage by Household Income in Pineville
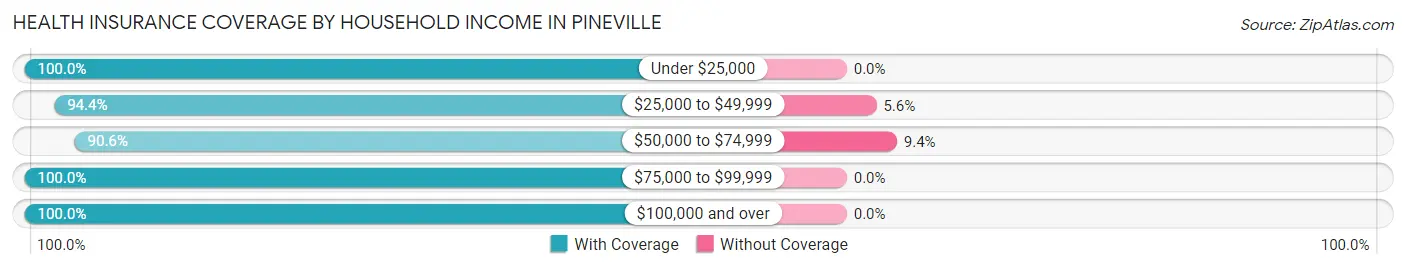
| Household Income | With Coverage | Without Coverage |
| Under $25,000 | 67 (100.0%) | 0 (0.0%) |
| $25,000 to $49,999 | 34 (94.4%) | 2 (5.6%) |
| $50,000 to $74,999 | 29 (90.6%) | 3 (9.4%) |
| $75,000 to $99,999 | 4 (100.0%) | 0 (0.0%) |
| $100,000 and over | 31 (100.0%) | 0 (0.0%) |
Public vs Private Health Insurance Coverage by Age in Pineville
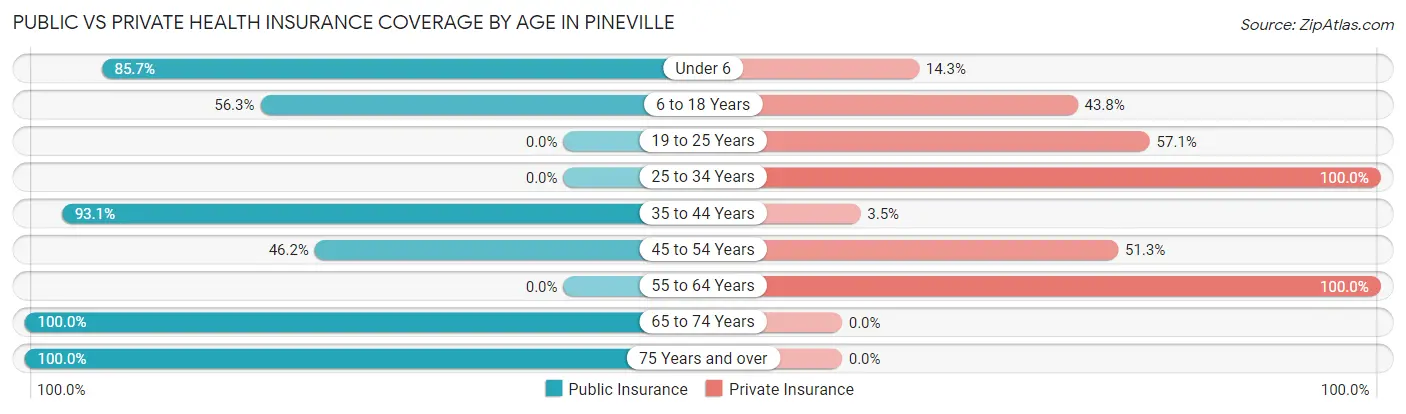
| Age Bracket | Public Insurance | Private Insurance |
| Under 6 | 6 (85.7%) | 1 (14.3%) |
| 6 to 18 Years | 9 (56.2%) | 7 (43.8%) |
| 19 to 25 Years | 0 (0.0%) | 4 (57.1%) |
| 25 to 34 Years | 0 (0.0%) | 2 (100.0%) |
| 35 to 44 Years | 27 (93.1%) | 1 (3.5%) |
| 45 to 54 Years | 18 (46.2%) | 20 (51.3%) |
| 55 to 64 Years | 0 (0.0%) | 2 (100.0%) |
| 65 to 74 Years | 8 (100.0%) | 0 (0.0%) |
| 75 Years and over | 60 (100.0%) | 0 (0.0%) |
| Total | 128 (75.3%) | 37 (21.8%) |
Disability Status by Sex by Age in Pineville
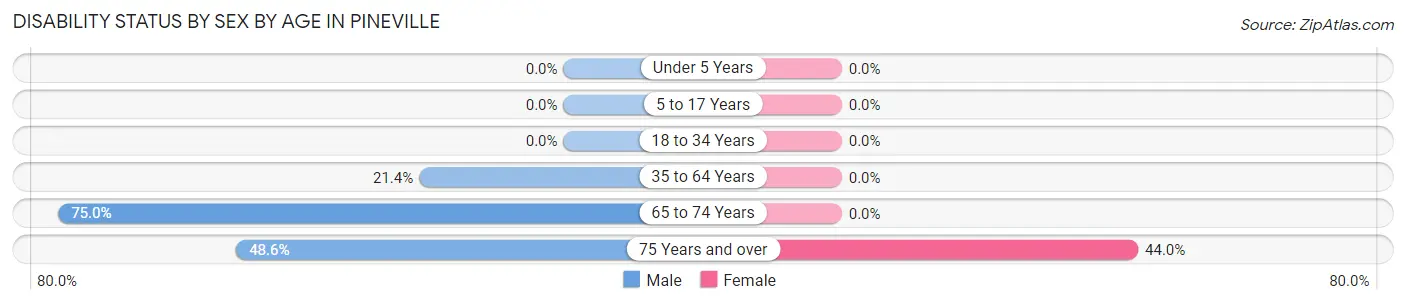
| Age Bracket | Male | Female |
| Under 5 Years | 0 (0.0%) | 0 (0.0%) |
| 5 to 17 Years | 0 (0.0%) | 0 (0.0%) |
| 18 to 34 Years | 0 (0.0%) | 0 (0.0%) |
| 35 to 64 Years | 6 (21.4%) | 0 (0.0%) |
| 65 to 74 Years | 3 (75.0%) | 0 (0.0%) |
| 75 Years and over | 17 (48.6%) | 11 (44.0%) |
Disability Class by Sex by Age in Pineville
Disability Class: Hearing Difficulty
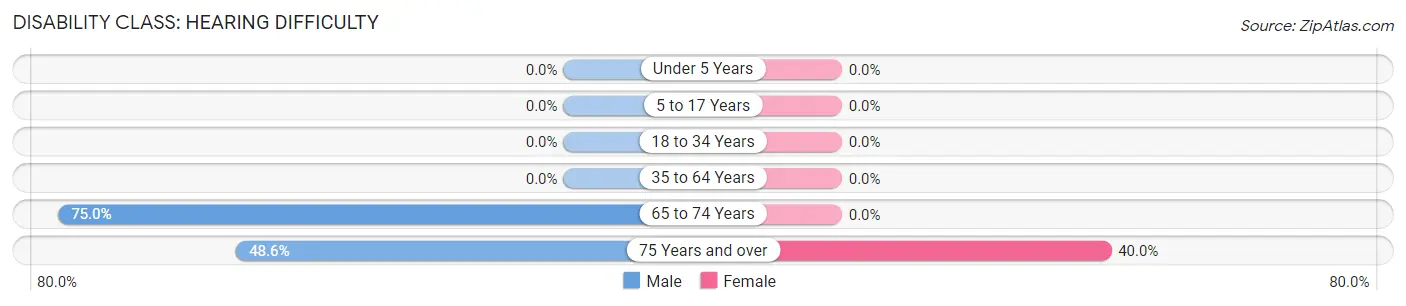
| Age Bracket | Male | Female |
| Under 5 Years | 0 (0.0%) | 0 (0.0%) |
| 5 to 17 Years | 0 (0.0%) | 0 (0.0%) |
| 18 to 34 Years | 0 (0.0%) | 0 (0.0%) |
| 35 to 64 Years | 0 (0.0%) | 0 (0.0%) |
| 65 to 74 Years | 3 (75.0%) | 0 (0.0%) |
| 75 Years and over | 17 (48.6%) | 10 (40.0%) |
Disability Class: Vision Difficulty
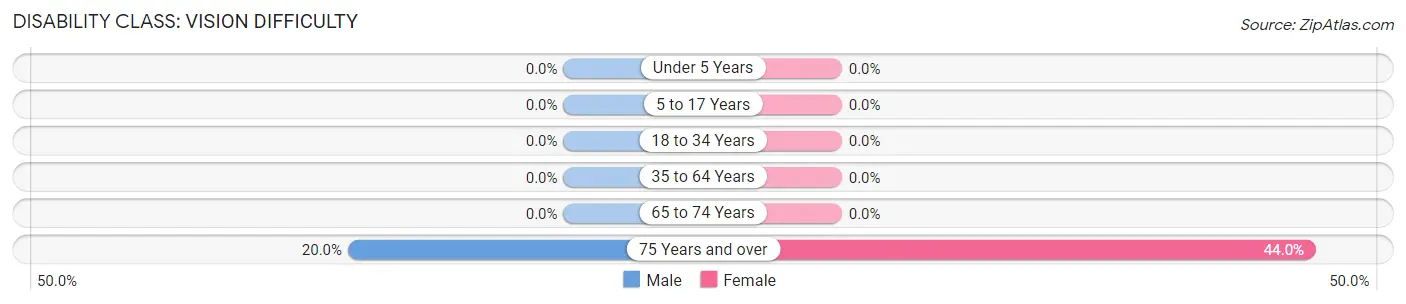
| Age Bracket | Male | Female |
| Under 5 Years | 0 (0.0%) | 0 (0.0%) |
| 5 to 17 Years | 0 (0.0%) | 0 (0.0%) |
| 18 to 34 Years | 0 (0.0%) | 0 (0.0%) |
| 35 to 64 Years | 0 (0.0%) | 0 (0.0%) |
| 65 to 74 Years | 0 (0.0%) | 0 (0.0%) |
| 75 Years and over | 7 (20.0%) | 11 (44.0%) |
Disability Class: Cognitive Difficulty
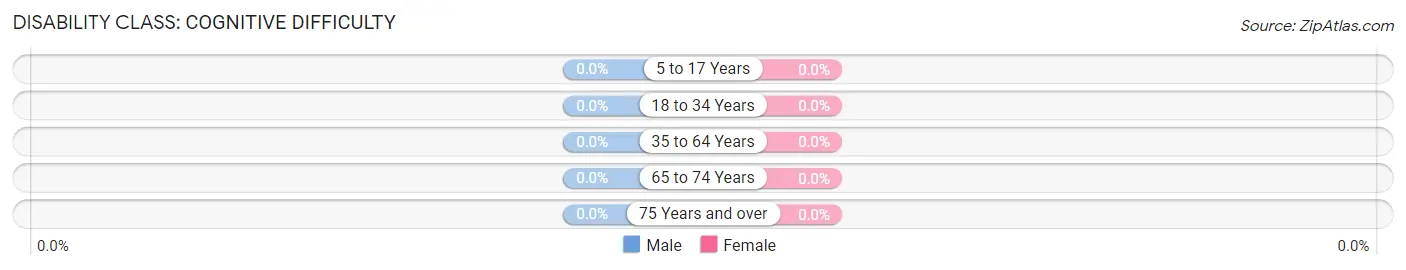
| Age Bracket | Male | Female |
| 5 to 17 Years | 0 (0.0%) | 0 (0.0%) |
| 18 to 34 Years | 0 (0.0%) | 0 (0.0%) |
| 35 to 64 Years | 0 (0.0%) | 0 (0.0%) |
| 65 to 74 Years | 0 (0.0%) | 0 (0.0%) |
| 75 Years and over | 0 (0.0%) | 0 (0.0%) |
Disability Class: Ambulatory Difficulty
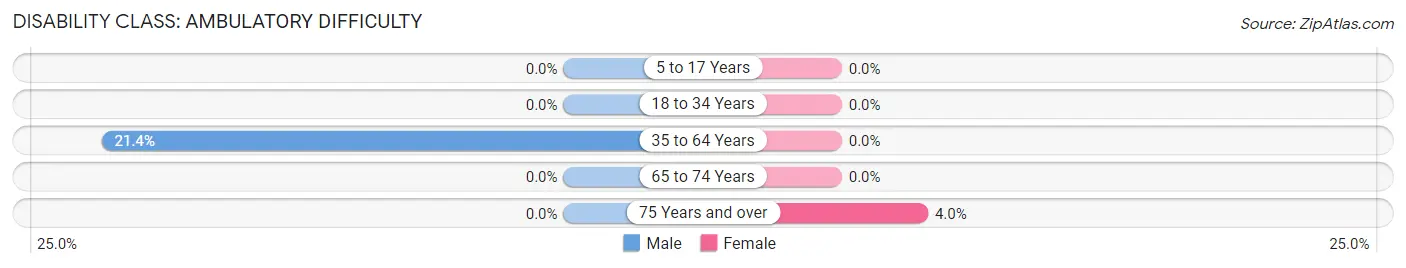
| Age Bracket | Male | Female |
| 5 to 17 Years | 0 (0.0%) | 0 (0.0%) |
| 18 to 34 Years | 0 (0.0%) | 0 (0.0%) |
| 35 to 64 Years | 6 (21.4%) | 0 (0.0%) |
| 65 to 74 Years | 0 (0.0%) | 0 (0.0%) |
| 75 Years and over | 0 (0.0%) | 1 (4.0%) |
Disability Class: Self-Care Difficulty
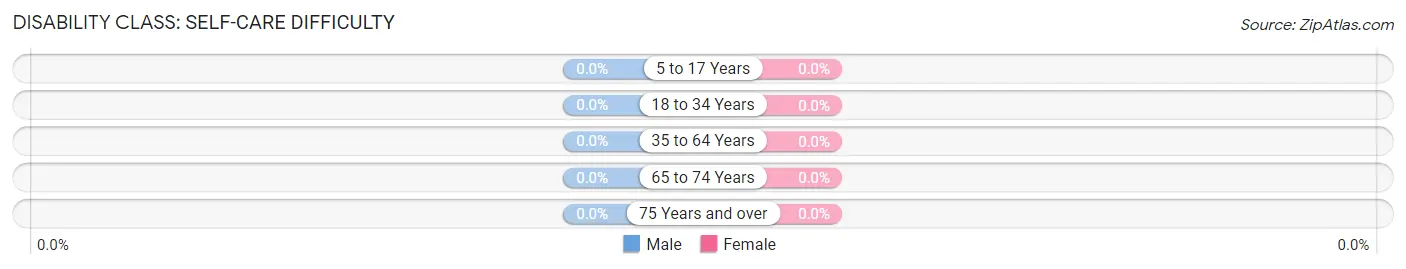
| Age Bracket | Male | Female |
| 5 to 17 Years | 0 (0.0%) | 0 (0.0%) |
| 18 to 34 Years | 0 (0.0%) | 0 (0.0%) |
| 35 to 64 Years | 0 (0.0%) | 0 (0.0%) |
| 65 to 74 Years | 0 (0.0%) | 0 (0.0%) |
| 75 Years and over | 0 (0.0%) | 0 (0.0%) |
Technology Access in Pineville
Computing Device Access in Pineville
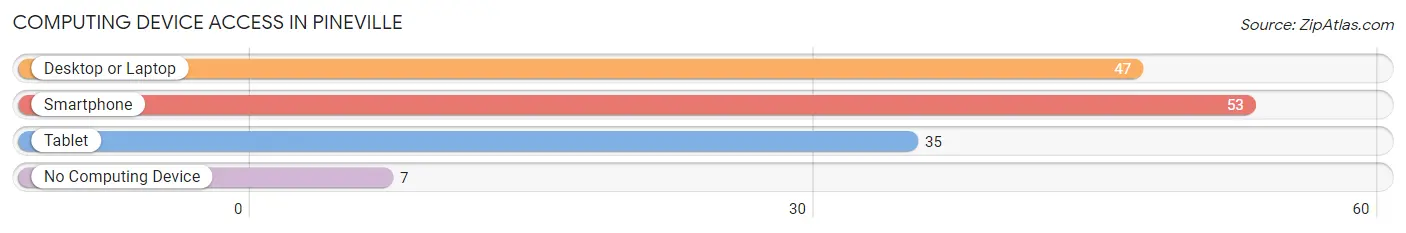
| Device Type | # Households | % Households |
| Desktop or Laptop | 47 | 70.2% |
| Smartphone | 53 | 79.1% |
| Tablet | 35 | 52.2% |
| No Computing Device | 7 | 10.4% |
| Total | 67 | 100.0% |
Internet Access in Pineville
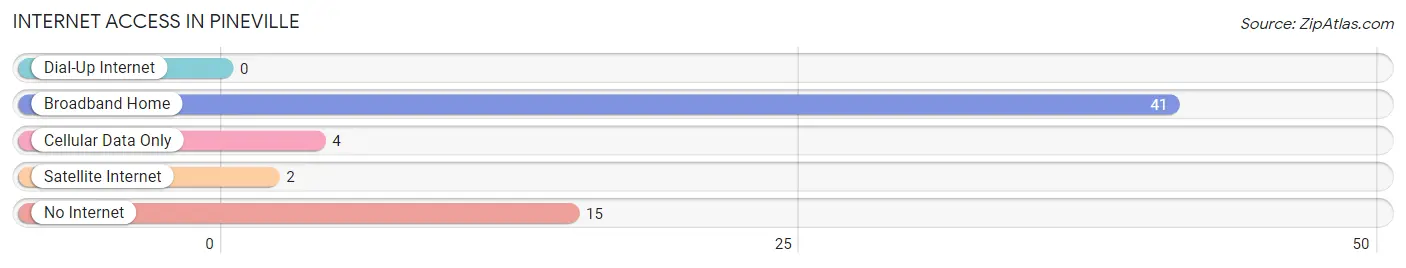
| Internet Type | # Households | % Households |
| Dial-Up Internet | 0 | 0.0% |
| Broadband Home | 41 | 61.2% |
| Cellular Data Only | 4 | 6.0% |
| Satellite Internet | 2 | 3.0% |
| No Internet | 15 | 22.4% |
| Total | 67 | 100.0% |
Pineville Summary
Pineville, Arkansas is a small town located in the Ozark Mountains of northern Arkansas. It is situated in the foothills of the Ozarks, about 25 miles south of Fayetteville and about 40 miles north of Little Rock. The town has a population of approximately 1,000 people and is the county seat of Newton County.
History
Pineville was founded in 1845 by a group of settlers from Tennessee. The town was named after the abundance of pine trees in the area. The first post office was established in 1848 and the town was incorporated in 1851.
In the late 19th century, Pineville was a thriving agricultural community. The town was home to several cotton gins, a sawmill, and a gristmill. The town also had a hotel, a bank, and several stores.
In the early 20th century, the timber industry began to decline and the town’s economy shifted to tourism. The town was a popular destination for hunters and fishermen, and several resorts were built in the area.
Geography
Pineville is located in the Ozark Mountains of northern Arkansas. The town is situated in the foothills of the Ozarks, about 25 miles south of Fayetteville and about 40 miles north of Little Rock. The town is surrounded by the Ozark National Forest and is located near the Buffalo National River.
The town has a total area of 1.2 square miles, all of which is land. The town is located at an elevation of 1,000 feet above sea level.
Economy
The economy of Pineville is largely based on tourism. The town is a popular destination for hunters and fishermen, and several resorts are located in the area. The town is also home to several small businesses, including restaurants, shops, and a grocery store.
The town is also home to a small manufacturing industry. The town is home to several small factories that produce furniture, clothing, and other goods.
Demographics
As of the 2010 census, the population of Pineville was 1,000. The town has a population density of 833 people per square mile. The median age of the population is 44.7 years.
The racial makeup of the town is 97.2% White, 0.7% African American, 0.3% Native American, 0.3% Asian, 0.1% Pacific Islander, 0.3% from other races, and 1.2% from two or more races.
The median household income in Pineville is $30,000. The per capita income is $17,000. The town has a poverty rate of 22.3%.
Conclusion
Pineville, Arkansas is a small town located in the Ozark Mountains of northern Arkansas. The town has a population of approximately 1,000 people and is the county seat of Newton County. The town’s economy is largely based on tourism and small businesses. The town has a median household income of $30,000 and a poverty rate of 22.3%.
Common Questions
What is the Total Population of Pineville?
Total Population of Pineville is 172.
What is the Total Male Population of Pineville?
Total Male Population of Pineville is 85.
What is the Total Female Population of Pineville?
Total Female Population of Pineville is 87.
What is the Ratio of Males per 100 Females in Pineville?
There are 97.70 Males per 100 Females in Pineville.
What is the Ratio of Females per 100 Males in Pineville?
There are 102.35 Females per 100 Males in Pineville.
What is the Median Population Age in Pineville?
Median Population Age in Pineville is 50.5 Years.
What is the Average Family Size in Pineville
Average Family Size in Pineville is 3.0 People.
What is the Average Household Size in Pineville
Average Household Size in Pineville is 2.6 People.
What is Per Capita Income in Pineville?
Per Capita income in Pineville is $18,974.
What is Family Income Deficit in Pineville?
Family Income Deficit in Pineville is $17,733.
Families that are below poverty line in Pineville earn $17,733 less on average than the poverty threshold level.
What is Inequality or Gini Index in Pineville?
Inequality or Gini Index in Pineville is 0.61.
How Large is the Labor Force in Pineville?
There are 63 People in the Labor Forcein in Pineville.
What is the Percentage of People in the Labor Force in Pineville?
42.3% of People are in the Labor Force in Pineville.
What is the Unemployment Rate in Pineville?
Unemployment Rate in Pineville is 34.4%.