Bald Knob, AR Map & Demographics
Bald Knob Map
Bald Knob Overview
$23,651
PER CAPITA INCOME
$52,578
AVG FAMILY INCOME
$47,917
AVG HOUSEHOLD INCOME
5.4%
WAGE / INCOME GAP [ % ]
94.6¢/ $1
WAGE / INCOME GAP [ $ ]
0.42
INEQUALITY / GINI INDEX
2,548
TOTAL POPULATION
1,369
MALE POPULATION
1,179
FEMALE POPULATION
116.12
MALES / 100 FEMALES
86.12
FEMALES / 100 MALES
33.5
MEDIAN AGE
3.6
AVG FAMILY SIZE
2.8
AVG HOUSEHOLD SIZE
983
LABOR FORCE [ PEOPLE ]
52.2%
PERCENT IN LABOR FORCE
6.7%
UNEMPLOYMENT RATE
Bald Knob Zip Codes
Bald Knob Area Codes
Income in Bald Knob
Income Overview in Bald Knob
Per Capita Income in Bald Knob is $23,651, while median incomes of families and households are $52,578 and $47,917 respectively.
| Characteristic | Number | Measure |
| Per Capita Income | 2,548 | $23,651 |
| Median Family Income | 601 | $52,578 |
| Mean Family Income | 601 | $68,689 |
| Median Household Income | 923 | $47,917 |
| Mean Household Income | 923 | $62,429 |
| Income Deficit | 601 | $0 |
| Wage / Income Gap (%) | 2,548 | 5.41% |
| Wage / Income Gap ($) | 2,548 | 94.59¢ per $1 |
| Gini / Inequality Index | 2,548 | 0.42 |
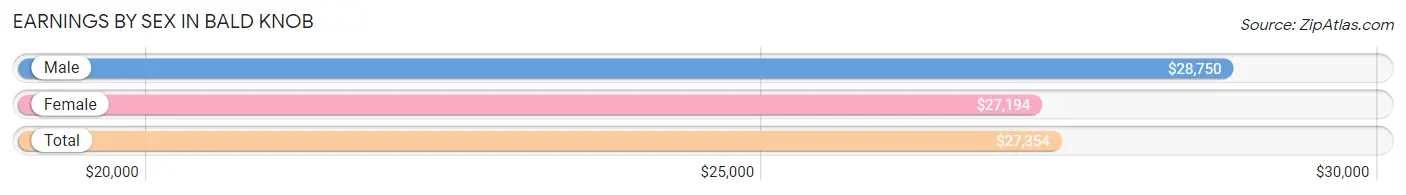
Earnings by Sex in Bald Knob
Average Earnings in Bald Knob are $27,354, $28,750 for men and $27,194 for women, a difference of 5.4%.
| Sex | Number | Average Earnings |
| Male | 636 (63.3%) | $28,750 |
| Female | 369 (36.7%) | $27,194 |
| Total | 1,005 (100.0%) | $27,354 |
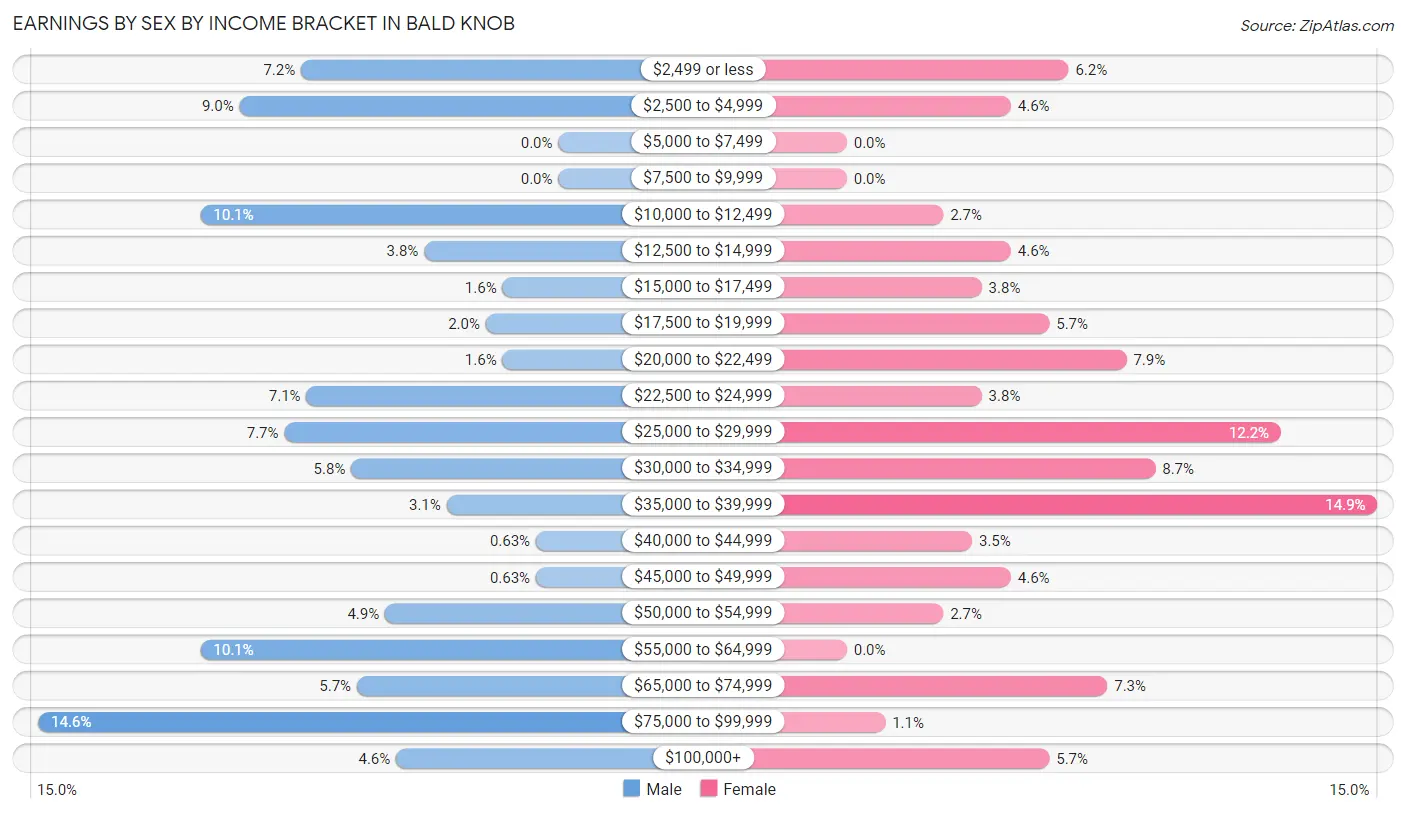
Earnings by Sex by Income Bracket in Bald Knob
The most common earnings brackets in Bald Knob are $75,000 to $99,999 for men (93 | 14.6%) and $35,000 to $39,999 for women (55 | 14.9%).
| Income | Male | Female |
| $2,499 or less | 46 (7.2%) | 23 (6.2%) |
| $2,500 to $4,999 | 57 (9.0%) | 17 (4.6%) |
| $5,000 to $7,499 | 0 (0.0%) | 0 (0.0%) |
| $7,500 to $9,999 | 0 (0.0%) | 0 (0.0%) |
| $10,000 to $12,499 | 64 (10.1%) | 10 (2.7%) |
| $12,500 to $14,999 | 24 (3.8%) | 17 (4.6%) |
| $15,000 to $17,499 | 10 (1.6%) | 14 (3.8%) |
| $17,500 to $19,999 | 13 (2.0%) | 21 (5.7%) |
| $20,000 to $22,499 | 10 (1.6%) | 29 (7.9%) |
| $22,500 to $24,999 | 45 (7.1%) | 14 (3.8%) |
| $25,000 to $29,999 | 49 (7.7%) | 45 (12.2%) |
| $30,000 to $34,999 | 37 (5.8%) | 32 (8.7%) |
| $35,000 to $39,999 | 20 (3.1%) | 55 (14.9%) |
| $40,000 to $44,999 | 4 (0.6%) | 13 (3.5%) |
| $45,000 to $49,999 | 4 (0.6%) | 17 (4.6%) |
| $50,000 to $54,999 | 31 (4.9%) | 10 (2.7%) |
| $55,000 to $64,999 | 64 (10.1%) | 0 (0.0%) |
| $65,000 to $74,999 | 36 (5.7%) | 27 (7.3%) |
| $75,000 to $99,999 | 93 (14.6%) | 4 (1.1%) |
| $100,000+ | 29 (4.6%) | 21 (5.7%) |
| Total | 636 (100.0%) | 369 (100.0%) |
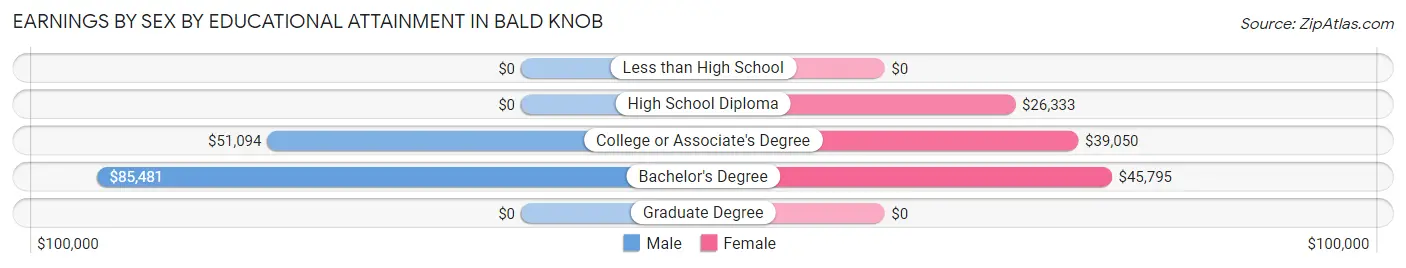
Earnings by Sex by Educational Attainment in Bald Knob
Average earnings in Bald Knob are $53,563 for men and $33,482 for women, a difference of 37.5%. Men with an educational attainment of bachelor's degree enjoy the highest average annual earnings of $85,481, while those with college or associate's degree education earn the least with $51,094. Women with an educational attainment of bachelor's degree earn the most with the average annual earnings of $45,795, while those with high school diploma education have the smallest earnings of $26,333.
| Educational Attainment | Male Income | Female Income |
| Less than High School | - | - |
| High School Diploma | - | - |
| College or Associate's Degree | $51,094 | $39,050 |
| Bachelor's Degree | $85,481 | $45,795 |
| Graduate Degree | - | - |
| Total | $53,563 | $33,482 |
Family Income in Bald Knob
Family Income Brackets in Bald Knob
According to the Bald Knob family income data, there are 121 families falling into the $35,000 to $49,999 income range, which is the most common income bracket and makes up 20.1% of all families. Conversely, the $10,000 to $14,999 income bracket is the least frequent group with only 11 families (1.8%) belonging to this category.
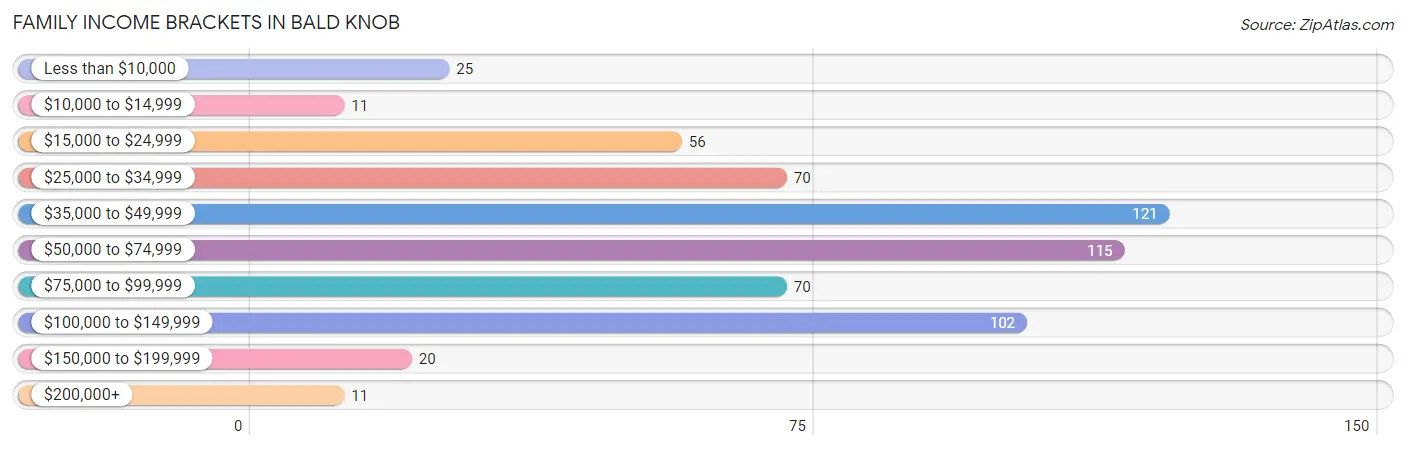
| Income Bracket | # Families | % Families |
| Less than $10,000 | 25 | 4.2% |
| $10,000 to $14,999 | 11 | 1.8% |
| $15,000 to $24,999 | 56 | 9.3% |
| $25,000 to $34,999 | 70 | 11.6% |
| $35,000 to $49,999 | 121 | 20.1% |
| $50,000 to $74,999 | 115 | 19.1% |
| $75,000 to $99,999 | 70 | 11.6% |
| $100,000 to $149,999 | 102 | 17.0% |
| $150,000 to $199,999 | 20 | 3.3% |
| $200,000+ | 11 | 1.8% |
Family Income by Famaliy Size in Bald Knob
2-person families (214 | 35.6%) account for the highest median family income in Bald Knob with $81,071 per family, while 2-person families (214 | 35.6%) have the highest median income of $40,536 per family member.
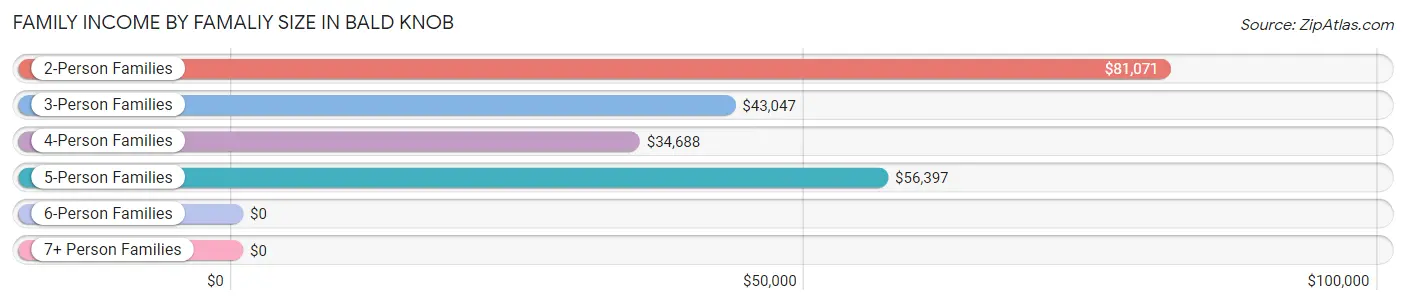
| Income Bracket | # Families | Median Income |
| 2-Person Families | 214 (35.6%) | $81,071 |
| 3-Person Families | 151 (25.1%) | $43,047 |
| 4-Person Families | 117 (19.5%) | $34,688 |
| 5-Person Families | 73 (12.1%) | $56,397 |
| 6-Person Families | 19 (3.2%) | $0 |
| 7+ Person Families | 27 (4.5%) | $0 |
| Total | 601 (100.0%) | $52,578 |
Family Income by Number of Earners in Bald Knob
The median family income in Bald Knob is $52,578, with families comprising 3+ earners (48) having the highest median family income of $130,100, while families with no earners (75) have the lowest median family income of $32,031, accounting for 8.0% and 12.5% of families, respectively.
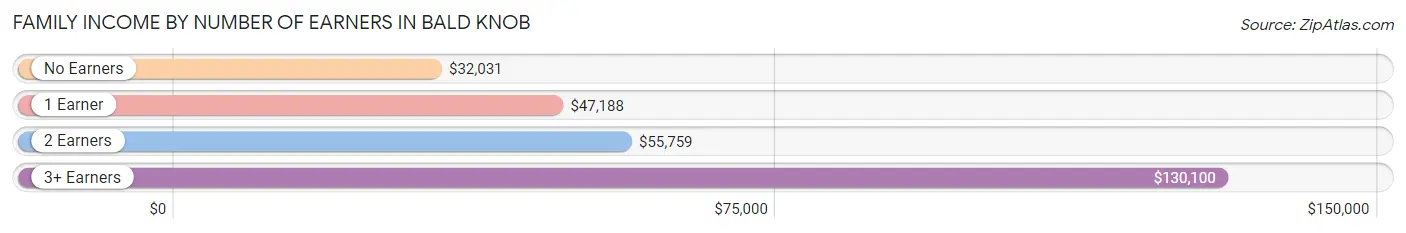
| Number of Earners | # Families | Median Income |
| No Earners | 75 (12.5%) | $32,031 |
| 1 Earner | 305 (50.7%) | $47,188 |
| 2 Earners | 173 (28.8%) | $55,759 |
| 3+ Earners | 48 (8.0%) | $130,100 |
| Total | 601 (100.0%) | $52,578 |
Household Income in Bald Knob
Household Income Brackets in Bald Knob
With 171 households falling in the category, the $100,000 to $149,999 income range is the most frequent in Bald Knob, accounting for 18.5% of all households. In contrast, only 11 households (1.2%) fall into the $200,000+ income bracket, making it the least populous group.
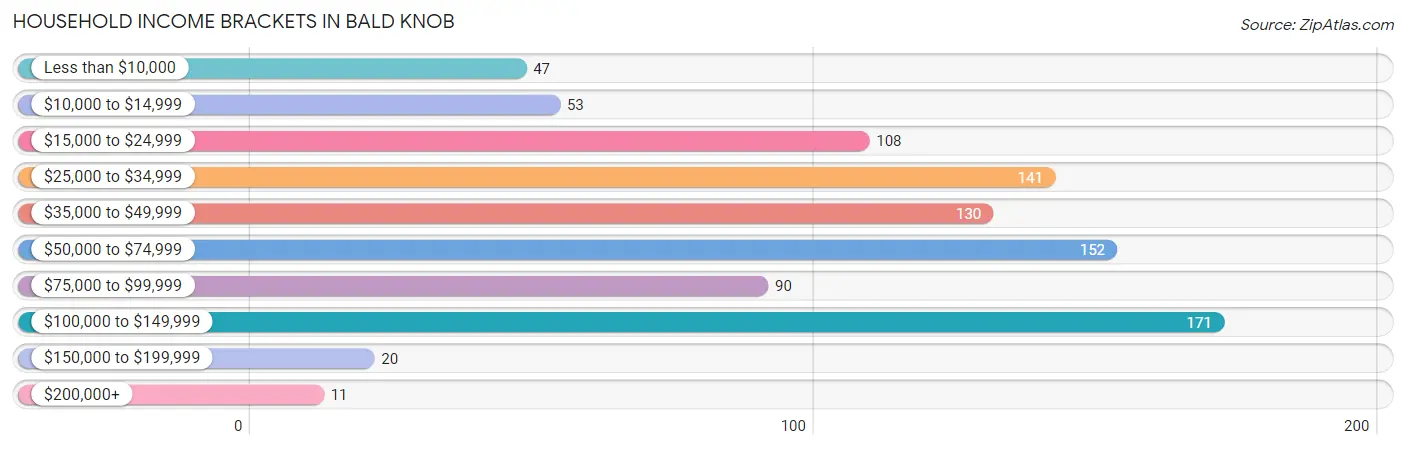
| Income Bracket | # Households | % Households |
| Less than $10,000 | 47 | 5.1% |
| $10,000 to $14,999 | 53 | 5.7% |
| $15,000 to $24,999 | 108 | 11.7% |
| $25,000 to $34,999 | 141 | 15.3% |
| $35,000 to $49,999 | 130 | 14.1% |
| $50,000 to $74,999 | 152 | 16.5% |
| $75,000 to $99,999 | 90 | 9.8% |
| $100,000 to $149,999 | 171 | 18.5% |
| $150,000 to $199,999 | 20 | 2.2% |
| $200,000+ | 11 | 1.2% |
Household Income by Householder Age in Bald Knob
The median household income in Bald Knob is $47,917, with the highest median household income of $56,597 found in the 25 to 44 years age bracket for the primary householder. A total of 301 households (32.6%) fall into this category. Meanwhile, the 15 to 24 years age bracket for the primary householder has the lowest median household income of $0, with 36 households (3.9%) in this group.
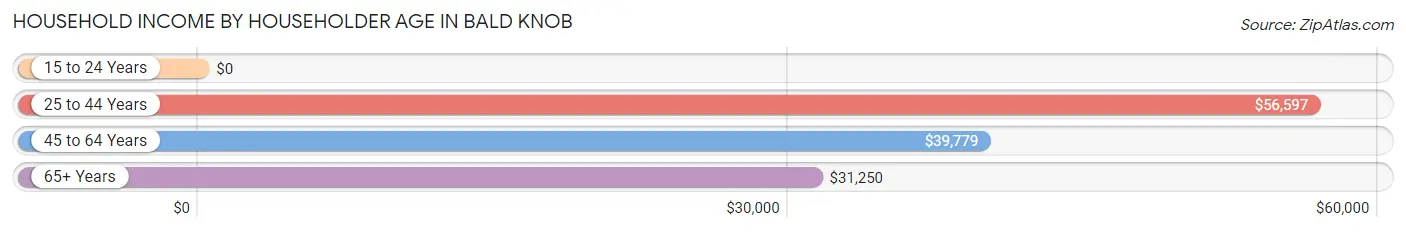
| Income Bracket | # Households | Median Income |
| 15 to 24 Years | 36 (3.9%) | $0 |
| 25 to 44 Years | 301 (32.6%) | $56,597 |
| 45 to 64 Years | 311 (33.7%) | $39,779 |
| 65+ Years | 275 (29.8%) | $31,250 |
| Total | 923 (100.0%) | $47,917 |
Poverty in Bald Knob
Income Below Poverty by Sex and Age in Bald Knob
With 16.1% poverty level for males and 19.2% for females among the residents of Bald Knob, 15 year old males and 6 to 11 year old females are the most vulnerable to poverty, with 6 males (85.7%) and 33 females (31.1%) in their respective age groups living below the poverty level.
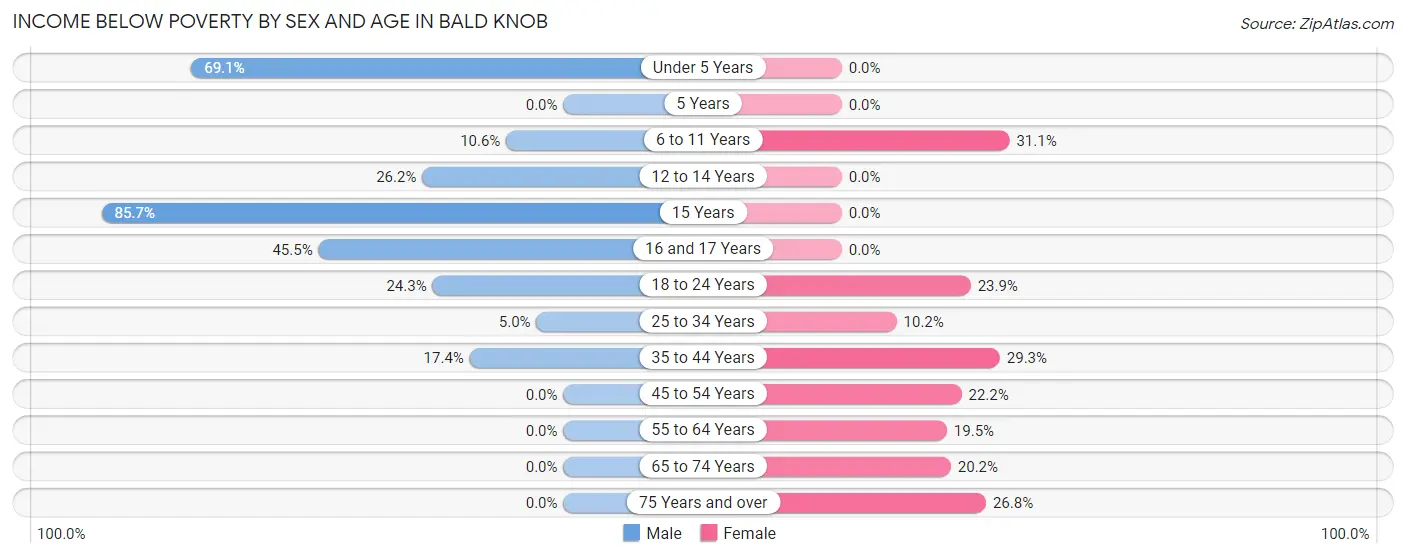
| Age Bracket | Male | Female |
| Under 5 Years | 58 (69.1%) | 0 (0.0%) |
| 5 Years | 0 (0.0%) | 0 (0.0%) |
| 6 to 11 Years | 19 (10.6%) | 33 (31.1%) |
| 12 to 14 Years | 33 (26.2%) | 0 (0.0%) |
| 15 Years | 6 (85.7%) | 0 (0.0%) |
| 16 and 17 Years | 30 (45.5%) | 0 (0.0%) |
| 18 to 24 Years | 43 (24.3%) | 28 (23.9%) |
| 25 to 34 Years | 7 (5.0%) | 12 (10.2%) |
| 35 to 44 Years | 24 (17.4%) | 49 (29.3%) |
| 45 to 54 Years | 0 (0.0%) | 28 (22.2%) |
| 55 to 64 Years | 0 (0.0%) | 40 (19.5%) |
| 65 to 74 Years | 0 (0.0%) | 17 (20.2%) |
| 75 Years and over | 0 (0.0%) | 19 (26.8%) |
| Total | 220 (16.1%) | 226 (19.2%) |
Income Above Poverty by Sex and Age in Bald Knob
According to the poverty statistics in Bald Knob, males aged 5 years and females aged under 5 years are the age groups that are most secure financially, with 100.0% of males and 100.0% of females in these age groups living above the poverty line.
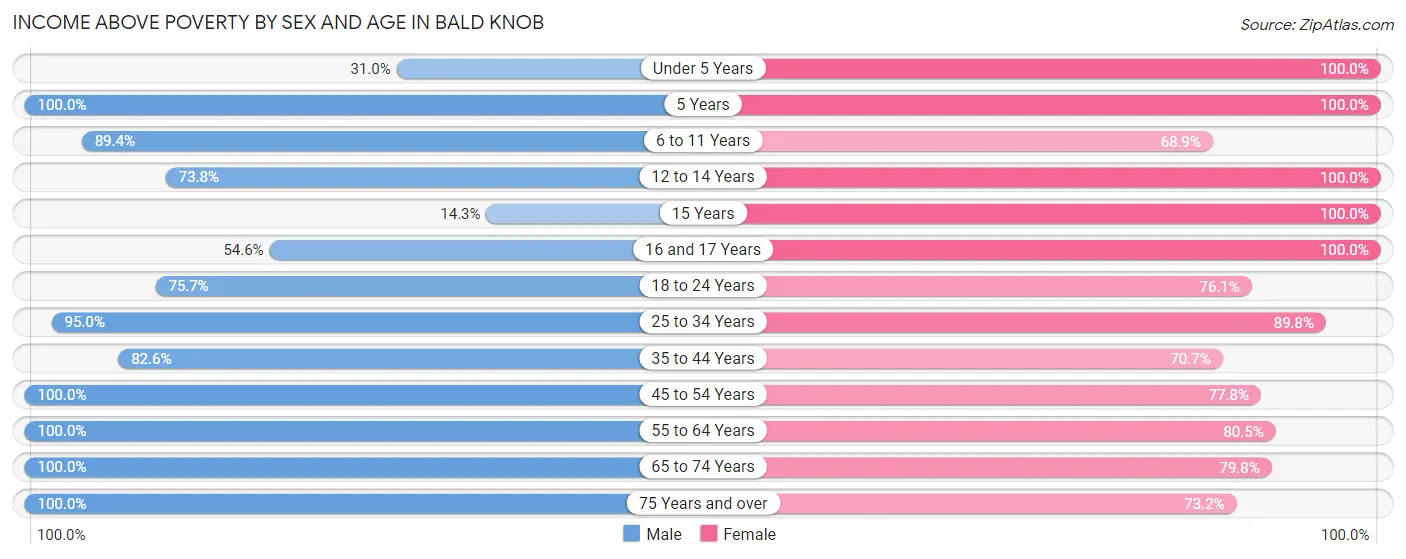
| Age Bracket | Male | Female |
| Under 5 Years | 26 (30.9%) | 46 (100.0%) |
| 5 Years | 10 (100.0%) | 35 (100.0%) |
| 6 to 11 Years | 160 (89.4%) | 73 (68.9%) |
| 12 to 14 Years | 93 (73.8%) | 20 (100.0%) |
| 15 Years | 1 (14.3%) | 51 (100.0%) |
| 16 and 17 Years | 36 (54.5%) | 33 (100.0%) |
| 18 to 24 Years | 134 (75.7%) | 89 (76.1%) |
| 25 to 34 Years | 133 (95.0%) | 106 (89.8%) |
| 35 to 44 Years | 114 (82.6%) | 118 (70.7%) |
| 45 to 54 Years | 170 (100.0%) | 98 (77.8%) |
| 55 to 64 Years | 82 (100.0%) | 165 (80.5%) |
| 65 to 74 Years | 55 (100.0%) | 67 (79.8%) |
| 75 Years and over | 135 (100.0%) | 52 (73.2%) |
| Total | 1,149 (83.9%) | 953 (80.8%) |
Income Below Poverty Among Married-Couple Families in Bald Knob
The poverty statistics for married-couple families in Bald Knob show that 4.0% or 12 of the total 302 families live below the poverty line. Families with 3 or 4 children have the highest poverty rate of 9.1%, comprising of 7 families. On the other hand, families with no children have the lowest poverty rate of 0.0%, which includes 0 families.
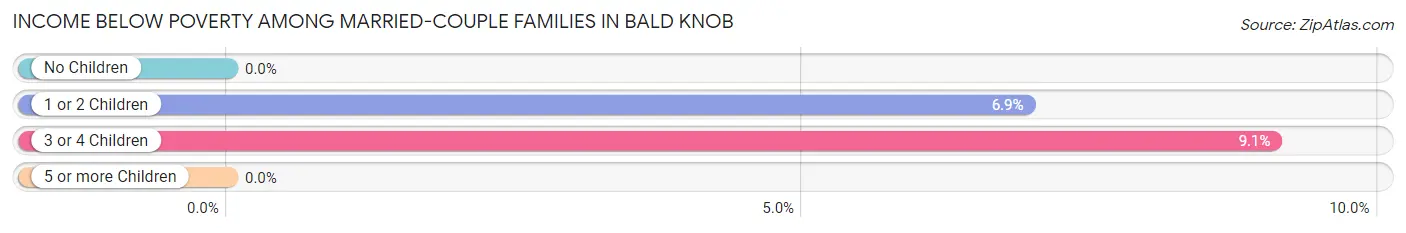
| Children | Above Poverty | Below Poverty |
| No Children | 153 (100.0%) | 0 (0.0%) |
| 1 or 2 Children | 67 (93.1%) | 5 (6.9%) |
| 3 or 4 Children | 70 (90.9%) | 7 (9.1%) |
| 5 or more Children | 0 (0.0%) | 0 (0.0%) |
| Total | 290 (96.0%) | 12 (4.0%) |
Income Below Poverty Among Single-Parent Households in Bald Knob
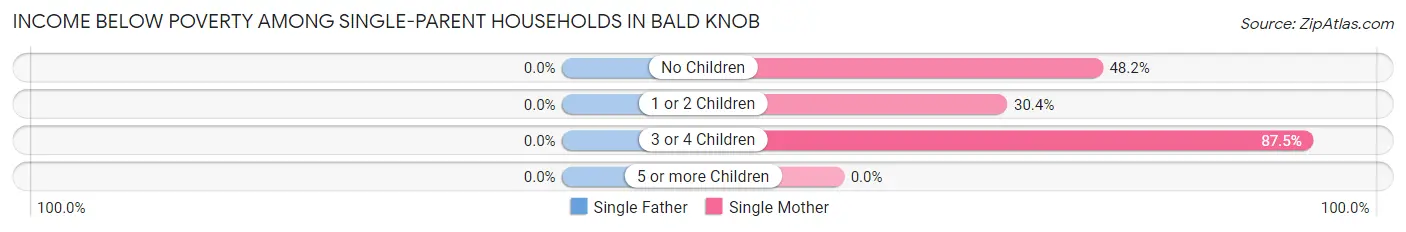
| Children | Single Father | Single Mother |
| No Children | 0 (0.0%) | 27 (48.2%) |
| 1 or 2 Children | 0 (0.0%) | 49 (30.4%) |
| 3 or 4 Children | 0 (0.0%) | 14 (87.5%) |
| 5 or more Children | 0 (0.0%) | 0 (0.0%) |
| Total | 0 (0.0%) | 90 (38.6%) |
Income Below Poverty Among Married-Couple vs Single-Parent Households in Bald Knob
The poverty data for Bald Knob shows that 12 of the married-couple family households (4.0%) and 90 of the single-parent households (30.1%) are living below the poverty level. Within the married-couple family households, those with 3 or 4 children have the highest poverty rate, with 7 households (9.1%) falling below the poverty line. Among the single-parent households, those with 3 or 4 children have the highest poverty rate, with 14 household (63.6%) living below poverty.
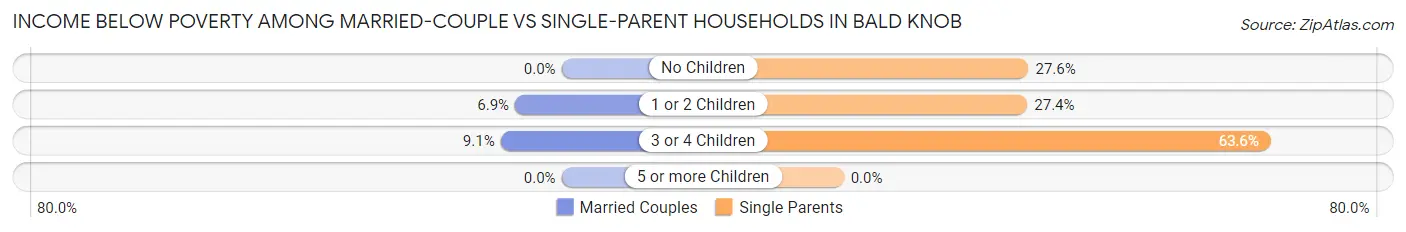
| Children | Married-Couple Families | Single-Parent Households |
| No Children | 0 (0.0%) | 27 (27.6%) |
| 1 or 2 Children | 5 (6.9%) | 49 (27.4%) |
| 3 or 4 Children | 7 (9.1%) | 14 (63.6%) |
| 5 or more Children | 0 (0.0%) | 0 (0.0%) |
| Total | 12 (4.0%) | 90 (30.1%) |
Race in Bald Knob
The most populous races in Bald Knob are White / Caucasian (2,328 | 91.4%), Hispanic or Latino (167 | 6.6%), and Two or more Races (128 | 5.0%).
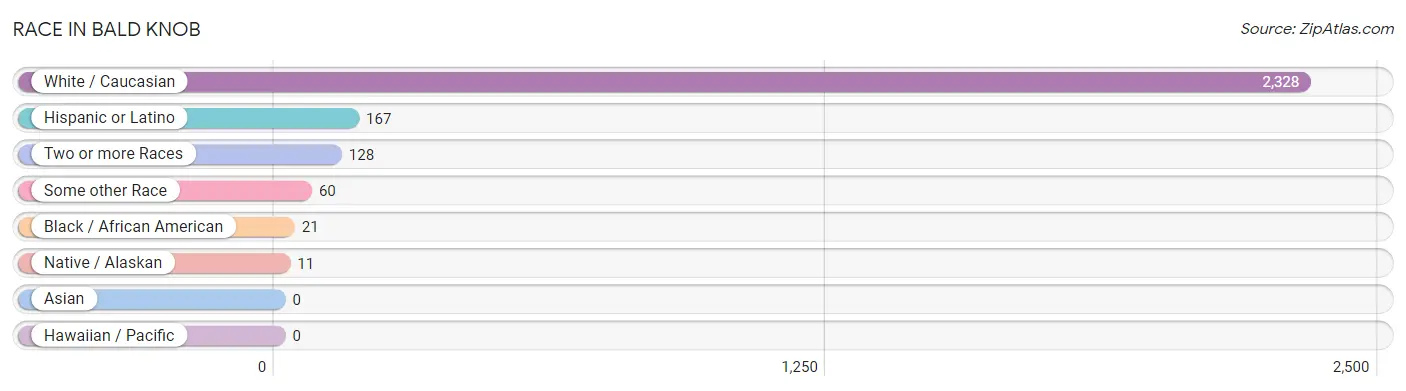
| Race | # Population | % Population |
| Asian | 0 | 0.0% |
| Black / African American | 21 | 0.8% |
| Hawaiian / Pacific | 0 | 0.0% |
| Hispanic or Latino | 167 | 6.6% |
| Native / Alaskan | 11 | 0.4% |
| White / Caucasian | 2,328 | 91.4% |
| Two or more Races | 128 | 5.0% |
| Some other Race | 60 | 2.4% |
| Total | 2,548 | 100.0% |
Ancestry in Bald Knob
The most populous ancestries reported in Bald Knob are American (353 | 13.9%), Irish (246 | 9.7%), English (176 | 6.9%), German (167 | 6.6%), and Mexican (167 | 6.6%), together accounting for 43.5% of all Bald Knob residents.
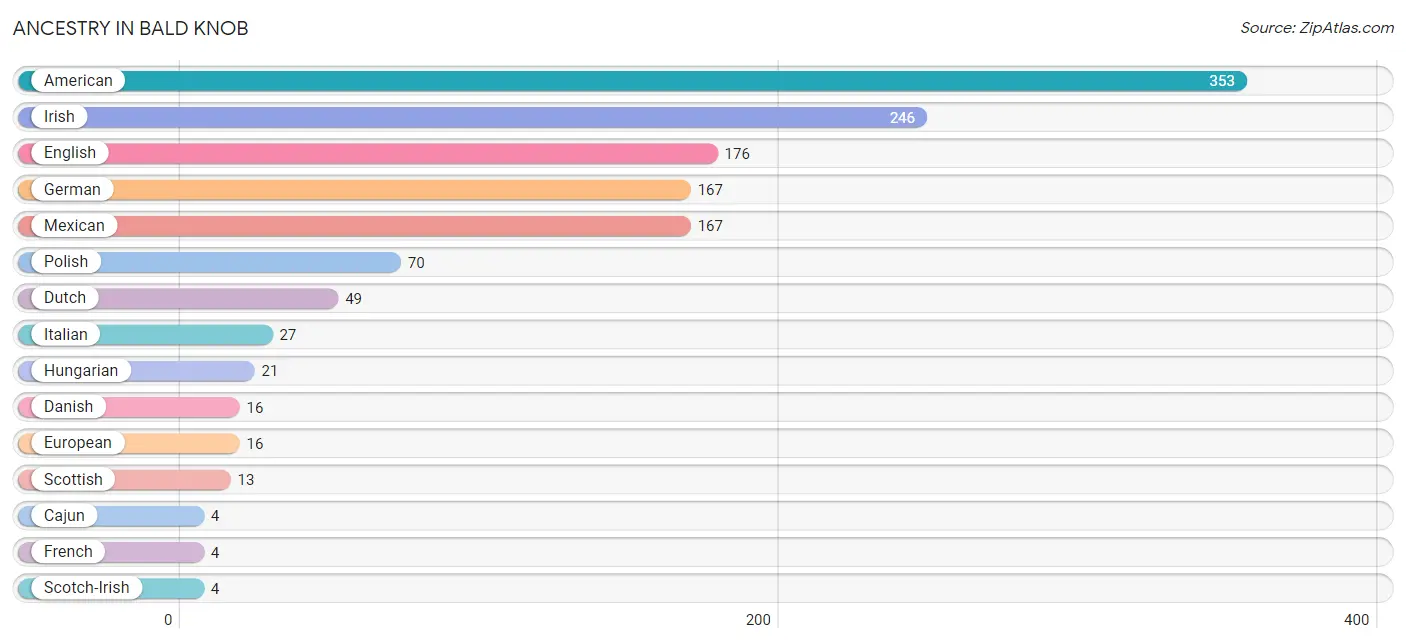
| Ancestry | # Population | % Population |
| American | 353 | 13.9% |
| Cajun | 4 | 0.2% |
| Cherokee | 3 | 0.1% |
| Danish | 16 | 0.6% |
| Dutch | 49 | 1.9% |
| English | 176 | 6.9% |
| European | 16 | 0.6% |
| French | 4 | 0.2% |
| German | 167 | 6.6% |
| Hungarian | 21 | 0.8% |
| Irish | 246 | 9.7% |
| Italian | 27 | 1.1% |
| Mexican | 167 | 6.6% |
| Polish | 70 | 2.8% |
| Scotch-Irish | 4 | 0.2% |
| Scottish | 13 | 0.5% |
| Sioux | 1 | 0.0% | View All 17 Rows |
Immigrants in Bald Knob
The most numerous immigrant groups reported in Bald Knob came from Central America (54 | 2.1%), Latin America (54 | 2.1%), and Mexico (54 | 2.1%), together accounting for 6.4% of all Bald Knob residents.
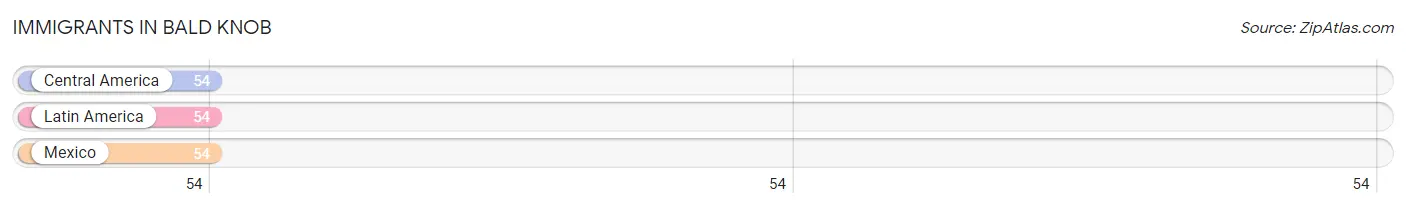
| Immigration Origin | # Population | % Population |
| Central America | 54 | 2.1% |
| Latin America | 54 | 2.1% |
| Mexico | 54 | 2.1% | View All 3 Rows |
Sex and Age in Bald Knob
Sex and Age in Bald Knob
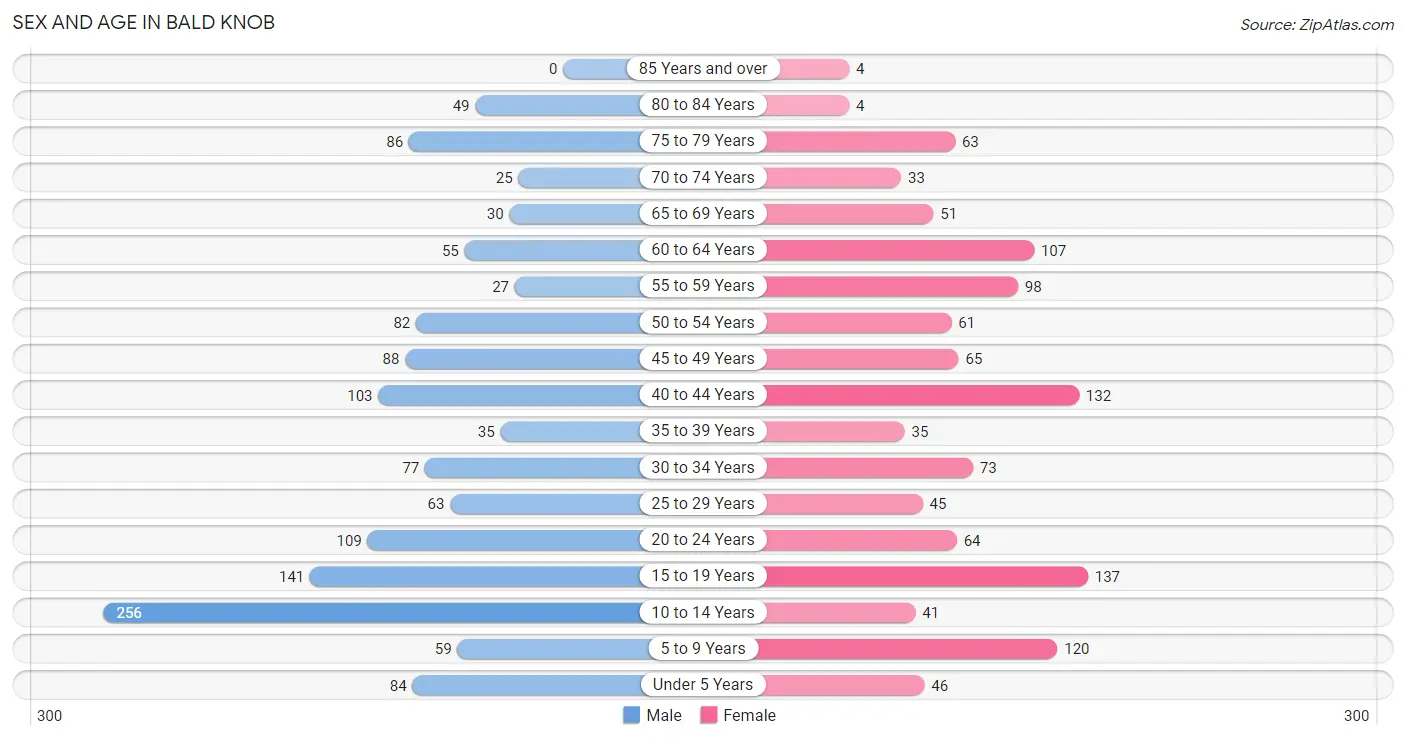
The most populous age groups in Bald Knob are 10 to 14 Years (256 | 18.7%) for men and 15 to 19 Years (137 | 11.6%) for women.
| Age Bracket | Male | Female |
| Under 5 Years | 84 (6.1%) | 46 (3.9%) |
| 5 to 9 Years | 59 (4.3%) | 120 (10.2%) |
| 10 to 14 Years | 256 (18.7%) | 41 (3.5%) |
| 15 to 19 Years | 141 (10.3%) | 137 (11.6%) |
| 20 to 24 Years | 109 (8.0%) | 64 (5.4%) |
| 25 to 29 Years | 63 (4.6%) | 45 (3.8%) |
| 30 to 34 Years | 77 (5.6%) | 73 (6.2%) |
| 35 to 39 Years | 35 (2.6%) | 35 (3.0%) |
| 40 to 44 Years | 103 (7.5%) | 132 (11.2%) |
| 45 to 49 Years | 88 (6.4%) | 65 (5.5%) |
| 50 to 54 Years | 82 (6.0%) | 61 (5.2%) |
| 55 to 59 Years | 27 (2.0%) | 98 (8.3%) |
| 60 to 64 Years | 55 (4.0%) | 107 (9.1%) |
| 65 to 69 Years | 30 (2.2%) | 51 (4.3%) |
| 70 to 74 Years | 25 (1.8%) | 33 (2.8%) |
| 75 to 79 Years | 86 (6.3%) | 63 (5.3%) |
| 80 to 84 Years | 49 (3.6%) | 4 (0.3%) |
| 85 Years and over | 0 (0.0%) | 4 (0.3%) |
| Total | 1,369 (100.0%) | 1,179 (100.0%) |
Families and Households in Bald Knob
Median Family Size in Bald Knob
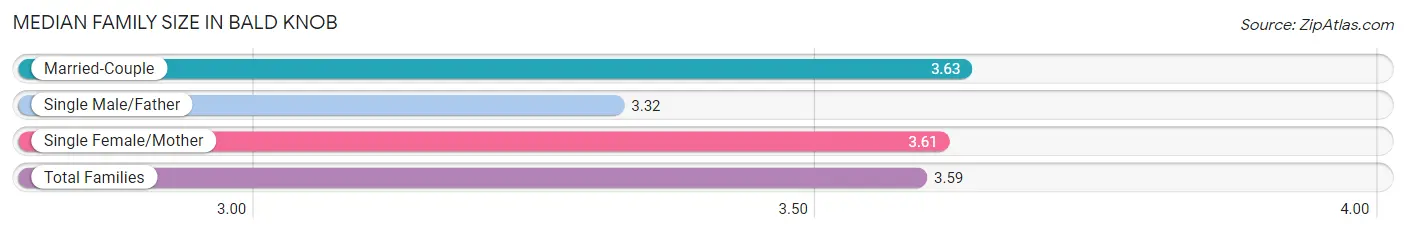
The median family size in Bald Knob is 3.59 persons per family, with married-couple families (302 | 50.2%) accounting for the largest median family size of 3.63 persons per family. On the other hand, single male/father families (66 | 11.0%) represent the smallest median family size with 3.32 persons per family.
| Family Type | # Families | Family Size |
| Married-Couple | 302 (50.2%) | 3.63 |
| Single Male/Father | 66 (11.0%) | 3.32 |
| Single Female/Mother | 233 (38.8%) | 3.61 |
| Total Families | 601 (100.0%) | 3.59 |
Median Household Size in Bald Knob
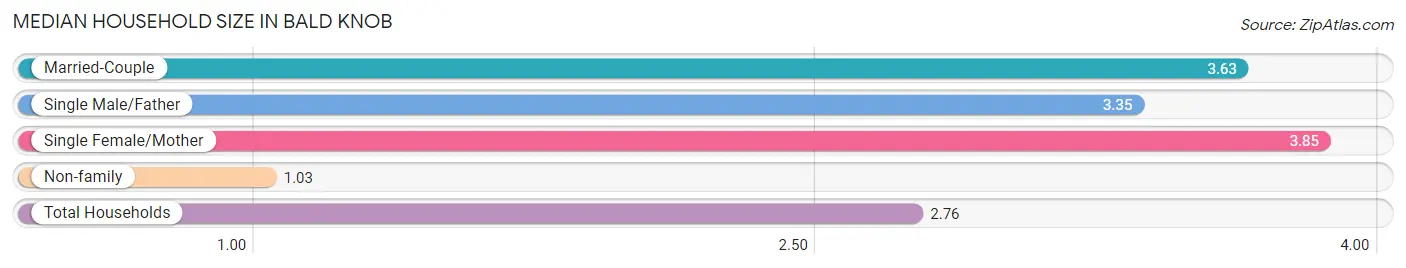
The median household size in Bald Knob is 2.76 persons per household, with single female/mother households (233 | 25.2%) accounting for the largest median household size of 3.85 persons per household. non-family households (322 | 34.9%) represent the smallest median household size with 1.03 persons per household.
| Household Type | # Households | Household Size |
| Married-Couple | 302 (32.7%) | 3.63 |
| Single Male/Father | 66 (7.1%) | 3.35 |
| Single Female/Mother | 233 (25.2%) | 3.85 |
| Non-family | 322 (34.9%) | 1.03 |
| Total Households | 923 (100.0%) | 2.76 |
Household Size by Marriage Status in Bald Knob
Out of a total of 923 households in Bald Knob, 601 (65.1%) are family households, while 322 (34.9%) are nonfamily households. The most numerous type of family households are 2-person households, comprising 198, and the most common type of nonfamily households are 1-person households, comprising 313.
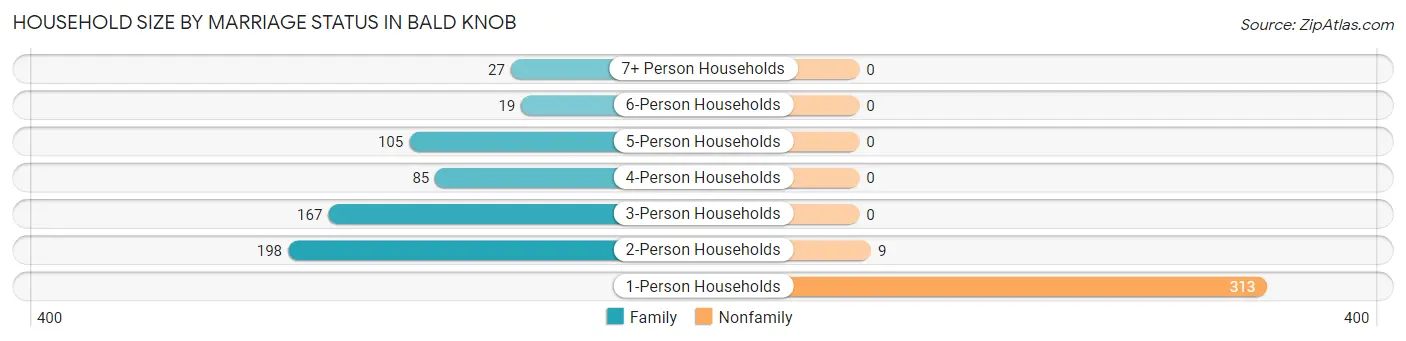
| Household Size | Family Households | Nonfamily Households |
| 1-Person Households | - | 313 (33.9%) |
| 2-Person Households | 198 (21.4%) | 9 (1.0%) |
| 3-Person Households | 167 (18.1%) | 0 (0.0%) |
| 4-Person Households | 85 (9.2%) | 0 (0.0%) |
| 5-Person Households | 105 (11.4%) | 0 (0.0%) |
| 6-Person Households | 19 (2.1%) | 0 (0.0%) |
| 7+ Person Households | 27 (2.9%) | 0 (0.0%) |
| Total | 601 (65.1%) | 322 (34.9%) |
Female Fertility in Bald Knob
Fertility by Age in Bald Knob
Average fertility rate in Bald Knob is 45.0 births per 1,000 women. Women in the age bracket of 20 to 34 years have the highest fertility rate with 143.0 births per 1,000 women. Women in the age bracket of 20 to 34 years acount for 100.0% of all women with births.
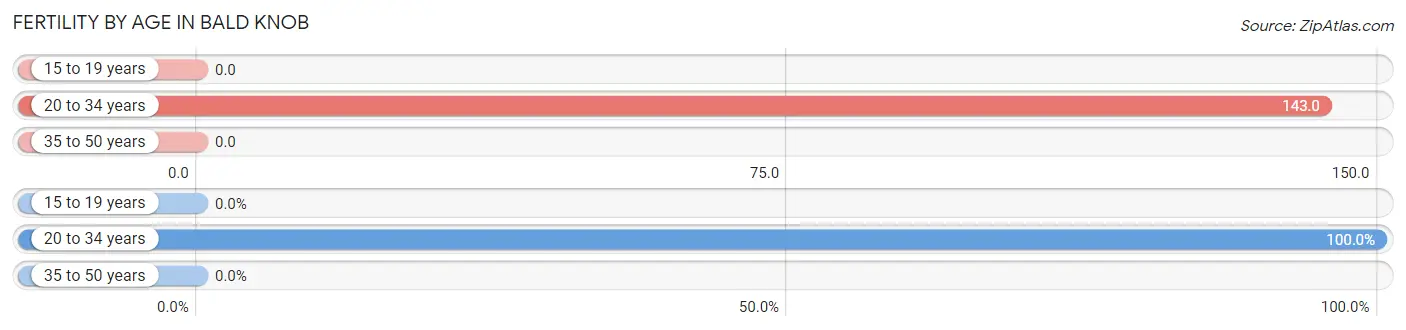
| Age Bracket | Women with Births | Births / 1,000 Women |
| 15 to 19 years | 0 (0.0%) | 0.0 |
| 20 to 34 years | 26 (100.0%) | 143.0 |
| 35 to 50 years | 0 (0.0%) | 0.0 |
| Total | 26 (100.0%) | 45.0 |
Fertility by Age by Marriage Status in Bald Knob
23.1% of women with births (26) in Bald Knob are married. The highest percentage of unmarried women with births falls into 20 to 34 years age bracket with 76.9% of them unmarried at the time of birth, while the lowest percentage of unmarried women with births belong to 20 to 34 years age bracket with 76.9% of them unmarried.
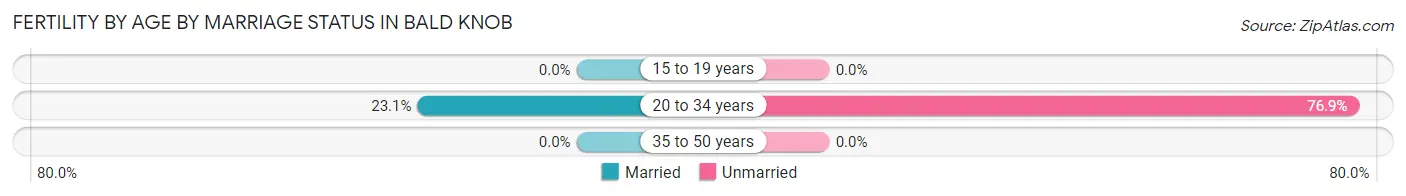
| Age Bracket | Married | Unmarried |
| 15 to 19 years | 0 (0.0%) | 0 (0.0%) |
| 20 to 34 years | 6 (23.1%) | 20 (76.9%) |
| 35 to 50 years | 0 (0.0%) | 0 (0.0%) |
| Total | 6 (23.1%) | 20 (76.9%) |
Fertility by Education in Bald Knob
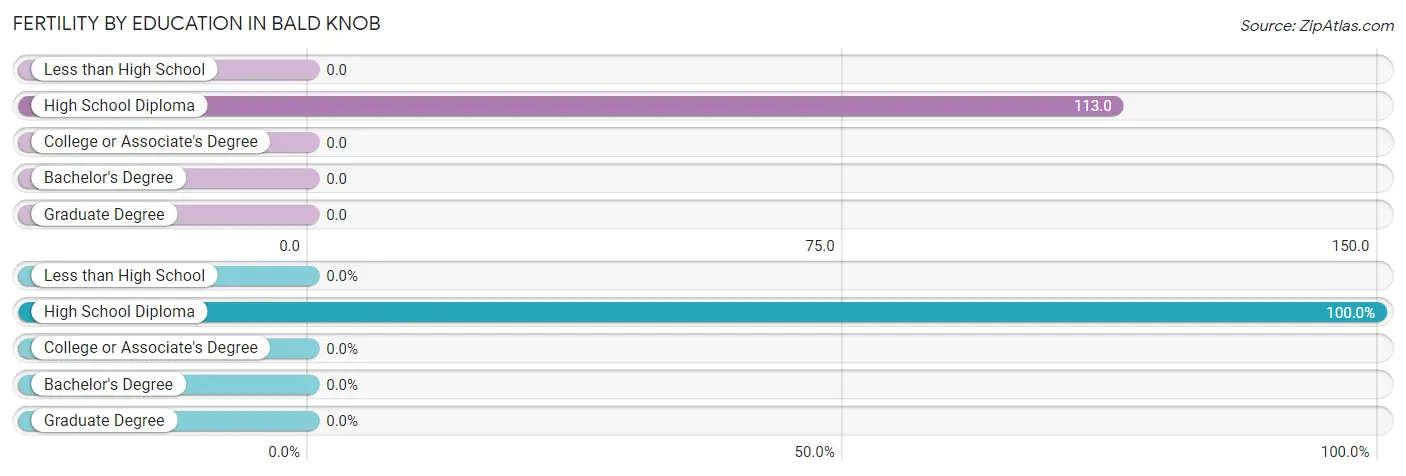
| Educational Attainment | Women with Births | Births / 1,000 Women |
| Less than High School | 0 (0.0%) | 0.0 |
| High School Diploma | 26 (100.0%) | 113.0 |
| College or Associate's Degree | 0 (0.0%) | 0.0 |
| Bachelor's Degree | 0 (0.0%) | 0.0 |
| Graduate Degree | 0 (0.0%) | 0.0 |
| Total | 26 (100.0%) | 45.0 |
Fertility by Education by Marriage Status in Bald Knob
76.9% of women with births in Bald Knob are unmarried. Women with the educational attainment of high school diploma are most likely to be married with 23.1% of them married at childbirth, while women with the educational attainment of high school diploma are least likely to be married with 76.9% of them unmarried at childbirth.
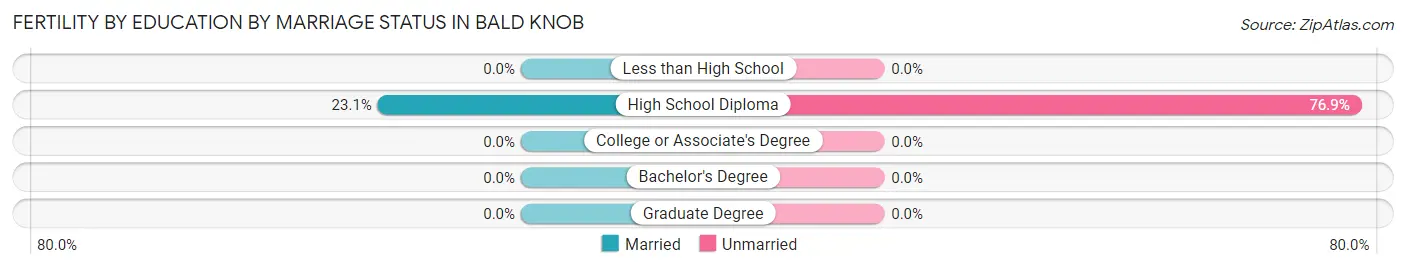
| Educational Attainment | Married | Unmarried |
| Less than High School | 0 (0.0%) | 0 (0.0%) |
| High School Diploma | 6 (23.1%) | 20 (76.9%) |
| College or Associate's Degree | 0 (0.0%) | 0 (0.0%) |
| Bachelor's Degree | 0 (0.0%) | 0 (0.0%) |
| Graduate Degree | 0 (0.0%) | 0 (0.0%) |
| Total | 6 (23.1%) | 20 (76.9%) |
Employment Characteristics in Bald Knob
Employment by Class of Employer in Bald Knob
Among the 917 employed individuals in Bald Knob, private company employees (735 | 80.1%), state government employees (73 | 8.0%), and self-employed (not incorporated) (51 | 5.6%) make up the most common classes of employment.
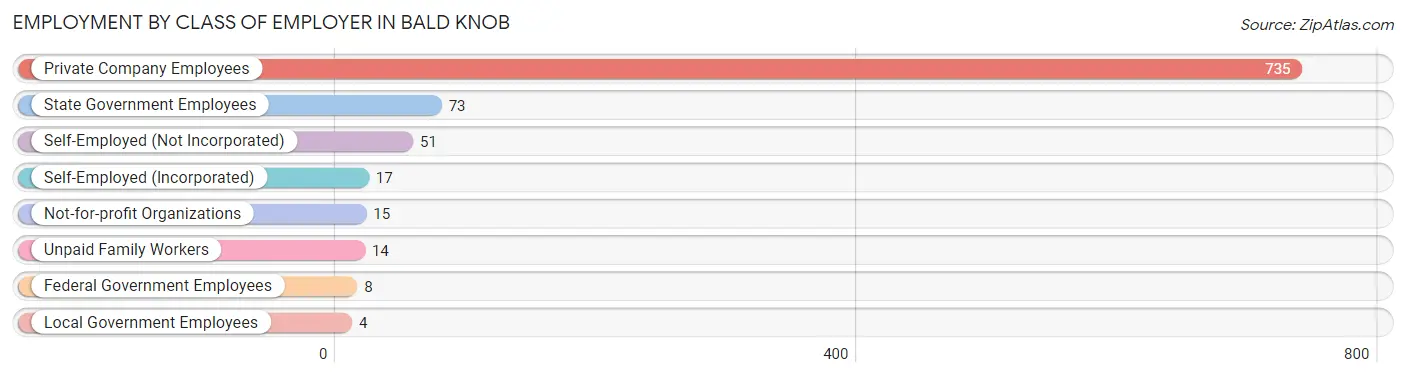
| Employer Class | # Employees | % Employees |
| Private Company Employees | 735 | 80.1% |
| Self-Employed (Incorporated) | 17 | 1.8% |
| Self-Employed (Not Incorporated) | 51 | 5.6% |
| Not-for-profit Organizations | 15 | 1.6% |
| Local Government Employees | 4 | 0.4% |
| State Government Employees | 73 | 8.0% |
| Federal Government Employees | 8 | 0.9% |
| Unpaid Family Workers | 14 | 1.5% |
| Total | 917 | 100.0% |
Employment Status by Age in Bald Knob
According to the labor force statistics for Bald Knob, out of the total population over 16 years of age (1,884), 52.2% or 983 individuals are in the labor force, with 6.7% or 66 of them unemployed. The age group with the highest labor force participation rate is 30 to 34 years, with 95.3% or 143 individuals in the labor force. Within the labor force, the 45 to 54 years age range has the highest percentage of unemployed individuals, with 24.5% or 48 of them being unemployed.
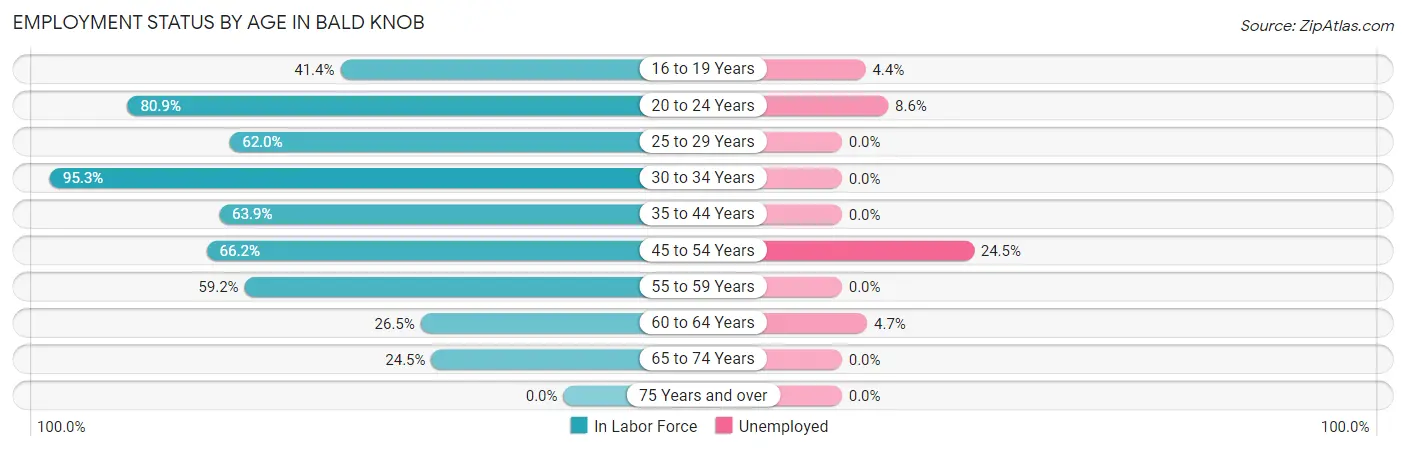
| Age Bracket | In Labor Force | Unemployed |
| 16 to 19 Years | 91 (41.4%) | 4 (4.4%) |
| 20 to 24 Years | 140 (80.9%) | 12 (8.6%) |
| 25 to 29 Years | 67 (62.0%) | 0 (0.0%) |
| 30 to 34 Years | 143 (95.3%) | 0 (0.0%) |
| 35 to 44 Years | 195 (63.9%) | 0 (0.0%) |
| 45 to 54 Years | 196 (66.2%) | 48 (24.5%) |
| 55 to 59 Years | 74 (59.2%) | 0 (0.0%) |
| 60 to 64 Years | 43 (26.5%) | 2 (4.7%) |
| 65 to 74 Years | 34 (24.5%) | 0 (0.0%) |
| 75 Years and over | 0 (0.0%) | 0 (0.0%) |
| Total | 983 (52.2%) | 66 (6.7%) |
Employment Status by Educational Attainment in Bald Knob
According to labor force statistics for Bald Knob, 62.7% of individuals (719) out of the total population between 25 and 64 years of age (1,146) are in the labor force, with 7.0% or 50 of them being unemployed. The group with the highest labor force participation rate are those with the educational attainment of bachelor's degree or higher, with 89.7% or 113 individuals in the labor force. Within the labor force, individuals with less than high school education have the highest percentage of unemployment, with 25.6% or 20 of them being unemployed.
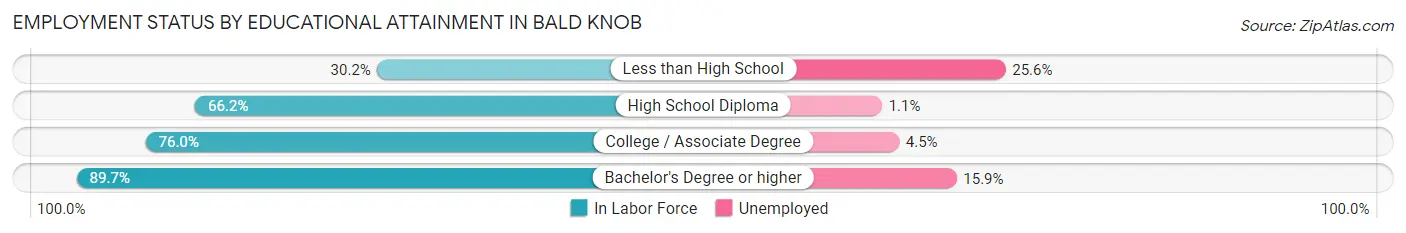
| Educational Attainment | In Labor Force | Unemployed |
| Less than High School | 78 (30.2%) | 66 (25.6%) |
| High School Diploma | 350 (66.2%) | 6 (1.1%) |
| College / Associate Degree | 177 (76.0%) | 10 (4.5%) |
| Bachelor's Degree or higher | 113 (89.7%) | 20 (15.9%) |
| Total | 719 (62.7%) | 80 (7.0%) |
Employment Occupations by Sex in Bald Knob
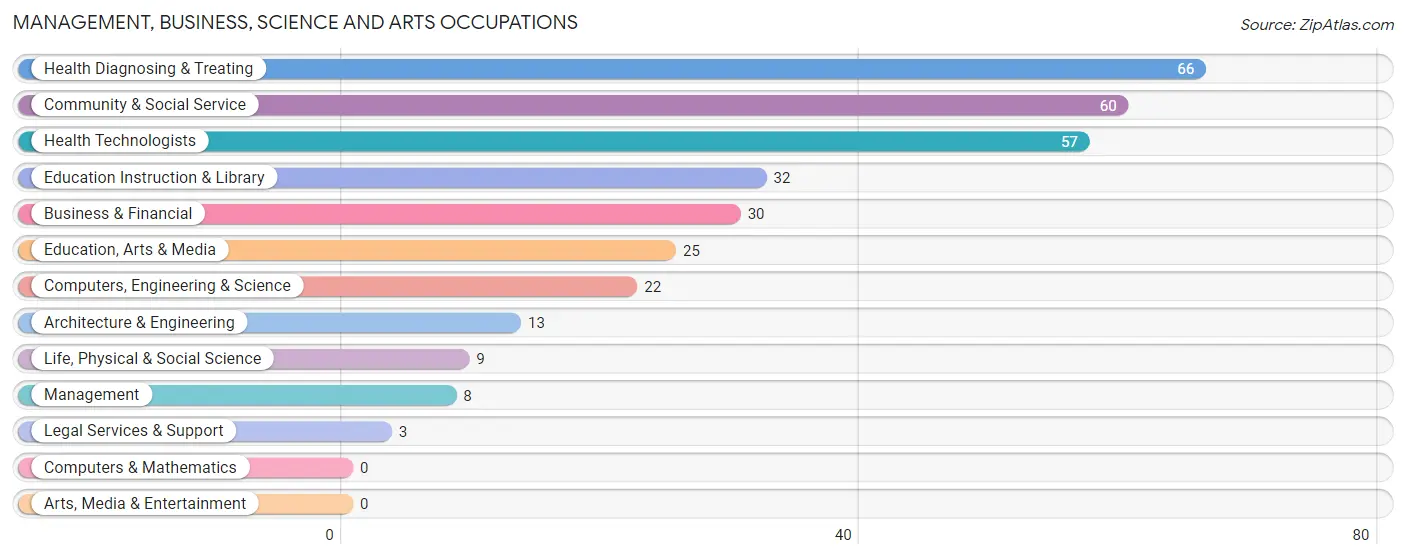
Management, Business, Science and Arts Occupations
The most common Management, Business, Science and Arts occupations in Bald Knob are Health Diagnosing & Treating (66 | 7.2%), Community & Social Service (60 | 6.5%), Health Technologists (57 | 6.2%), Education Instruction & Library (32 | 3.5%), and Business & Financial (30 | 3.3%).
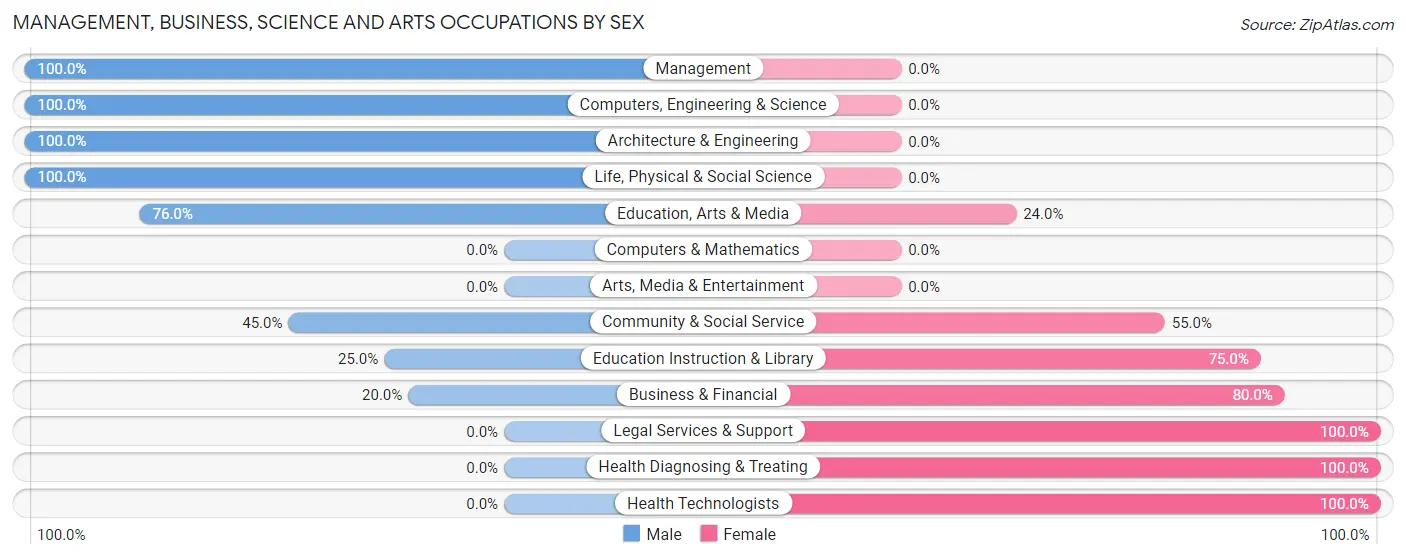
Management, Business, Science and Arts Occupations by Sex
Within the Management, Business, Science and Arts occupations in Bald Knob, the most male-oriented occupations are Management (100.0%), Computers, Engineering & Science (100.0%), and Architecture & Engineering (100.0%), while the most female-oriented occupations are Legal Services & Support (100.0%), Health Diagnosing & Treating (100.0%), and Health Technologists (100.0%).
| Occupation | Male | Female |
| Management | 8 (100.0%) | 0 (0.0%) |
| Business & Financial | 6 (20.0%) | 24 (80.0%) |
| Computers, Engineering & Science | 22 (100.0%) | 0 (0.0%) |
| Computers & Mathematics | 0 (0.0%) | 0 (0.0%) |
| Architecture & Engineering | 13 (100.0%) | 0 (0.0%) |
| Life, Physical & Social Science | 9 (100.0%) | 0 (0.0%) |
| Community & Social Service | 27 (45.0%) | 33 (55.0%) |
| Education, Arts & Media | 19 (76.0%) | 6 (24.0%) |
| Legal Services & Support | 0 (0.0%) | 3 (100.0%) |
| Education Instruction & Library | 8 (25.0%) | 24 (75.0%) |
| Arts, Media & Entertainment | 0 (0.0%) | 0 (0.0%) |
| Health Diagnosing & Treating | 0 (0.0%) | 66 (100.0%) |
| Health Technologists | 0 (0.0%) | 57 (100.0%) |
| Total (Category) | 63 (33.9%) | 123 (66.1%) |
| Total (Overall) | 581 (63.4%) | 336 (36.6%) |
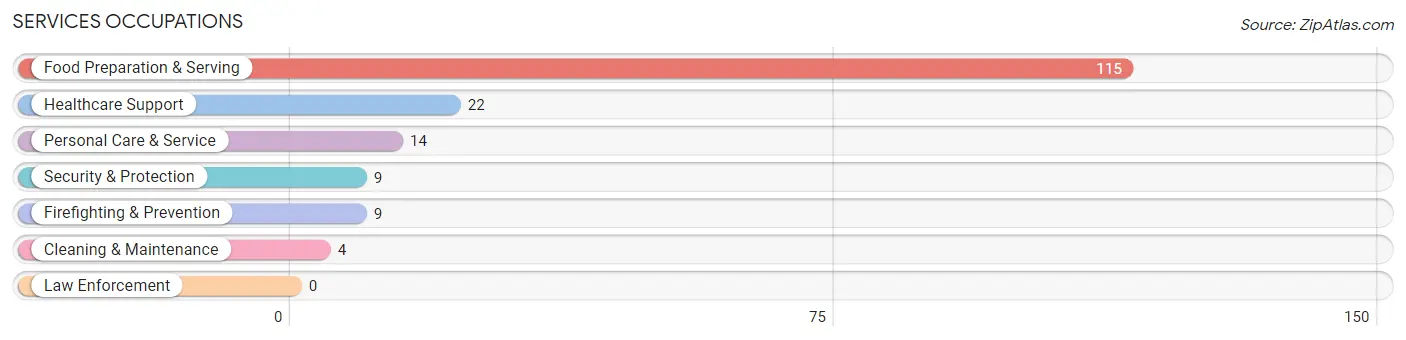
Services Occupations
The most common Services occupations in Bald Knob are Food Preparation & Serving (115 | 12.5%), Healthcare Support (22 | 2.4%), Personal Care & Service (14 | 1.5%), Security & Protection (9 | 1.0%), and Firefighting & Prevention (9 | 1.0%).
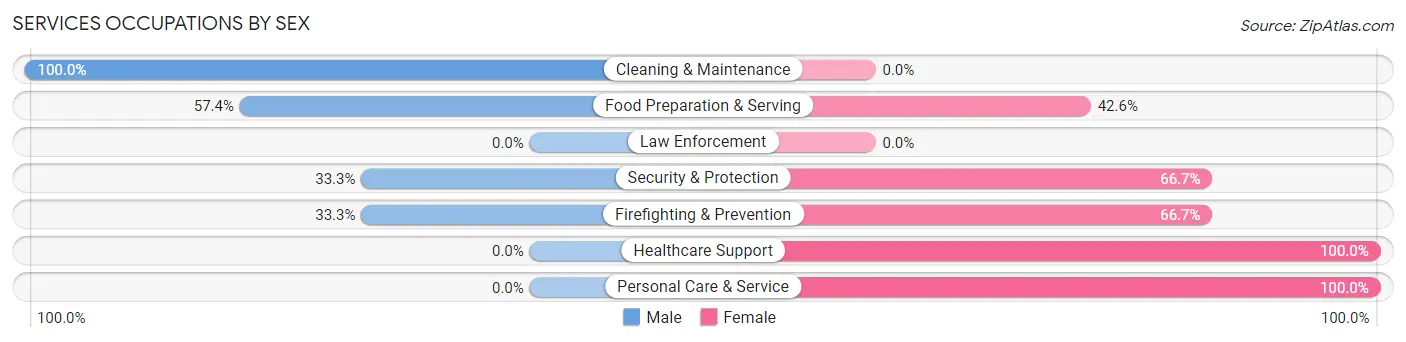
Services Occupations by Sex
Within the Services occupations in Bald Knob, the most male-oriented occupations are Cleaning & Maintenance (100.0%), Food Preparation & Serving (57.4%), and Security & Protection (33.3%), while the most female-oriented occupations are Healthcare Support (100.0%), Personal Care & Service (100.0%), and Security & Protection (66.7%).
| Occupation | Male | Female |
| Healthcare Support | 0 (0.0%) | 22 (100.0%) |
| Security & Protection | 3 (33.3%) | 6 (66.7%) |
| Firefighting & Prevention | 3 (33.3%) | 6 (66.7%) |
| Law Enforcement | 0 (0.0%) | 0 (0.0%) |
| Food Preparation & Serving | 66 (57.4%) | 49 (42.6%) |
| Cleaning & Maintenance | 4 (100.0%) | 0 (0.0%) |
| Personal Care & Service | 0 (0.0%) | 14 (100.0%) |
| Total (Category) | 73 (44.5%) | 91 (55.5%) |
| Total (Overall) | 581 (63.4%) | 336 (36.6%) |
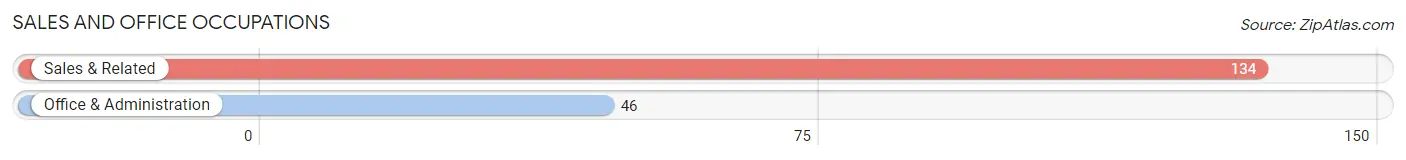
Sales and Office Occupations
The most common Sales and Office occupations in Bald Knob are Sales & Related (134 | 14.6%), and Office & Administration (46 | 5.0%).
Sales and Office Occupations by Sex
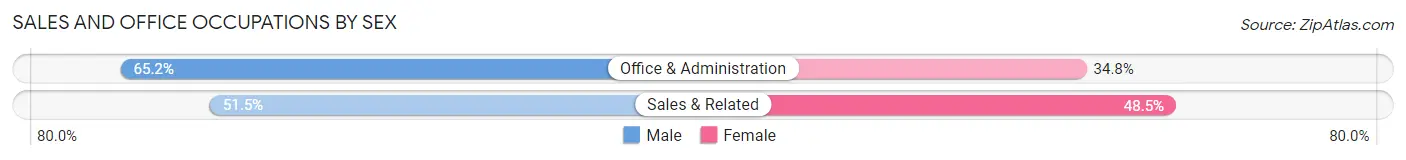
| Occupation | Male | Female |
| Sales & Related | 69 (51.5%) | 65 (48.5%) |
| Office & Administration | 30 (65.2%) | 16 (34.8%) |
| Total (Category) | 99 (55.0%) | 81 (45.0%) |
| Total (Overall) | 581 (63.4%) | 336 (36.6%) |
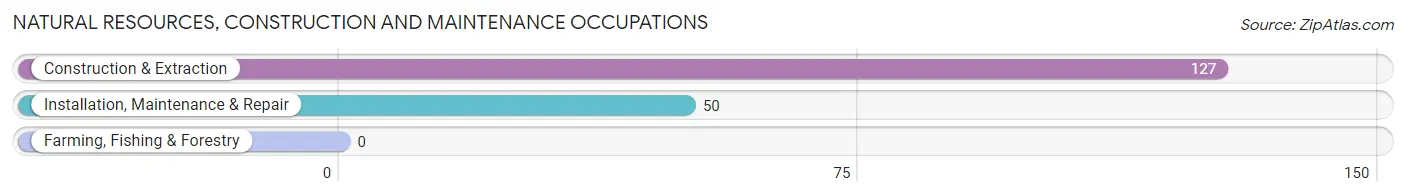
Natural Resources, Construction and Maintenance Occupations
The most common Natural Resources, Construction and Maintenance occupations in Bald Knob are Construction & Extraction (127 | 13.9%), and Installation, Maintenance & Repair (50 | 5.4%).
Natural Resources, Construction and Maintenance Occupations by Sex
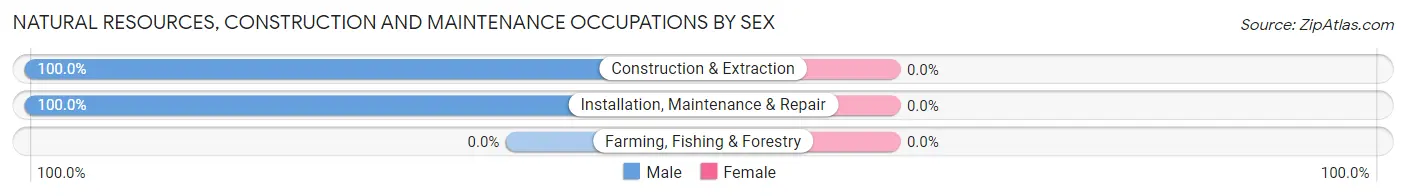
| Occupation | Male | Female |
| Farming, Fishing & Forestry | 0 (0.0%) | 0 (0.0%) |
| Construction & Extraction | 127 (100.0%) | 0 (0.0%) |
| Installation, Maintenance & Repair | 50 (100.0%) | 0 (0.0%) |
| Total (Category) | 177 (100.0%) | 0 (0.0%) |
| Total (Overall) | 581 (63.4%) | 336 (36.6%) |
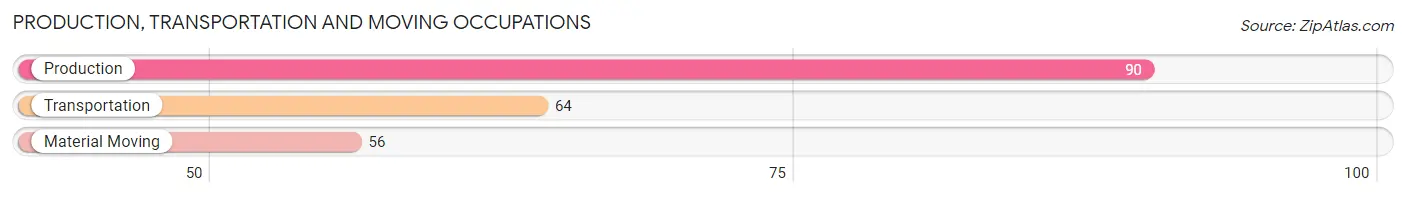
Production, Transportation and Moving Occupations
The most common Production, Transportation and Moving occupations in Bald Knob are Production (90 | 9.8%), Transportation (64 | 7.0%), and Material Moving (56 | 6.1%).
Production, Transportation and Moving Occupations by Sex
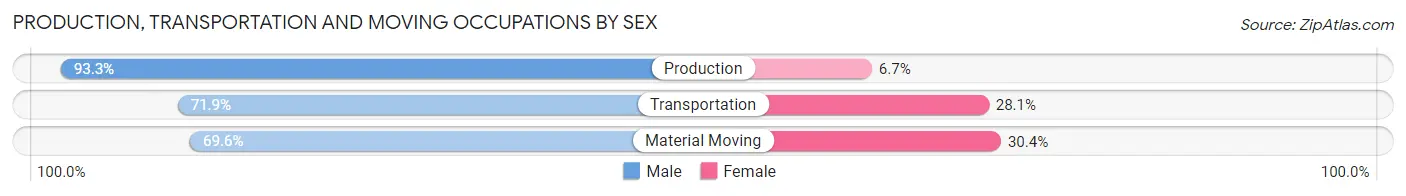
| Occupation | Male | Female |
| Production | 84 (93.3%) | 6 (6.7%) |
| Transportation | 46 (71.9%) | 18 (28.1%) |
| Material Moving | 39 (69.6%) | 17 (30.4%) |
| Total (Category) | 169 (80.5%) | 41 (19.5%) |
| Total (Overall) | 581 (63.4%) | 336 (36.6%) |
Employment Industries by Sex in Bald Knob
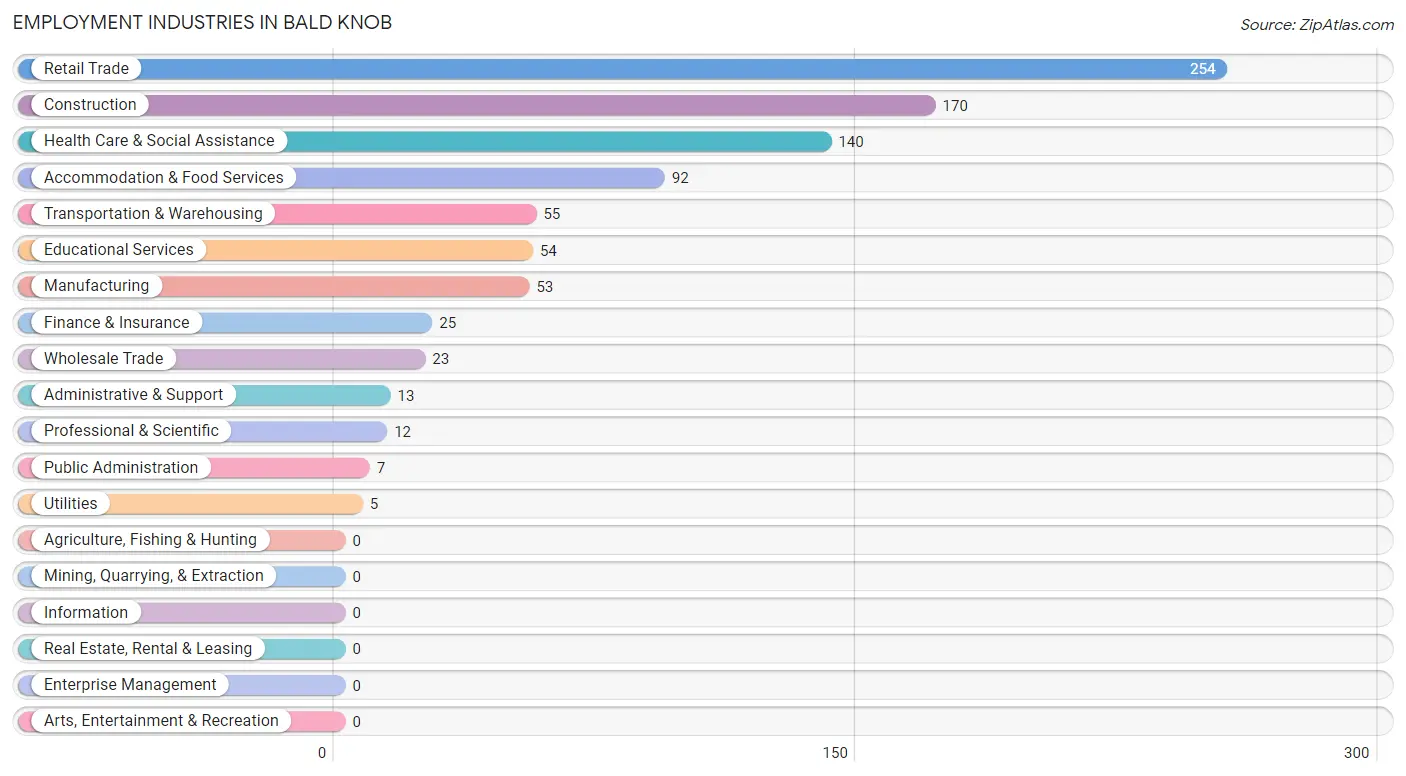
Employment Industries in Bald Knob
The major employment industries in Bald Knob include Retail Trade (254 | 27.7%), Construction (170 | 18.5%), Health Care & Social Assistance (140 | 15.3%), Accommodation & Food Services (92 | 10.0%), and Transportation & Warehousing (55 | 6.0%).
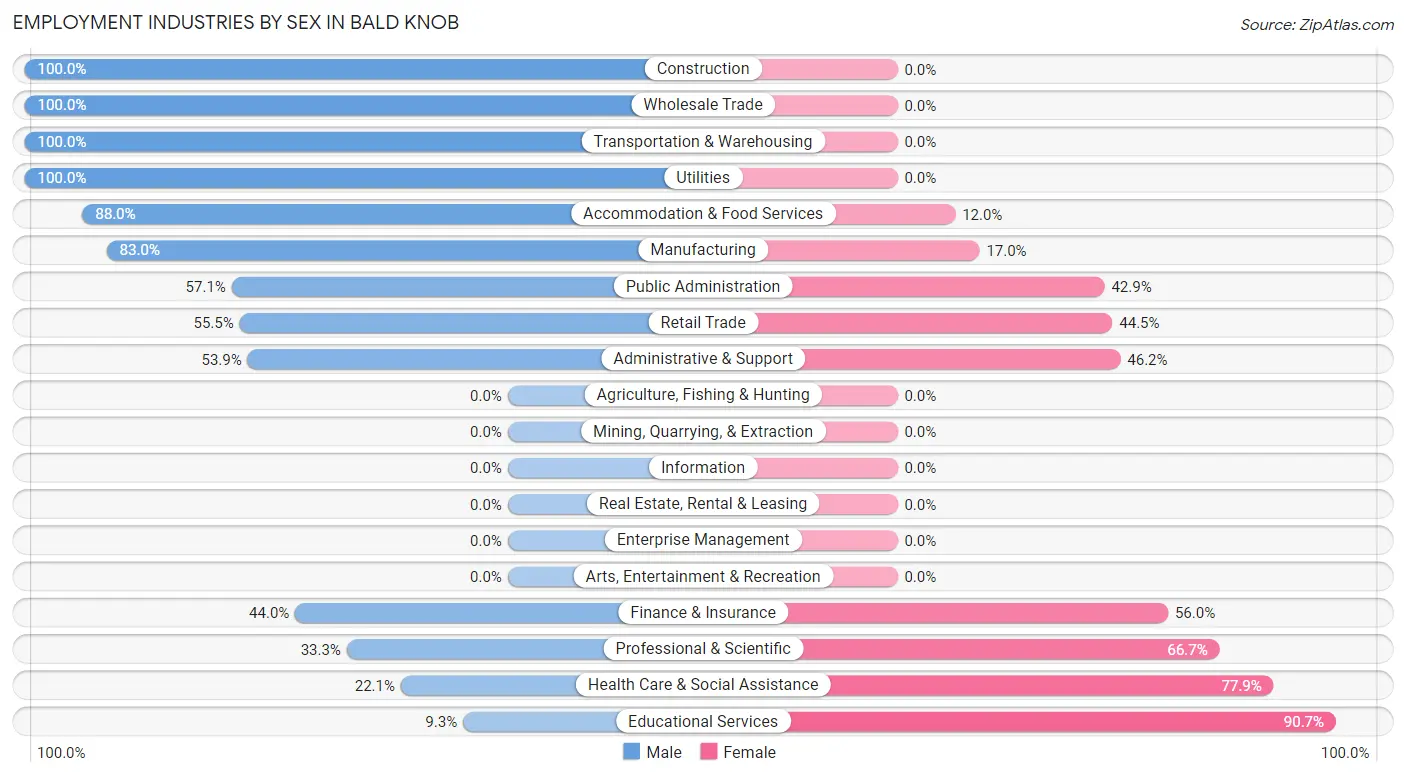
Employment Industries by Sex in Bald Knob
The Bald Knob industries that see more men than women are Construction (100.0%), Wholesale Trade (100.0%), and Transportation & Warehousing (100.0%), whereas the industries that tend to have a higher number of women are Educational Services (90.7%), Health Care & Social Assistance (77.9%), and Professional & Scientific (66.7%).
| Industry | Male | Female |
| Agriculture, Fishing & Hunting | 0 (0.0%) | 0 (0.0%) |
| Mining, Quarrying, & Extraction | 0 (0.0%) | 0 (0.0%) |
| Construction | 170 (100.0%) | 0 (0.0%) |
| Manufacturing | 44 (83.0%) | 9 (17.0%) |
| Wholesale Trade | 23 (100.0%) | 0 (0.0%) |
| Retail Trade | 141 (55.5%) | 113 (44.5%) |
| Transportation & Warehousing | 55 (100.0%) | 0 (0.0%) |
| Utilities | 5 (100.0%) | 0 (0.0%) |
| Information | 0 (0.0%) | 0 (0.0%) |
| Finance & Insurance | 11 (44.0%) | 14 (56.0%) |
| Real Estate, Rental & Leasing | 0 (0.0%) | 0 (0.0%) |
| Professional & Scientific | 4 (33.3%) | 8 (66.7%) |
| Enterprise Management | 0 (0.0%) | 0 (0.0%) |
| Administrative & Support | 7 (53.8%) | 6 (46.2%) |
| Educational Services | 5 (9.3%) | 49 (90.7%) |
| Health Care & Social Assistance | 31 (22.1%) | 109 (77.9%) |
| Arts, Entertainment & Recreation | 0 (0.0%) | 0 (0.0%) |
| Accommodation & Food Services | 81 (88.0%) | 11 (12.0%) |
| Public Administration | 4 (57.1%) | 3 (42.9%) |
| Total | 581 (63.4%) | 336 (36.6%) |
Education in Bald Knob
School Enrollment in Bald Knob
The most common levels of schooling among the 723 students in Bald Knob are middle school (260 | 36.0%), high school (191 | 26.4%), and elementary school (134 | 18.5%).
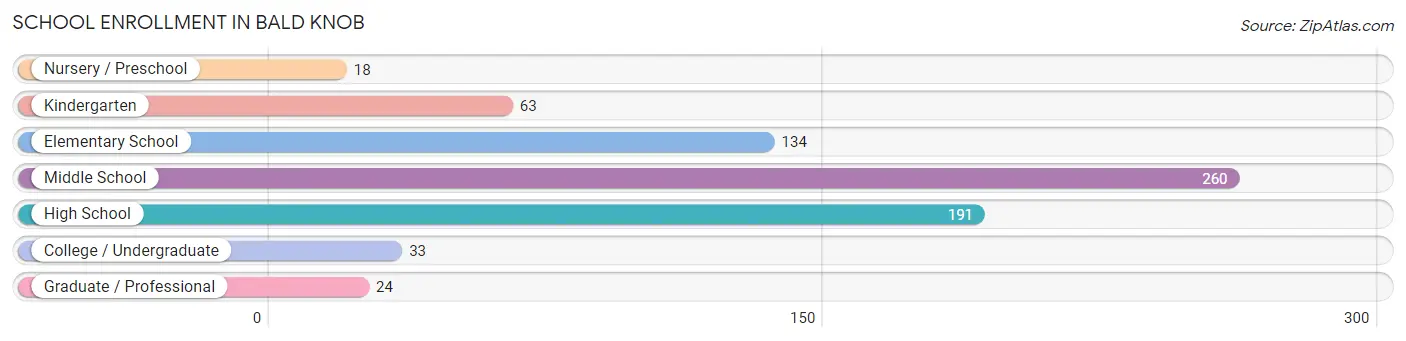
| School Level | # Students | % Students |
| Nursery / Preschool | 18 | 2.5% |
| Kindergarten | 63 | 8.7% |
| Elementary School | 134 | 18.5% |
| Middle School | 260 | 36.0% |
| High School | 191 | 26.4% |
| College / Undergraduate | 33 | 4.6% |
| Graduate / Professional | 24 | 3.3% |
| Total | 723 | 100.0% |
School Enrollment by Age by Funding Source in Bald Knob
Out of a total of 723 students who are enrolled in schools in Bald Knob, 95 (13.1%) attend a private institution, while the remaining 628 (86.9%) are enrolled in public schools. The age group of 35 years and over has the highest likelihood of being enrolled in private schools, with 18 (62.1% in the age bracket) enrolled. Conversely, the age group of 20 to 24 year olds has the lowest likelihood of being enrolled in a private school, with 15 (100.0% in the age bracket) attending a public institution.
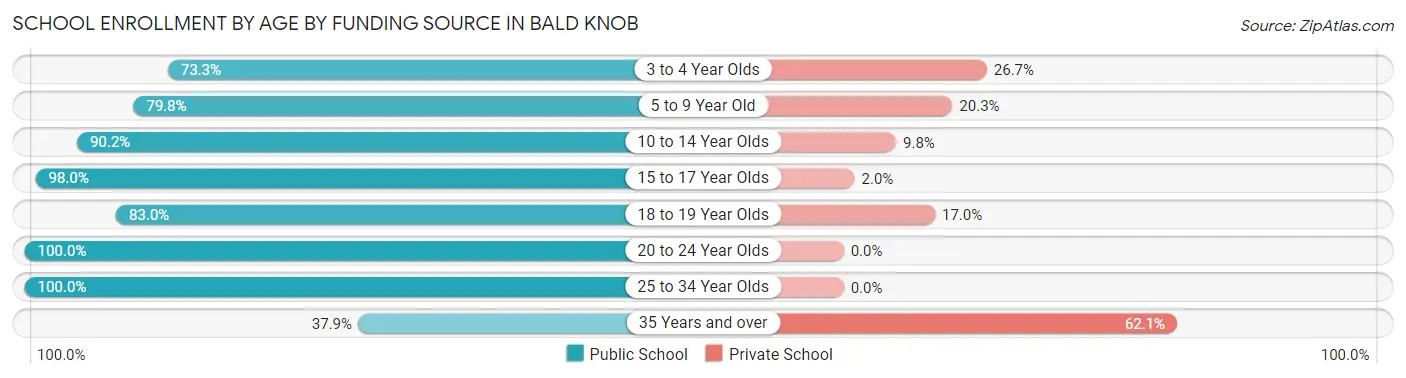
| Age Bracket | Public School | Private School |
| 3 to 4 Year Olds | 11 (73.3%) | 4 (26.7%) |
| 5 to 9 Year Old | 130 (79.7%) | 33 (20.3%) |
| 10 to 14 Year Olds | 268 (90.2%) | 29 (9.8%) |
| 15 to 17 Year Olds | 145 (98.0%) | 3 (2.0%) |
| 18 to 19 Year Olds | 39 (83.0%) | 8 (17.0%) |
| 20 to 24 Year Olds | 15 (100.0%) | 0 (0.0%) |
| 25 to 34 Year Olds | 9 (100.0%) | 0 (0.0%) |
| 35 Years and over | 11 (37.9%) | 18 (62.1%) |
| Total | 628 (86.9%) | 95 (13.1%) |
Educational Attainment by Field of Study in Bald Knob
Liberal arts & history (42 | 19.4%), bio, nature & agricultural (34 | 15.7%), engineering (31 | 14.3%), social sciences (26 | 12.0%), and science & technology (24 | 11.1%) are the most common fields of study among 216 individuals in Bald Knob who have obtained a bachelor's degree or higher.
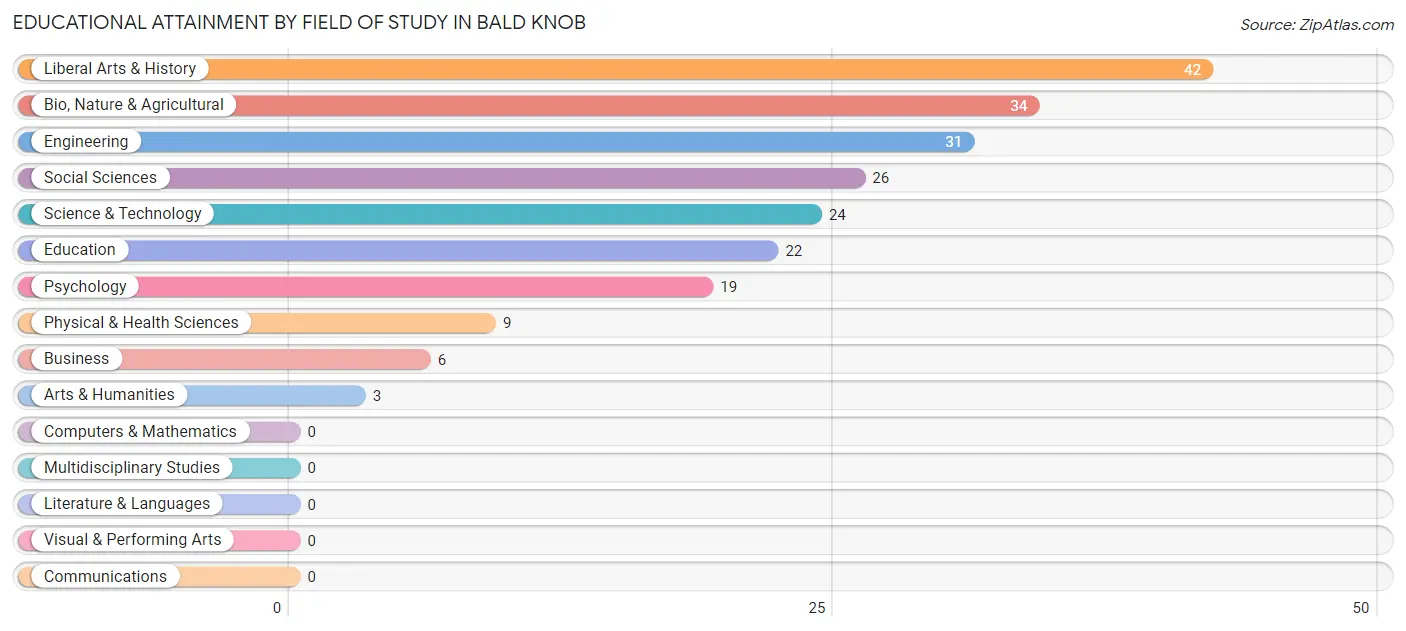
| Field of Study | # Graduates | % Graduates |
| Computers & Mathematics | 0 | 0.0% |
| Bio, Nature & Agricultural | 34 | 15.7% |
| Physical & Health Sciences | 9 | 4.2% |
| Psychology | 19 | 8.8% |
| Social Sciences | 26 | 12.0% |
| Engineering | 31 | 14.3% |
| Multidisciplinary Studies | 0 | 0.0% |
| Science & Technology | 24 | 11.1% |
| Business | 6 | 2.8% |
| Education | 22 | 10.2% |
| Literature & Languages | 0 | 0.0% |
| Liberal Arts & History | 42 | 19.4% |
| Visual & Performing Arts | 0 | 0.0% |
| Communications | 0 | 0.0% |
| Arts & Humanities | 3 | 1.4% |
| Total | 216 | 100.0% |
Transportation & Commute in Bald Knob
Vehicle Availability by Sex in Bald Knob
The most prevalent vehicle ownership categories in Bald Knob are males with 2 vehicles (218, accounting for 37.5%) and females with 2 vehicles (114, making up 64.9%).
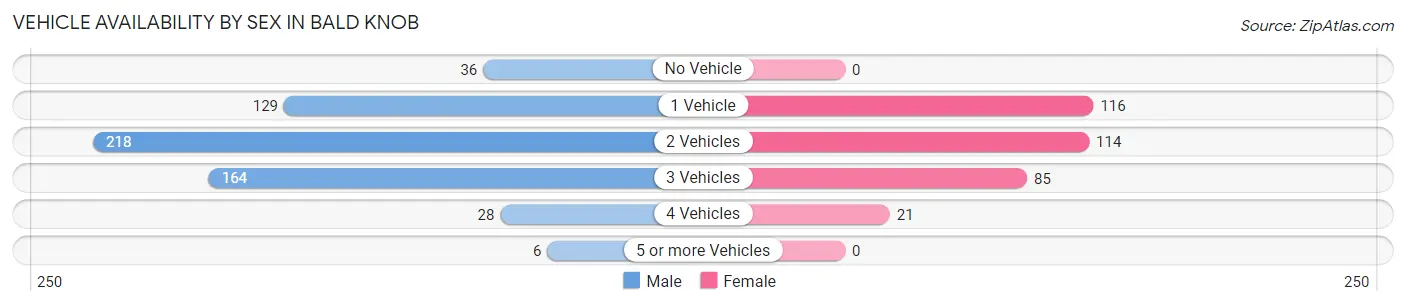
| Vehicles Available | Male | Female |
| No Vehicle | 36 (6.2%) | 0 (0.0%) |
| 1 Vehicle | 129 (22.2%) | 116 (34.5%) |
| 2 Vehicles | 218 (37.5%) | 114 (33.9%) |
| 3 Vehicles | 164 (28.2%) | 85 (25.3%) |
| 4 Vehicles | 28 (4.8%) | 21 (6.2%) |
| 5 or more Vehicles | 6 (1.0%) | 0 (0.0%) |
| Total | 581 (100.0%) | 336 (100.0%) |
Commute Time in Bald Knob
The most frequently occuring commute durations in Bald Knob are 20 to 24 minutes (204 commuters, 22.6%), 10 to 14 minutes (191 commuters, 21.1%), and 5 to 9 minutes (155 commuters, 17.2%).
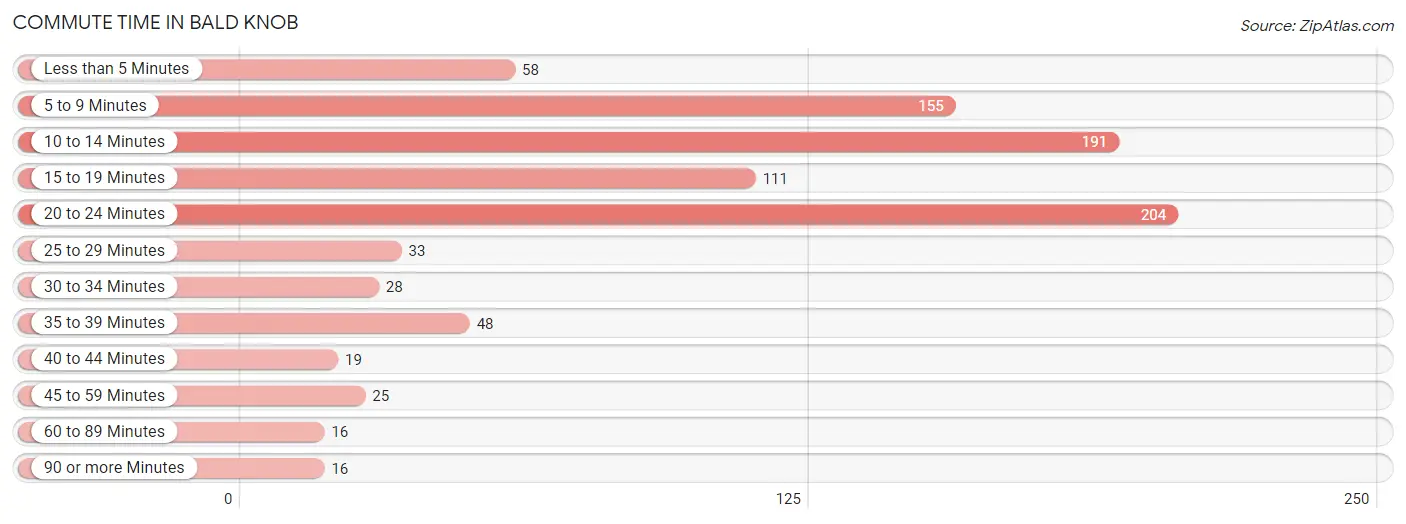
| Commute Time | # Commuters | % Commuters |
| Less than 5 Minutes | 58 | 6.4% |
| 5 to 9 Minutes | 155 | 17.2% |
| 10 to 14 Minutes | 191 | 21.1% |
| 15 to 19 Minutes | 111 | 12.3% |
| 20 to 24 Minutes | 204 | 22.6% |
| 25 to 29 Minutes | 33 | 3.6% |
| 30 to 34 Minutes | 28 | 3.1% |
| 35 to 39 Minutes | 48 | 5.3% |
| 40 to 44 Minutes | 19 | 2.1% |
| 45 to 59 Minutes | 25 | 2.8% |
| 60 to 89 Minutes | 16 | 1.8% |
| 90 or more Minutes | 16 | 1.8% |
Commute Time by Sex in Bald Knob
The most common commute times in Bald Knob are 10 to 14 minutes (141 commuters, 24.8%) for males and 20 to 24 minutes (86 commuters, 25.6%) for females.
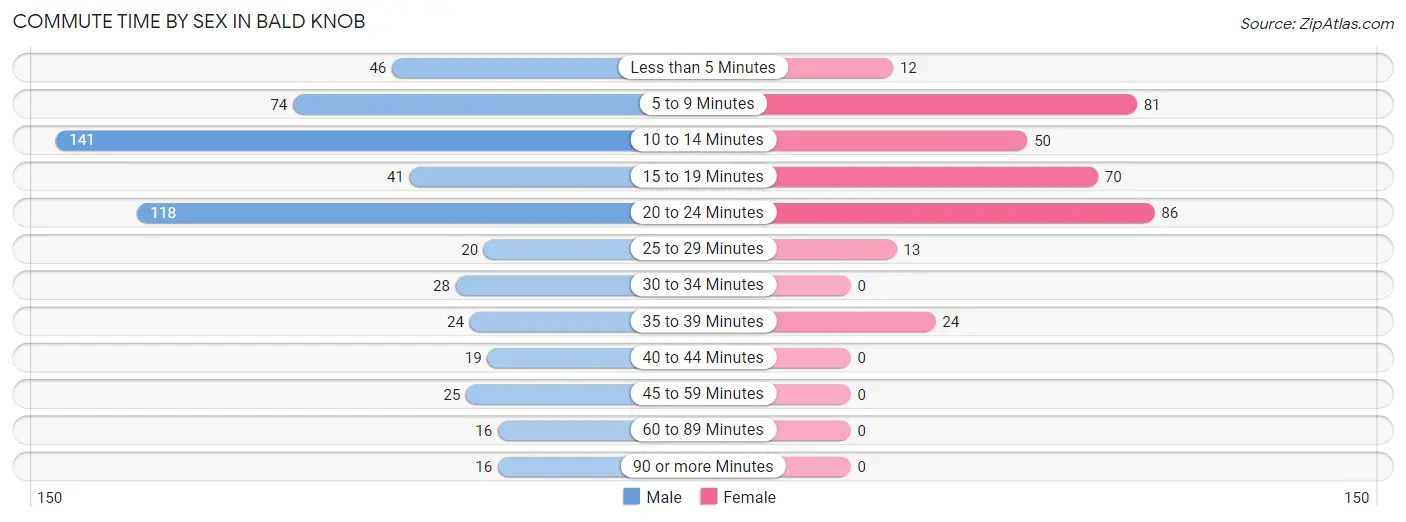
| Commute Time | Male | Female |
| Less than 5 Minutes | 46 (8.1%) | 12 (3.6%) |
| 5 to 9 Minutes | 74 (13.0%) | 81 (24.1%) |
| 10 to 14 Minutes | 141 (24.8%) | 50 (14.9%) |
| 15 to 19 Minutes | 41 (7.2%) | 70 (20.8%) |
| 20 to 24 Minutes | 118 (20.8%) | 86 (25.6%) |
| 25 to 29 Minutes | 20 (3.5%) | 13 (3.9%) |
| 30 to 34 Minutes | 28 (4.9%) | 0 (0.0%) |
| 35 to 39 Minutes | 24 (4.2%) | 24 (7.1%) |
| 40 to 44 Minutes | 19 (3.4%) | 0 (0.0%) |
| 45 to 59 Minutes | 25 (4.4%) | 0 (0.0%) |
| 60 to 89 Minutes | 16 (2.8%) | 0 (0.0%) |
| 90 or more Minutes | 16 (2.8%) | 0 (0.0%) |
Time of Departure to Work by Sex in Bald Knob
The most frequent times of departure to work in Bald Knob are 7:00 AM to 7:29 AM (147, 25.9%) for males and 7:30 AM to 7:59 AM (73, 21.7%) for females.
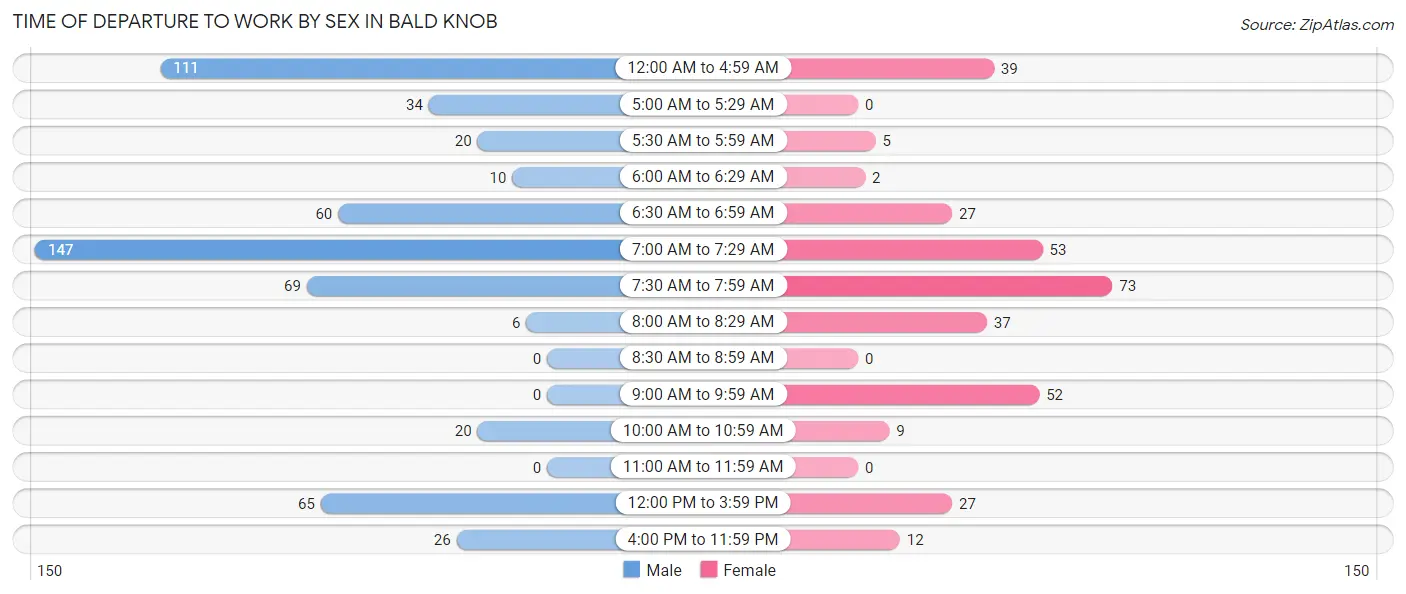
| Time of Departure | Male | Female |
| 12:00 AM to 4:59 AM | 111 (19.5%) | 39 (11.6%) |
| 5:00 AM to 5:29 AM | 34 (6.0%) | 0 (0.0%) |
| 5:30 AM to 5:59 AM | 20 (3.5%) | 5 (1.5%) |
| 6:00 AM to 6:29 AM | 10 (1.8%) | 2 (0.6%) |
| 6:30 AM to 6:59 AM | 60 (10.6%) | 27 (8.0%) |
| 7:00 AM to 7:29 AM | 147 (25.9%) | 53 (15.8%) |
| 7:30 AM to 7:59 AM | 69 (12.1%) | 73 (21.7%) |
| 8:00 AM to 8:29 AM | 6 (1.1%) | 37 (11.0%) |
| 8:30 AM to 8:59 AM | 0 (0.0%) | 0 (0.0%) |
| 9:00 AM to 9:59 AM | 0 (0.0%) | 52 (15.5%) |
| 10:00 AM to 10:59 AM | 20 (3.5%) | 9 (2.7%) |
| 11:00 AM to 11:59 AM | 0 (0.0%) | 0 (0.0%) |
| 12:00 PM to 3:59 PM | 65 (11.4%) | 27 (8.0%) |
| 4:00 PM to 11:59 PM | 26 (4.6%) | 12 (3.6%) |
| Total | 568 (100.0%) | 336 (100.0%) |
Housing Occupancy in Bald Knob
Occupancy by Ownership in Bald Knob
Of the total 923 dwellings in Bald Knob, owner-occupied units account for 498 (53.9%), while renter-occupied units make up 425 (46.1%).
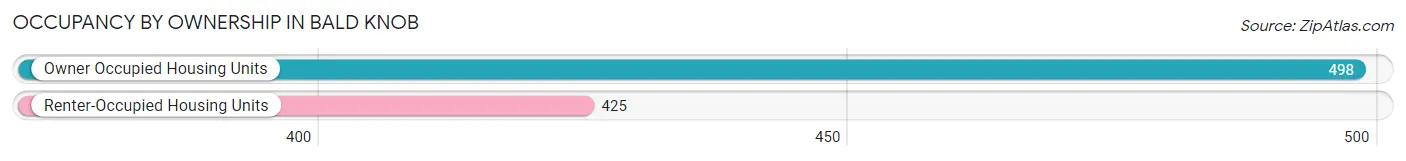
| Occupancy | # Housing Units | % Housing Units |
| Owner Occupied Housing Units | 498 | 53.9% |
| Renter-Occupied Housing Units | 425 | 46.1% |
| Total Occupied Housing Units | 923 | 100.0% |
Occupancy by Household Size in Bald Knob
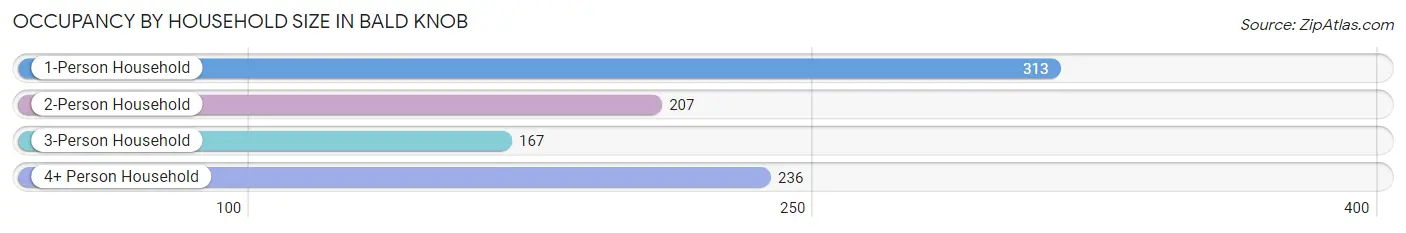
| Household Size | # Housing Units | % Housing Units |
| 1-Person Household | 313 | 33.9% |
| 2-Person Household | 207 | 22.4% |
| 3-Person Household | 167 | 18.1% |
| 4+ Person Household | 236 | 25.6% |
| Total Housing Units | 923 | 100.0% |
Occupancy by Ownership by Household Size in Bald Knob
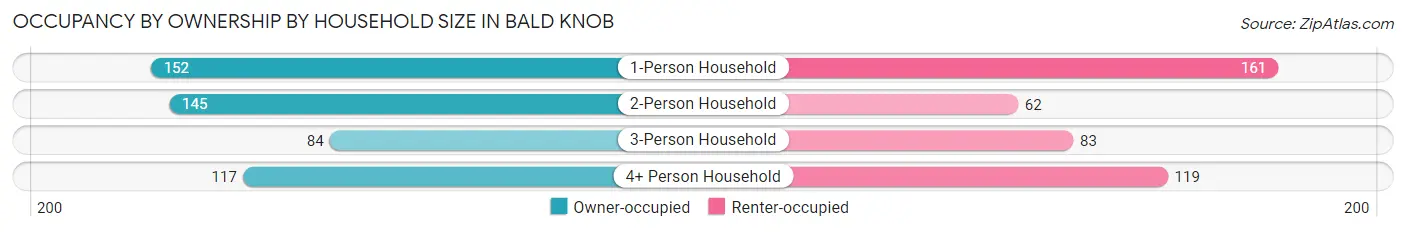
| Household Size | Owner-occupied | Renter-occupied |
| 1-Person Household | 152 (48.6%) | 161 (51.4%) |
| 2-Person Household | 145 (70.1%) | 62 (29.9%) |
| 3-Person Household | 84 (50.3%) | 83 (49.7%) |
| 4+ Person Household | 117 (49.6%) | 119 (50.4%) |
| Total Housing Units | 498 (53.9%) | 425 (46.1%) |
Occupancy by Educational Attainment in Bald Knob
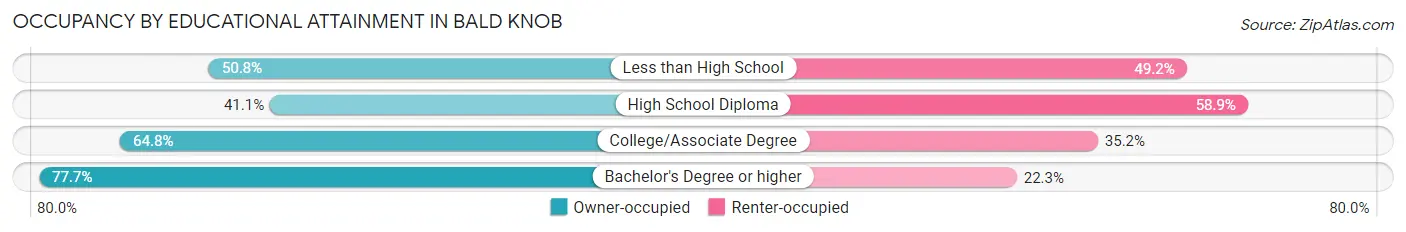
| Household Size | Owner-occupied | Renter-occupied |
| Less than High School | 66 (50.8%) | 64 (49.2%) |
| High School Diploma | 175 (41.1%) | 251 (58.9%) |
| College/Associate Degree | 142 (64.8%) | 77 (35.2%) |
| Bachelor's Degree or higher | 115 (77.7%) | 33 (22.3%) |
Occupancy by Age of Householder in Bald Knob
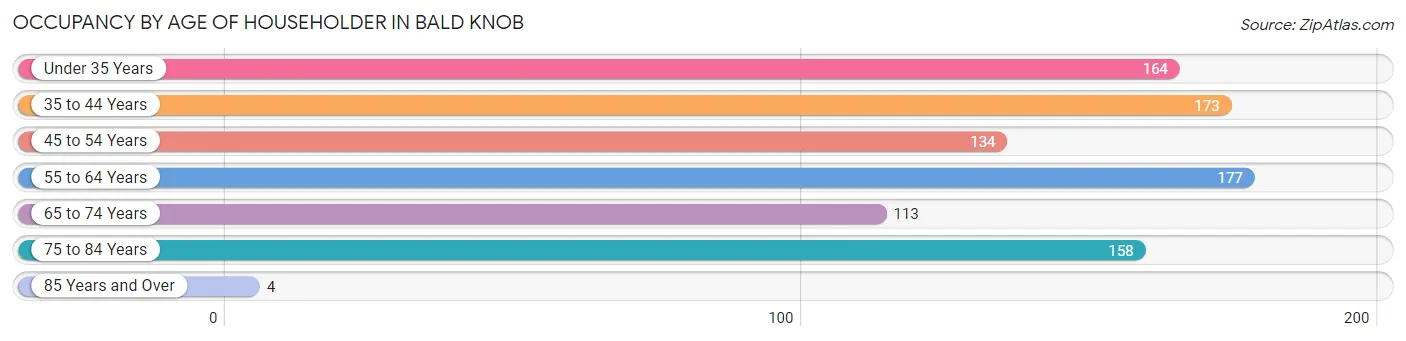
| Age Bracket | # Households | % Households |
| Under 35 Years | 164 | 17.8% |
| 35 to 44 Years | 173 | 18.7% |
| 45 to 54 Years | 134 | 14.5% |
| 55 to 64 Years | 177 | 19.2% |
| 65 to 74 Years | 113 | 12.2% |
| 75 to 84 Years | 158 | 17.1% |
| 85 Years and Over | 4 | 0.4% |
| Total | 923 | 100.0% |
Housing Finances in Bald Knob
Median Income by Occupancy in Bald Knob
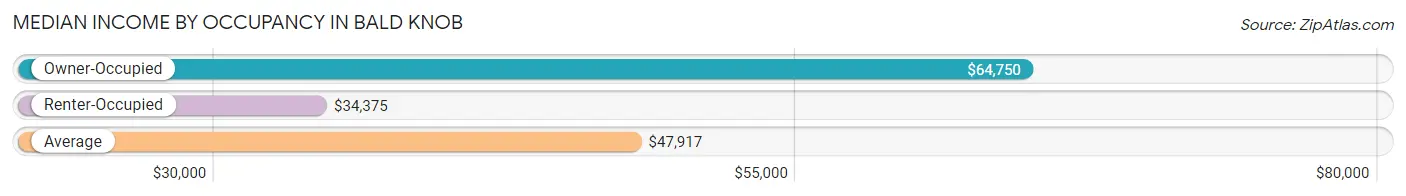
| Occupancy Type | # Households | Median Income |
| Owner-Occupied | 498 (53.9%) | $64,750 |
| Renter-Occupied | 425 (46.1%) | $34,375 |
| Average | 923 (100.0%) | $47,917 |
Occupancy by Householder Income Bracket in Bald Knob
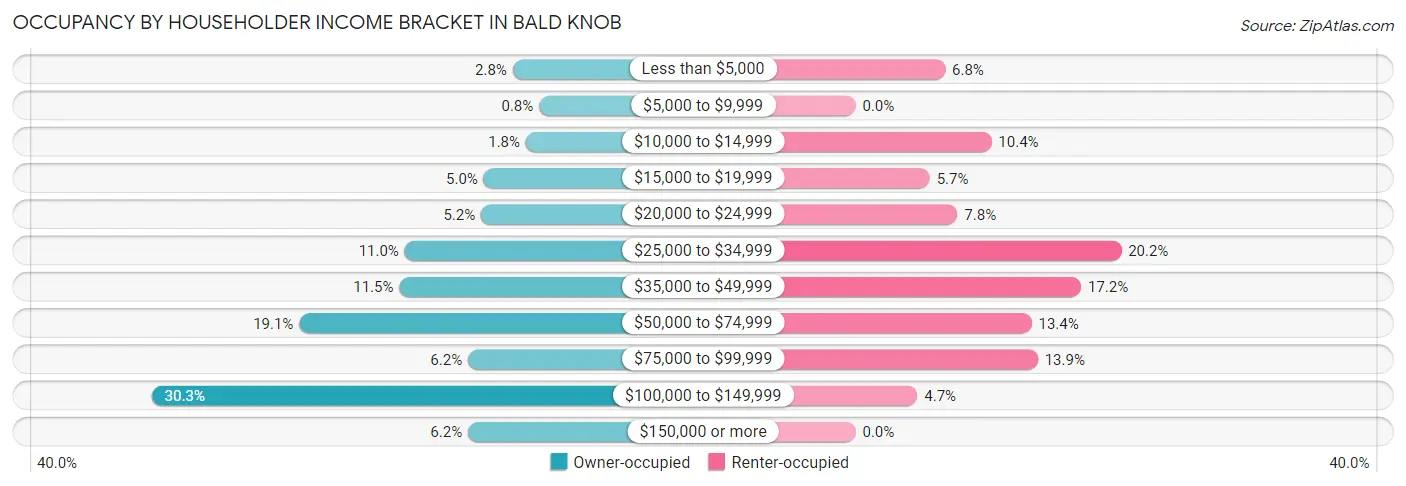
| Income Bracket | Owner-occupied | Renter-occupied |
| Less than $5,000 | 14 (2.8%) | 29 (6.8%) |
| $5,000 to $9,999 | 4 (0.8%) | 0 (0.0%) |
| $10,000 to $14,999 | 9 (1.8%) | 44 (10.3%) |
| $15,000 to $19,999 | 25 (5.0%) | 24 (5.7%) |
| $20,000 to $24,999 | 26 (5.2%) | 33 (7.8%) |
| $25,000 to $34,999 | 55 (11.0%) | 86 (20.2%) |
| $35,000 to $49,999 | 57 (11.5%) | 73 (17.2%) |
| $50,000 to $74,999 | 95 (19.1%) | 57 (13.4%) |
| $75,000 to $99,999 | 31 (6.2%) | 59 (13.9%) |
| $100,000 to $149,999 | 151 (30.3%) | 20 (4.7%) |
| $150,000 or more | 31 (6.2%) | 0 (0.0%) |
| Total | 498 (100.0%) | 425 (100.0%) |
Monthly Housing Cost Tiers in Bald Knob
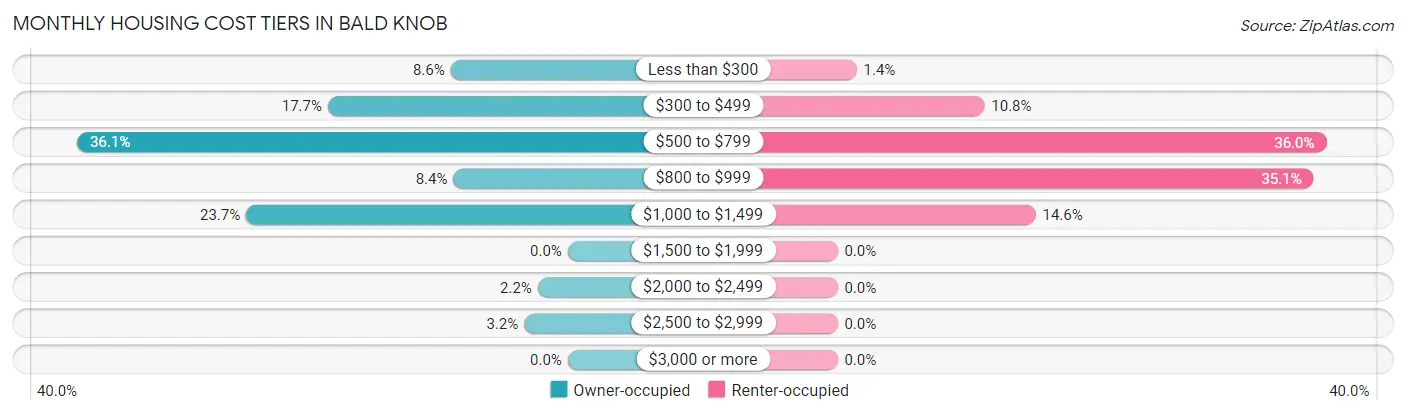
| Monthly Cost | Owner-occupied | Renter-occupied |
| Less than $300 | 43 (8.6%) | 6 (1.4%) |
| $300 to $499 | 88 (17.7%) | 46 (10.8%) |
| $500 to $799 | 180 (36.1%) | 153 (36.0%) |
| $800 to $999 | 42 (8.4%) | 149 (35.1%) |
| $1,000 to $1,499 | 118 (23.7%) | 62 (14.6%) |
| $1,500 to $1,999 | 0 (0.0%) | 0 (0.0%) |
| $2,000 to $2,499 | 11 (2.2%) | 0 (0.0%) |
| $2,500 to $2,999 | 16 (3.2%) | 0 (0.0%) |
| $3,000 or more | 0 (0.0%) | 0 (0.0%) |
| Total | 498 (100.0%) | 425 (100.0%) |
Physical Housing Characteristics in Bald Knob
Housing Structures in Bald Knob
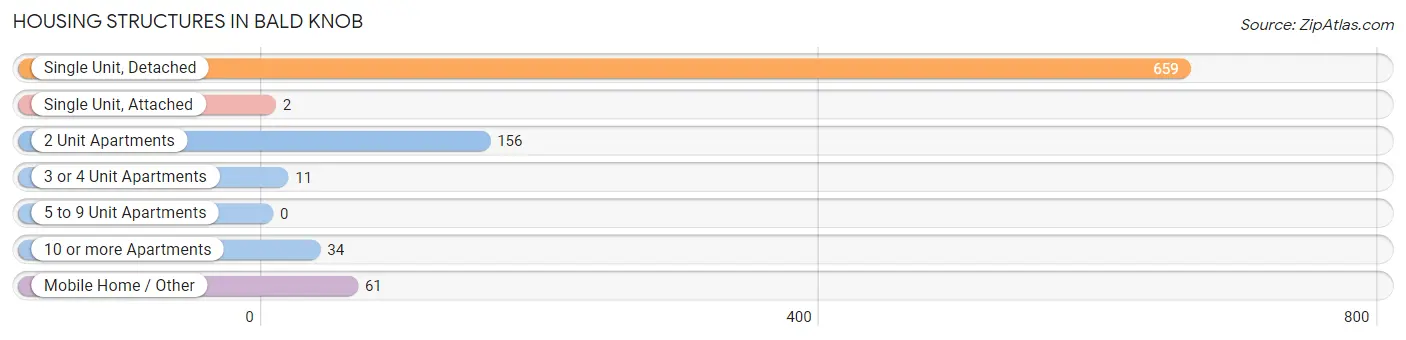
| Structure Type | # Housing Units | % Housing Units |
| Single Unit, Detached | 659 | 71.4% |
| Single Unit, Attached | 2 | 0.2% |
| 2 Unit Apartments | 156 | 16.9% |
| 3 or 4 Unit Apartments | 11 | 1.2% |
| 5 to 9 Unit Apartments | 0 | 0.0% |
| 10 or more Apartments | 34 | 3.7% |
| Mobile Home / Other | 61 | 6.6% |
| Total | 923 | 100.0% |
Housing Structures by Occupancy in Bald Knob
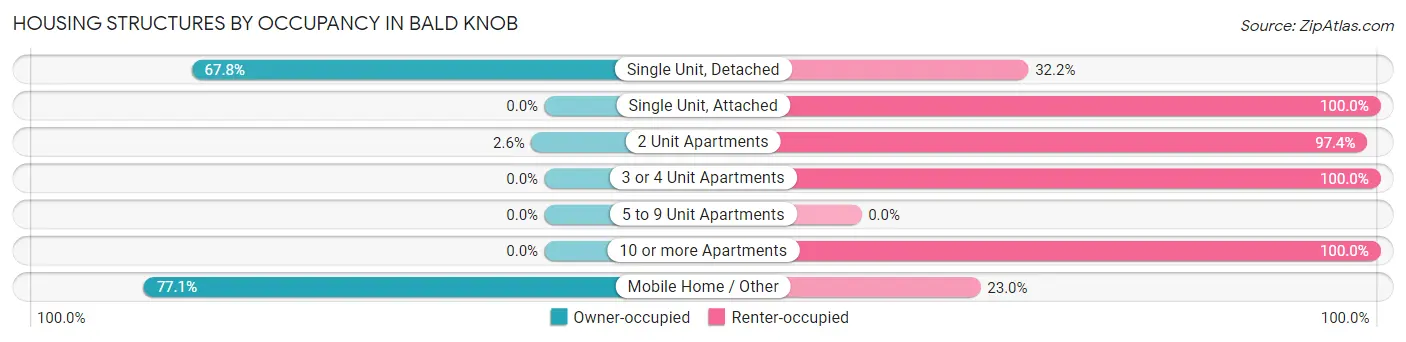
| Structure Type | Owner-occupied | Renter-occupied |
| Single Unit, Detached | 447 (67.8%) | 212 (32.2%) |
| Single Unit, Attached | 0 (0.0%) | 2 (100.0%) |
| 2 Unit Apartments | 4 (2.6%) | 152 (97.4%) |
| 3 or 4 Unit Apartments | 0 (0.0%) | 11 (100.0%) |
| 5 to 9 Unit Apartments | 0 (0.0%) | 0 (0.0%) |
| 10 or more Apartments | 0 (0.0%) | 34 (100.0%) |
| Mobile Home / Other | 47 (77.0%) | 14 (23.0%) |
| Total | 498 (53.9%) | 425 (46.1%) |
Housing Structures by Number of Rooms in Bald Knob
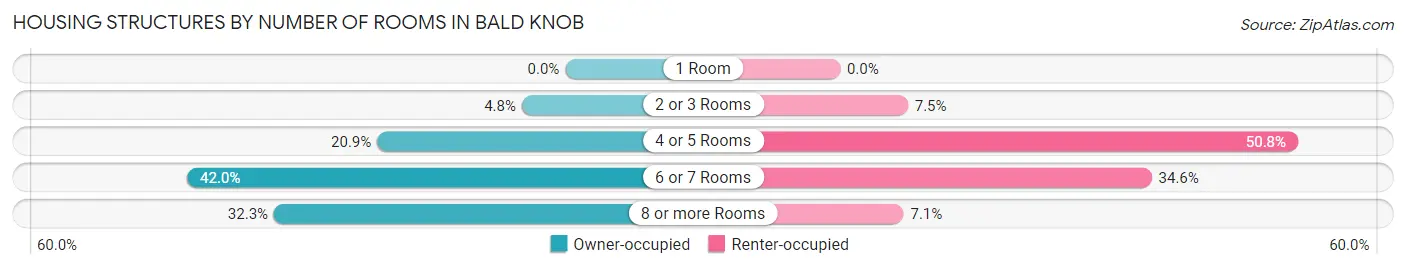
| Number of Rooms | Owner-occupied | Renter-occupied |
| 1 Room | 0 (0.0%) | 0 (0.0%) |
| 2 or 3 Rooms | 24 (4.8%) | 32 (7.5%) |
| 4 or 5 Rooms | 104 (20.9%) | 216 (50.8%) |
| 6 or 7 Rooms | 209 (42.0%) | 147 (34.6%) |
| 8 or more Rooms | 161 (32.3%) | 30 (7.1%) |
| Total | 498 (100.0%) | 425 (100.0%) |
Housing Structure by Heating Type in Bald Knob
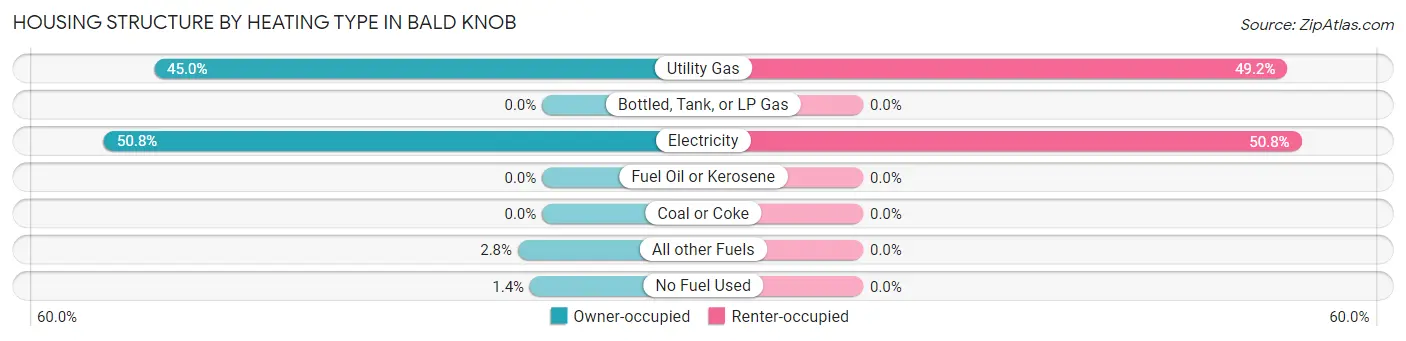
| Heating Type | Owner-occupied | Renter-occupied |
| Utility Gas | 224 (45.0%) | 209 (49.2%) |
| Bottled, Tank, or LP Gas | 0 (0.0%) | 0 (0.0%) |
| Electricity | 253 (50.8%) | 216 (50.8%) |
| Fuel Oil or Kerosene | 0 (0.0%) | 0 (0.0%) |
| Coal or Coke | 0 (0.0%) | 0 (0.0%) |
| All other Fuels | 14 (2.8%) | 0 (0.0%) |
| No Fuel Used | 7 (1.4%) | 0 (0.0%) |
| Total | 498 (100.0%) | 425 (100.0%) |
Household Vehicle Usage in Bald Knob
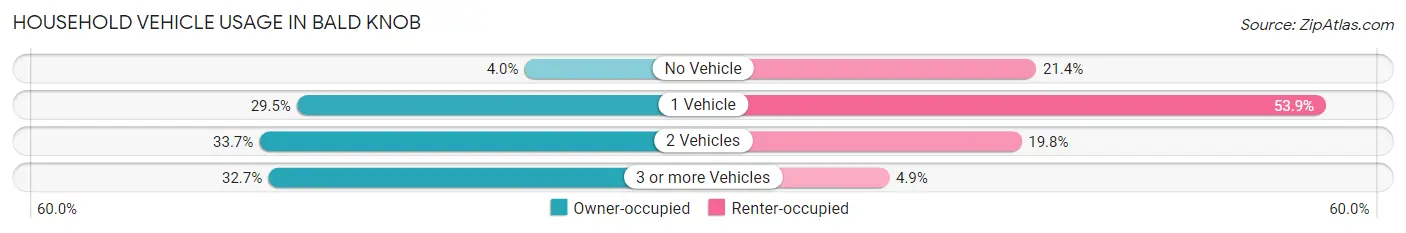
| Vehicles per Household | Owner-occupied | Renter-occupied |
| No Vehicle | 20 (4.0%) | 91 (21.4%) |
| 1 Vehicle | 147 (29.5%) | 229 (53.9%) |
| 2 Vehicles | 168 (33.7%) | 84 (19.8%) |
| 3 or more Vehicles | 163 (32.7%) | 21 (4.9%) |
| Total | 498 (100.0%) | 425 (100.0%) |
Real Estate & Mortgages in Bald Knob
Real Estate and Mortgage Overview in Bald Knob
| Characteristic | Without Mortgage | With Mortgage |
| Housing Units | 311 | 187 |
| Median Property Value | $139,500 | $131,400 |
| Median Household Income | $60,938 | $16 |
| Monthly Housing Costs | $537 | $0 |
| Real Estate Taxes | $841 | $16 |
Property Value by Mortgage Status in Bald Knob
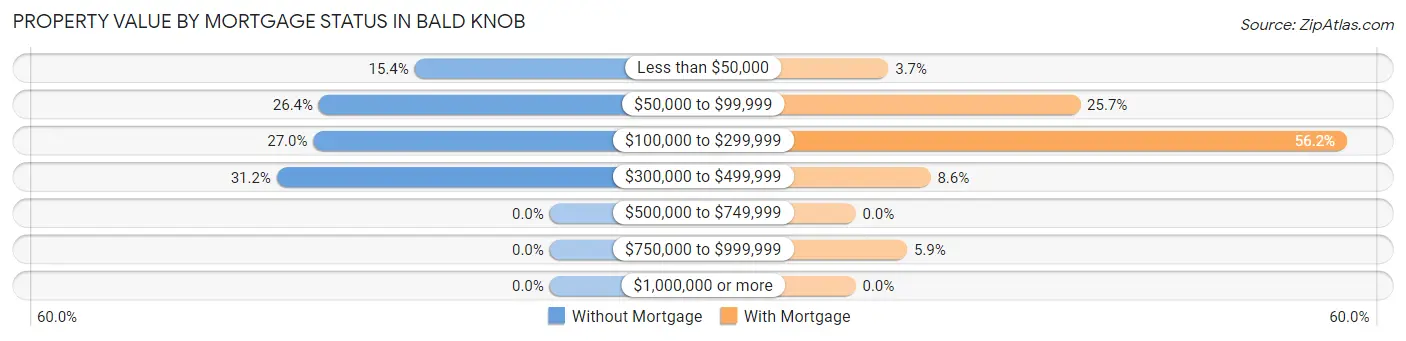
| Property Value | Without Mortgage | With Mortgage |
| Less than $50,000 | 48 (15.4%) | 7 (3.7%) |
| $50,000 to $99,999 | 82 (26.4%) | 48 (25.7%) |
| $100,000 to $299,999 | 84 (27.0%) | 105 (56.1%) |
| $300,000 to $499,999 | 97 (31.2%) | 16 (8.6%) |
| $500,000 to $749,999 | 0 (0.0%) | 0 (0.0%) |
| $750,000 to $999,999 | 0 (0.0%) | 11 (5.9%) |
| $1,000,000 or more | 0 (0.0%) | 0 (0.0%) |
| Total | 311 (100.0%) | 187 (100.0%) |
Household Income by Mortgage Status in Bald Knob
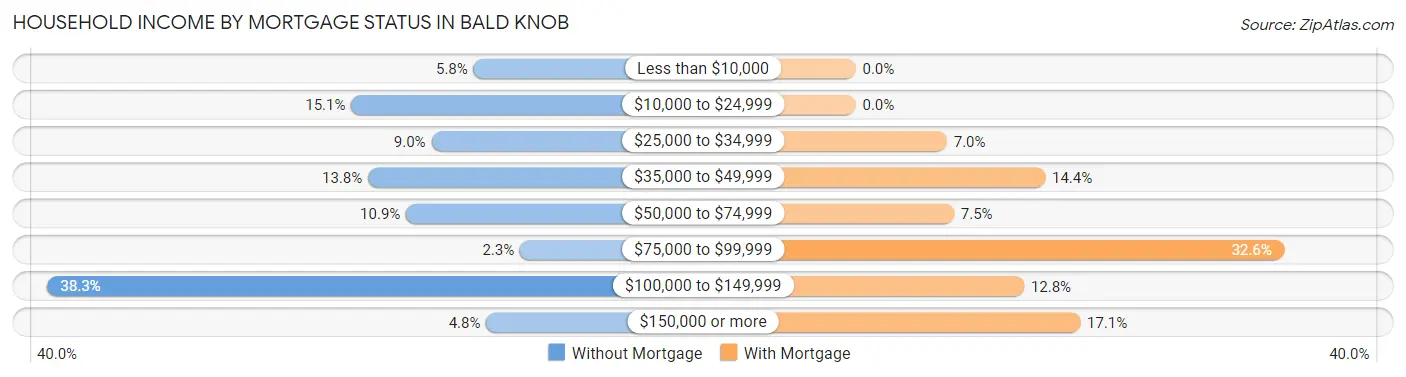
| Household Income | Without Mortgage | With Mortgage |
| Less than $10,000 | 18 (5.8%) | 0 (0.0%) |
| $10,000 to $24,999 | 47 (15.1%) | 0 (0.0%) |
| $25,000 to $34,999 | 28 (9.0%) | 13 (7.0%) |
| $35,000 to $49,999 | 43 (13.8%) | 27 (14.4%) |
| $50,000 to $74,999 | 34 (10.9%) | 14 (7.5%) |
| $75,000 to $99,999 | 7 (2.2%) | 61 (32.6%) |
| $100,000 to $149,999 | 119 (38.3%) | 24 (12.8%) |
| $150,000 or more | 15 (4.8%) | 32 (17.1%) |
| Total | 311 (100.0%) | 187 (100.0%) |
Property Value to Household Income Ratio in Bald Knob
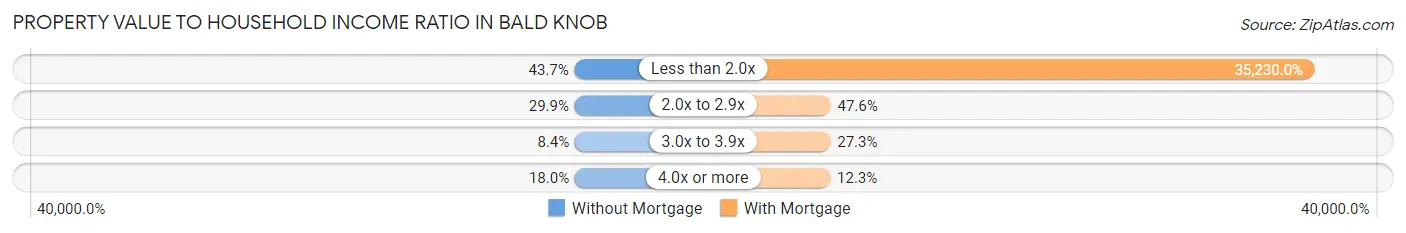
| Value-to-Income Ratio | Without Mortgage | With Mortgage |
| Less than 2.0x | 136 (43.7%) | 65,880 (35,230.0%) |
| 2.0x to 2.9x | 93 (29.9%) | 89 (47.6%) |
| 3.0x to 3.9x | 26 (8.4%) | 51 (27.3%) |
| 4.0x or more | 56 (18.0%) | 23 (12.3%) |
| Total | 311 (100.0%) | 187 (100.0%) |
Real Estate Taxes by Mortgage Status in Bald Knob
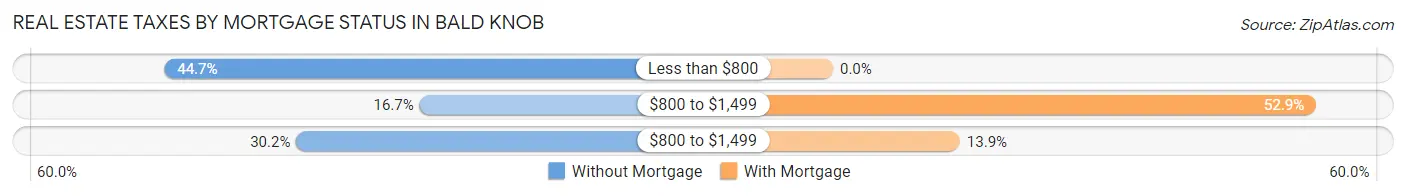
| Property Taxes | Without Mortgage | With Mortgage |
| Less than $800 | 139 (44.7%) | 0 (0.0%) |
| $800 to $1,499 | 52 (16.7%) | 99 (52.9%) |
| $800 to $1,499 | 94 (30.2%) | 26 (13.9%) |
| Total | 311 (100.0%) | 187 (100.0%) |
Health & Disability in Bald Knob
Health Insurance Coverage by Age in Bald Knob
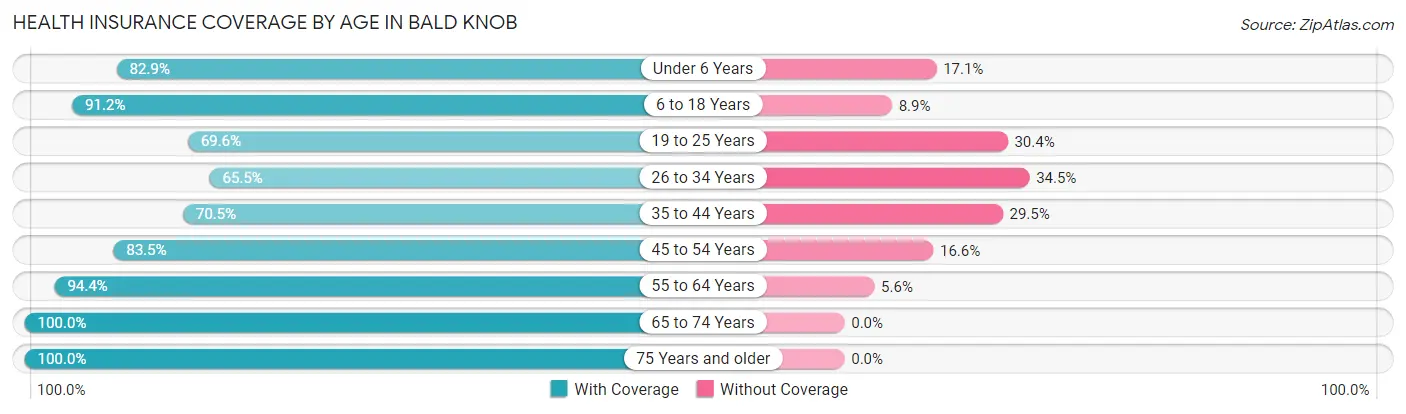
| Age Bracket | With Coverage | Without Coverage |
| Under 6 Years | 145 (82.9%) | 30 (17.1%) |
| 6 to 18 Years | 597 (91.1%) | 58 (8.8%) |
| 19 to 25 Years | 176 (69.6%) | 77 (30.4%) |
| 26 to 34 Years | 152 (65.5%) | 80 (34.5%) |
| 35 to 44 Years | 215 (70.5%) | 90 (29.5%) |
| 45 to 54 Years | 247 (83.5%) | 49 (16.6%) |
| 55 to 64 Years | 271 (94.4%) | 16 (5.6%) |
| 65 to 74 Years | 139 (100.0%) | 0 (0.0%) |
| 75 Years and older | 206 (100.0%) | 0 (0.0%) |
| Total | 2,148 (84.3%) | 400 (15.7%) |
Health Insurance Coverage by Citizenship Status in Bald Knob
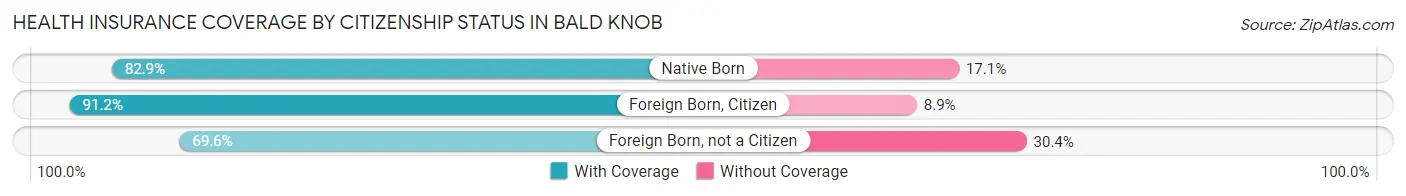
| Citizenship Status | With Coverage | Without Coverage |
| Native Born | 145 (82.9%) | 30 (17.1%) |
| Foreign Born, Citizen | 597 (91.1%) | 58 (8.8%) |
| Foreign Born, not a Citizen | 176 (69.6%) | 77 (30.4%) |
Health Insurance Coverage by Household Income in Bald Knob
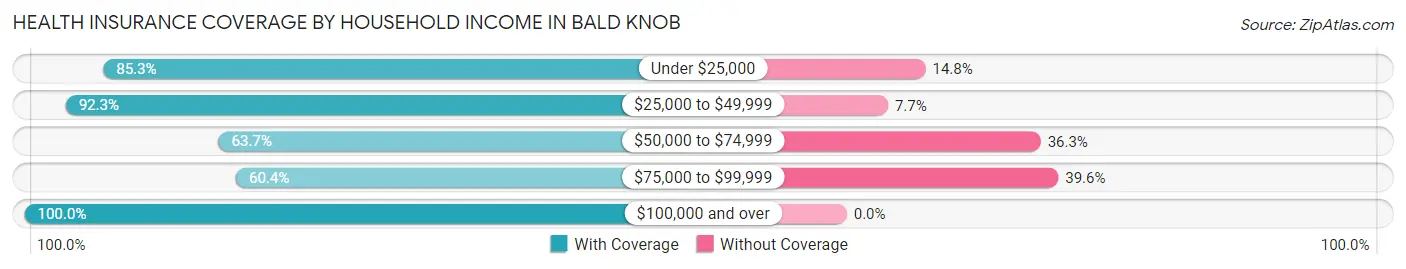
| Household Income | With Coverage | Without Coverage |
| Under $25,000 | 341 (85.3%) | 59 (14.7%) |
| $25,000 to $49,999 | 658 (92.3%) | 55 (7.7%) |
| $50,000 to $74,999 | 354 (63.7%) | 202 (36.3%) |
| $75,000 to $99,999 | 128 (60.4%) | 84 (39.6%) |
| $100,000 and over | 667 (100.0%) | 0 (0.0%) |
Public vs Private Health Insurance Coverage by Age in Bald Knob
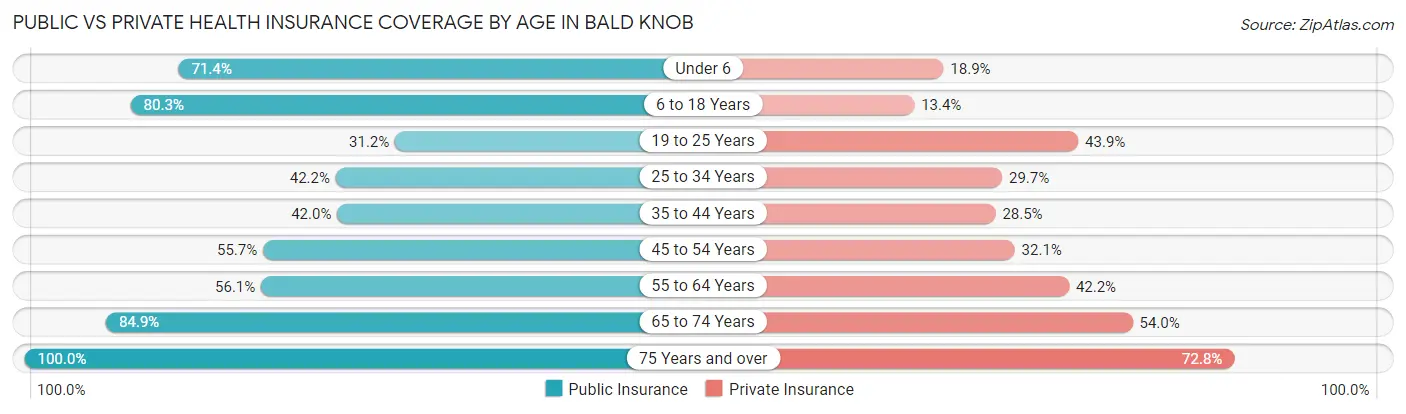
| Age Bracket | Public Insurance | Private Insurance |
| Under 6 | 125 (71.4%) | 33 (18.9%) |
| 6 to 18 Years | 526 (80.3%) | 88 (13.4%) |
| 19 to 25 Years | 79 (31.2%) | 111 (43.9%) |
| 25 to 34 Years | 98 (42.2%) | 69 (29.7%) |
| 35 to 44 Years | 128 (42.0%) | 87 (28.5%) |
| 45 to 54 Years | 165 (55.7%) | 95 (32.1%) |
| 55 to 64 Years | 161 (56.1%) | 121 (42.2%) |
| 65 to 74 Years | 118 (84.9%) | 75 (54.0%) |
| 75 Years and over | 206 (100.0%) | 150 (72.8%) |
| Total | 1,606 (63.0%) | 829 (32.5%) |
Disability Status by Sex by Age in Bald Knob
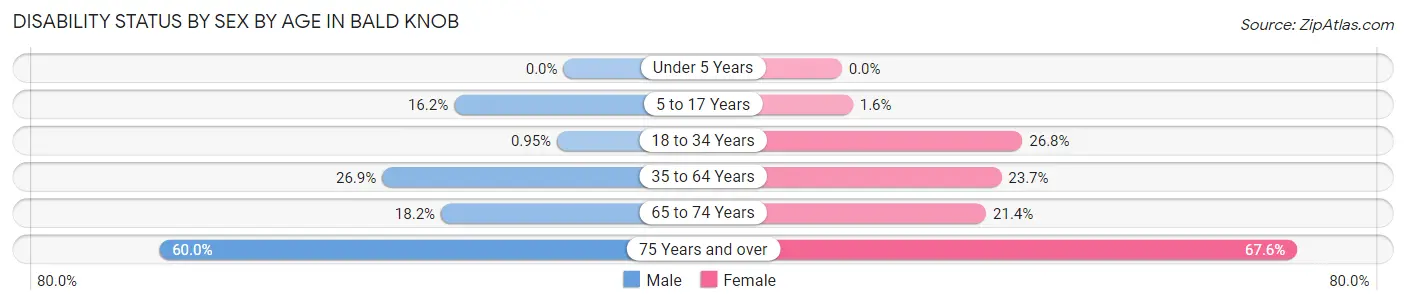
| Age Bracket | Male | Female |
| Under 5 Years | 0 (0.0%) | 0 (0.0%) |
| 5 to 17 Years | 63 (16.2%) | 4 (1.6%) |
| 18 to 34 Years | 3 (0.9%) | 63 (26.8%) |
| 35 to 64 Years | 105 (26.9%) | 118 (23.7%) |
| 65 to 74 Years | 10 (18.2%) | 18 (21.4%) |
| 75 Years and over | 81 (60.0%) | 48 (67.6%) |
Disability Class by Sex by Age in Bald Knob
Disability Class: Hearing Difficulty
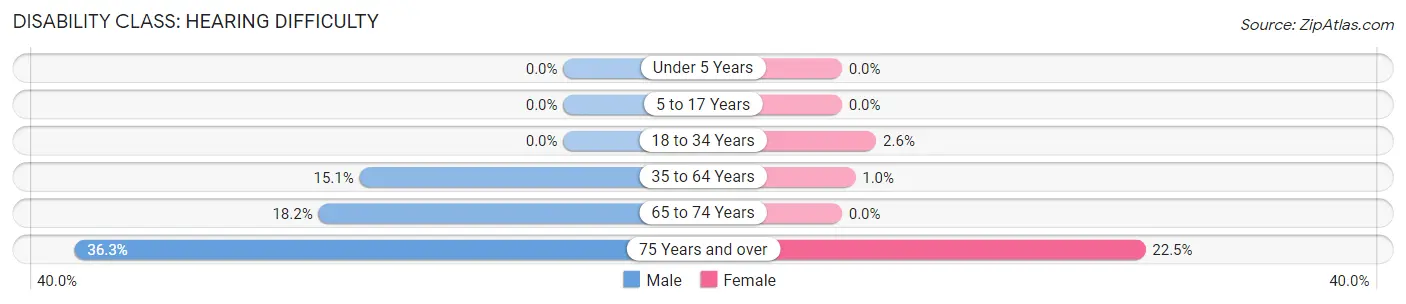
| Age Bracket | Male | Female |
| Under 5 Years | 0 (0.0%) | 0 (0.0%) |
| 5 to 17 Years | 0 (0.0%) | 0 (0.0%) |
| 18 to 34 Years | 0 (0.0%) | 6 (2.5%) |
| 35 to 64 Years | 59 (15.1%) | 5 (1.0%) |
| 65 to 74 Years | 10 (18.2%) | 0 (0.0%) |
| 75 Years and over | 49 (36.3%) | 16 (22.5%) |
Disability Class: Vision Difficulty
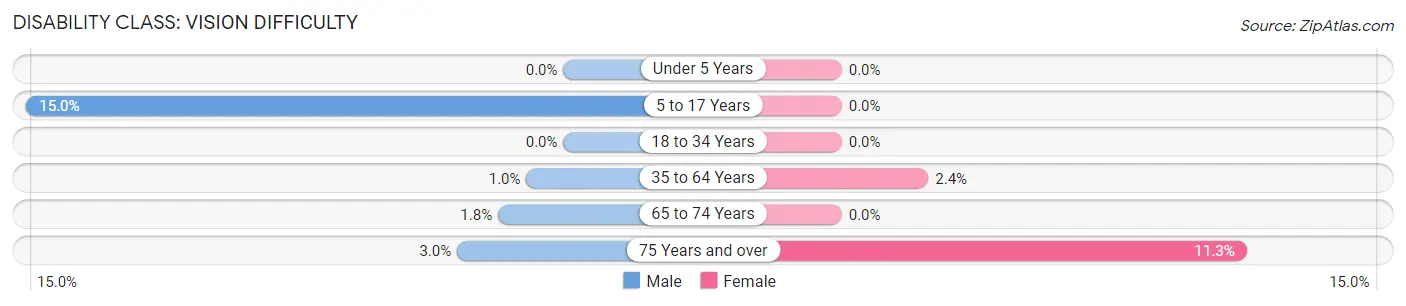
| Age Bracket | Male | Female |
| Under 5 Years | 0 (0.0%) | 0 (0.0%) |
| 5 to 17 Years | 58 (14.9%) | 0 (0.0%) |
| 18 to 34 Years | 0 (0.0%) | 0 (0.0%) |
| 35 to 64 Years | 4 (1.0%) | 12 (2.4%) |
| 65 to 74 Years | 1 (1.8%) | 0 (0.0%) |
| 75 Years and over | 4 (3.0%) | 8 (11.3%) |
Disability Class: Cognitive Difficulty
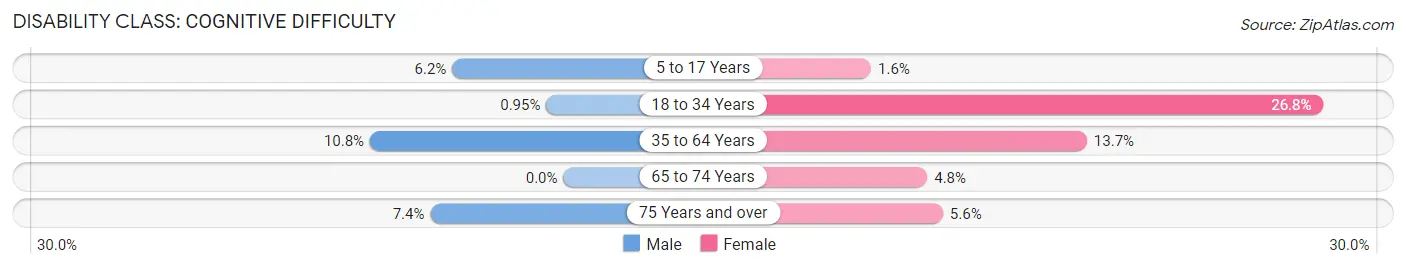
| Age Bracket | Male | Female |
| 5 to 17 Years | 24 (6.2%) | 4 (1.6%) |
| 18 to 34 Years | 3 (0.9%) | 63 (26.8%) |
| 35 to 64 Years | 42 (10.8%) | 68 (13.7%) |
| 65 to 74 Years | 0 (0.0%) | 4 (4.8%) |
| 75 Years and over | 10 (7.4%) | 4 (5.6%) |
Disability Class: Ambulatory Difficulty
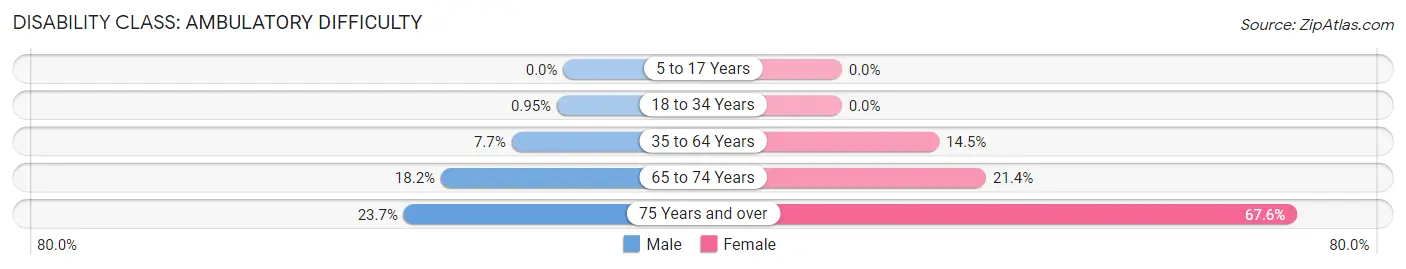
| Age Bracket | Male | Female |
| 5 to 17 Years | 0 (0.0%) | 0 (0.0%) |
| 18 to 34 Years | 3 (0.9%) | 0 (0.0%) |
| 35 to 64 Years | 30 (7.7%) | 72 (14.5%) |
| 65 to 74 Years | 10 (18.2%) | 18 (21.4%) |
| 75 Years and over | 32 (23.7%) | 48 (67.6%) |
Disability Class: Self-Care Difficulty
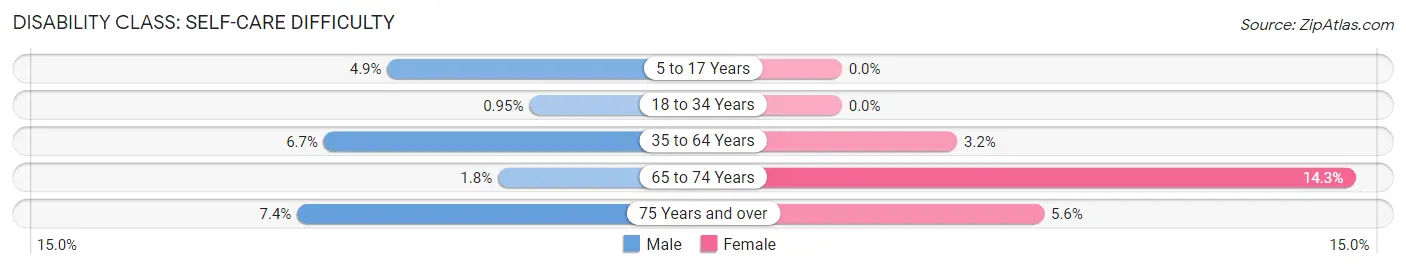
| Age Bracket | Male | Female |
| 5 to 17 Years | 19 (4.9%) | 0 (0.0%) |
| 18 to 34 Years | 3 (0.9%) | 0 (0.0%) |
| 35 to 64 Years | 26 (6.7%) | 16 (3.2%) |
| 65 to 74 Years | 1 (1.8%) | 12 (14.3%) |
| 75 Years and over | 10 (7.4%) | 4 (5.6%) |
Technology Access in Bald Knob
Computing Device Access in Bald Knob
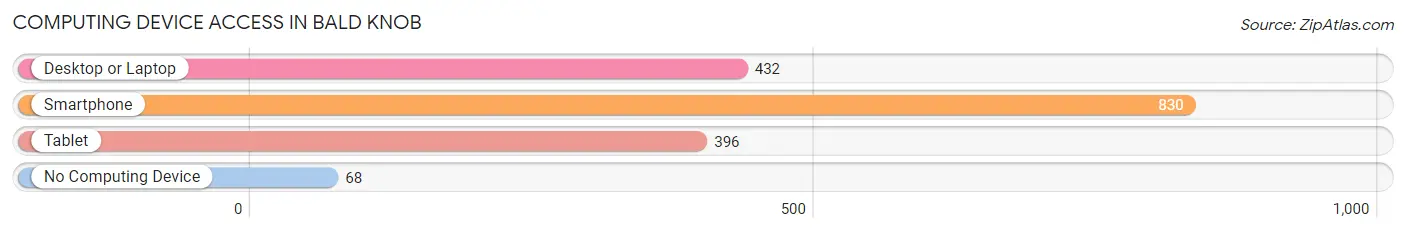
| Device Type | # Households | % Households |
| Desktop or Laptop | 432 | 46.8% |
| Smartphone | 830 | 89.9% |
| Tablet | 396 | 42.9% |
| No Computing Device | 68 | 7.4% |
| Total | 923 | 100.0% |
Internet Access in Bald Knob
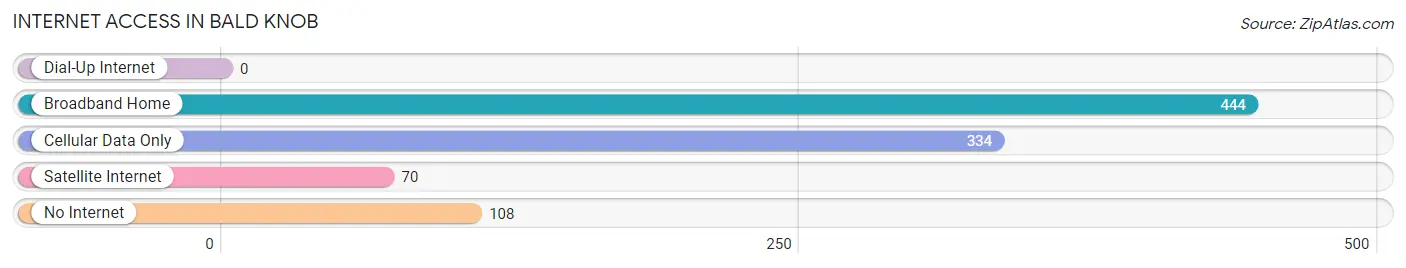
| Internet Type | # Households | % Households |
| Dial-Up Internet | 0 | 0.0% |
| Broadband Home | 444 | 48.1% |
| Cellular Data Only | 334 | 36.2% |
| Satellite Internet | 70 | 7.6% |
| No Internet | 108 | 11.7% |
| Total | 923 | 100.0% |
Bald Knob Summary
Bald Knob is a city located in White County, Arkansas, United States. The population was 2,897 at the 2010 census. It is the county seat of White County.
History
The area that is now Bald Knob was first settled in the early 1800s. The town was originally known as "Bald Hill" and was later changed to "Bald Knob" in 1881. The name was chosen because of the nearby hill that was bald and had a knob on top. The town was incorporated in 1882.
In the late 1800s, Bald Knob was a thriving agricultural community. The town was home to several cotton gins, a grist mill, and a sawmill. The town also had a railroad station, which allowed for the transportation of goods and people.
In the early 1900s, Bald Knob began to experience a decline in population. This was due to the Great Depression and the Dust Bowl. Many of the town's residents moved away in search of work.
In the late 1940s, Bald Knob experienced a resurgence in population. This was due to the construction of a new highway, which allowed for easier access to the town. The highway also brought new businesses to the area, which helped to revitalize the economy.
Geography
Bald Knob is located at 35°14'25" North, 91°37'45" West (35.240278, -91.629167). According to the United States Census Bureau, the city has a total area of 2.2 square miles (5.7 km2), all land.
Economy
Bald Knob's economy is largely based on agriculture. The town is home to several farms that produce cotton, soybeans, corn, and other crops. The town also has several businesses that provide services to the local community. These include restaurants, grocery stores, and other retail stores.
Demographics
As of the census of 2000, there were 2,845 people, 1,093 households, and 745 families residing in the city. The population density was 1,288.2 people per square mile (497.2/km2). There were 1,183 housing units at an average density of 531.2 per square mile (205.3/km2). The racial makeup of the city was 97.45% White, 0.53% Black or African American, 0.21% Native American, 0.14% Asian, 0.04% Pacific Islander, 0.53% from other races, and 0.99% from two or more races. 1.25% of the population were Hispanic or Latino of any race.
There were 1,093 households, out of which 33.2% had children under the age of 18 living with them, 51.2% were married couples living together, 13.2% had a female householder with no husband present, and 31.2% were non-families. 27.2% of all households were made up of individuals, and 14.2% had someone living alone who was 65 years of age or older. The average household size was 2.50 and the average family size was 3.02.
In the city, the population was spread out, with 25.7% under the age of 18, 8.7% from 18 to 24, 27.2% from 25 to 44, 21.7% from 45 to 64, and 16.7% who were 65 years of age or older. The median age was 37 years. For every 100 females, there were 91.2 males. For every 100 females age 18 and over, there were 86.2 males.
The median income for a household in the city was $27,917, and the median income for a family was $33,750. Males had a median income of $27,500 versus $19,375 for females. The per capita income for the city was $14,845. About 13.2% of families and 16.2% of the population were below the poverty line, including 22.2% of those under age 18 and 14.2% of those age 65 or over.
Common Questions
What is Per Capita Income in Bald Knob?
Per Capita income in Bald Knob is $23,651.
What is the Median Family Income in Bald Knob?
Median Family Income in Bald Knob is $52,578.
What is the Median Household income in Bald Knob?
Median Household Income in Bald Knob is $47,917.
What is Income or Wage Gap in Bald Knob?
Income or Wage Gap in Bald Knob is 5.4%.
Women in Bald Knob earn 94.6 cents for every dollar earned by a man.
What is Inequality or Gini Index in Bald Knob?
Inequality or Gini Index in Bald Knob is 0.42.
What is the Total Population of Bald Knob?
Total Population of Bald Knob is 2,548.
What is the Total Male Population of Bald Knob?
Total Male Population of Bald Knob is 1,369.
What is the Total Female Population of Bald Knob?
Total Female Population of Bald Knob is 1,179.
What is the Ratio of Males per 100 Females in Bald Knob?
There are 116.12 Males per 100 Females in Bald Knob.
What is the Ratio of Females per 100 Males in Bald Knob?
There are 86.12 Females per 100 Males in Bald Knob.
What is the Median Population Age in Bald Knob?
Median Population Age in Bald Knob is 33.5 Years.
What is the Average Family Size in Bald Knob
Average Family Size in Bald Knob is 3.6 People.
What is the Average Household Size in Bald Knob
Average Household Size in Bald Knob is 2.8 People.
How Large is the Labor Force in Bald Knob?
There are 983 People in the Labor Forcein in Bald Knob.
What is the Percentage of People in the Labor Force in Bald Knob?
52.2% of People are in the Labor Force in Bald Knob.
What is the Unemployment Rate in Bald Knob?
Unemployment Rate in Bald Knob is 6.7%.