Summit, AR
Summit Map
Summit Overview
555
TOTAL POPULATION
229
MALE POPULATION
326
FEMALE POPULATION
70.25
MALES / 100 FEMALES
142.36
FEMALES / 100 MALES
33.8
MEDIAN AGE
3.8
AVG FAMILY SIZE
3.5
AVG HOUSEHOLD SIZE
$22,702
PER CAPITA INCOME
$61,875
AVG FAMILY INCOME
$62,188
AVG HOUSEHOLD INCOME
0.39
INEQUALITY / GINI INDEX
277
LABOR FORCE [ PEOPLE ]
67.9%
PERCENT IN LABOR FORCE
11.9%
UNEMPLOYMENT RATE
Summit Zip Codes
Summit Area Codes
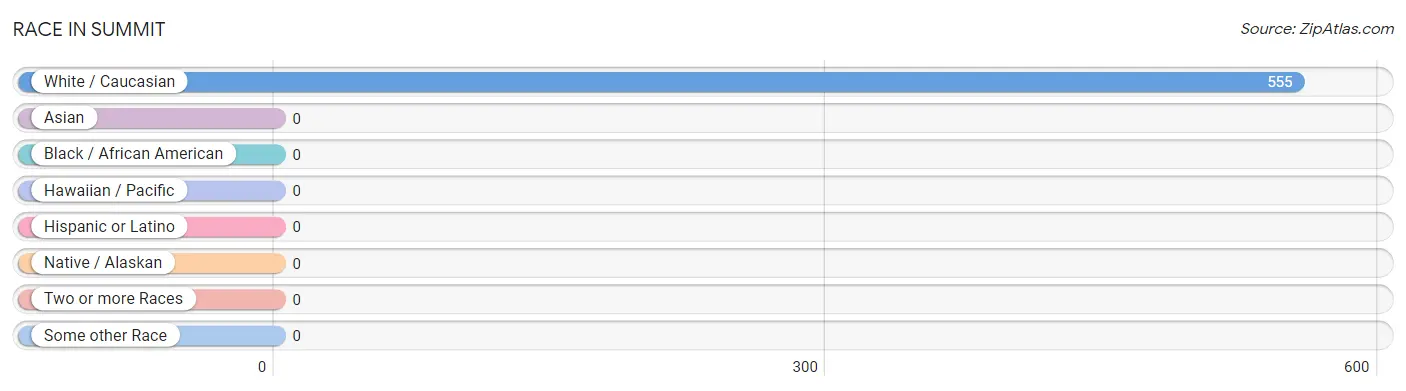
Race in Summit
The most populous races in Summit are , and White / Caucasian (555 | 100.0%).
| Race | # Population | % Population |
| Asian | 0 | 0.0% |
| Black / African American | 0 | 0.0% |
| Hawaiian / Pacific | 0 | 0.0% |
| Hispanic or Latino | 0 | 0.0% |
| Native / Alaskan | 0 | 0.0% |
| White / Caucasian | 555 | 100.0% |
| Two or more Races | 0 | 0.0% |
| Some other Race | 0 | 0.0% |
| Total | 555 | 100.0% |
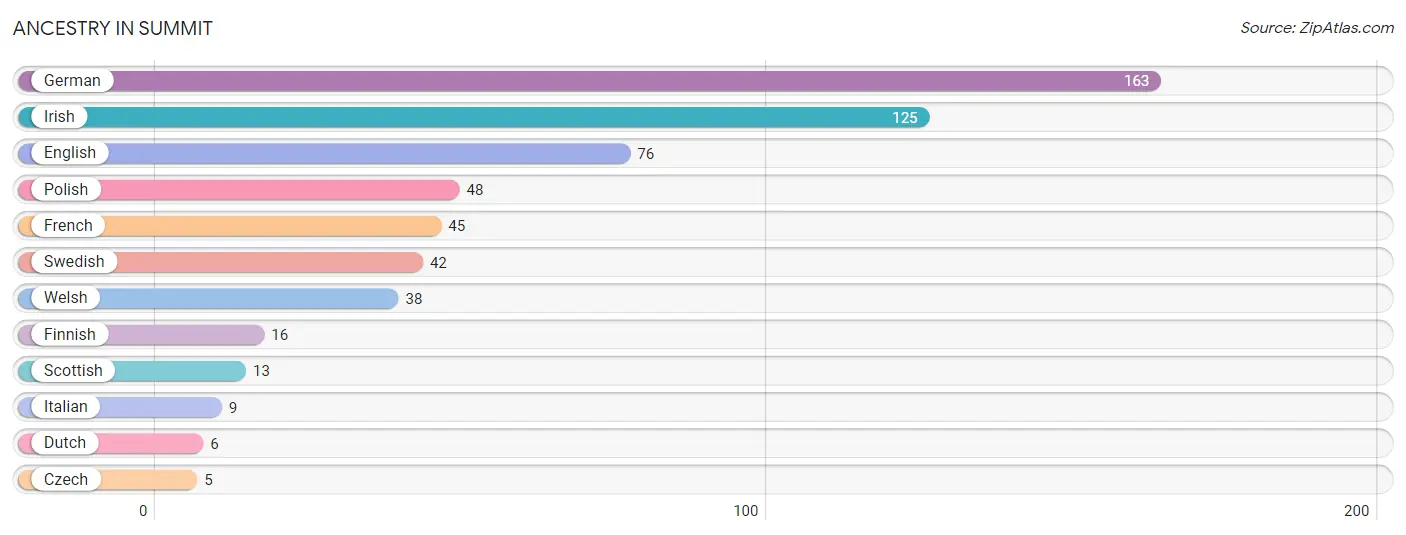
Ancestry in Summit
The most populous ancestries reported in Summit are German (163 | 29.4%), Irish (125 | 22.5%), English (76 | 13.7%), Polish (48 | 8.6%), and French (45 | 8.1%), together accounting for 82.3% of all Summit residents.
| Ancestry | # Population | % Population |
| Czech | 5 | 0.9% |
| Dutch | 6 | 1.1% |
| English | 76 | 13.7% |
| Finnish | 16 | 2.9% |
| French | 45 | 8.1% |
| German | 163 | 29.4% |
| Irish | 125 | 22.5% |
| Italian | 9 | 1.6% |
| Polish | 48 | 8.6% |
| Scottish | 13 | 2.3% |
| Swedish | 42 | 7.6% |
| Welsh | 38 | 6.9% | View All 12 Rows |
Immigrants in Summit

| Immigration Origin | # Population | % Population | View All 0 Rows |
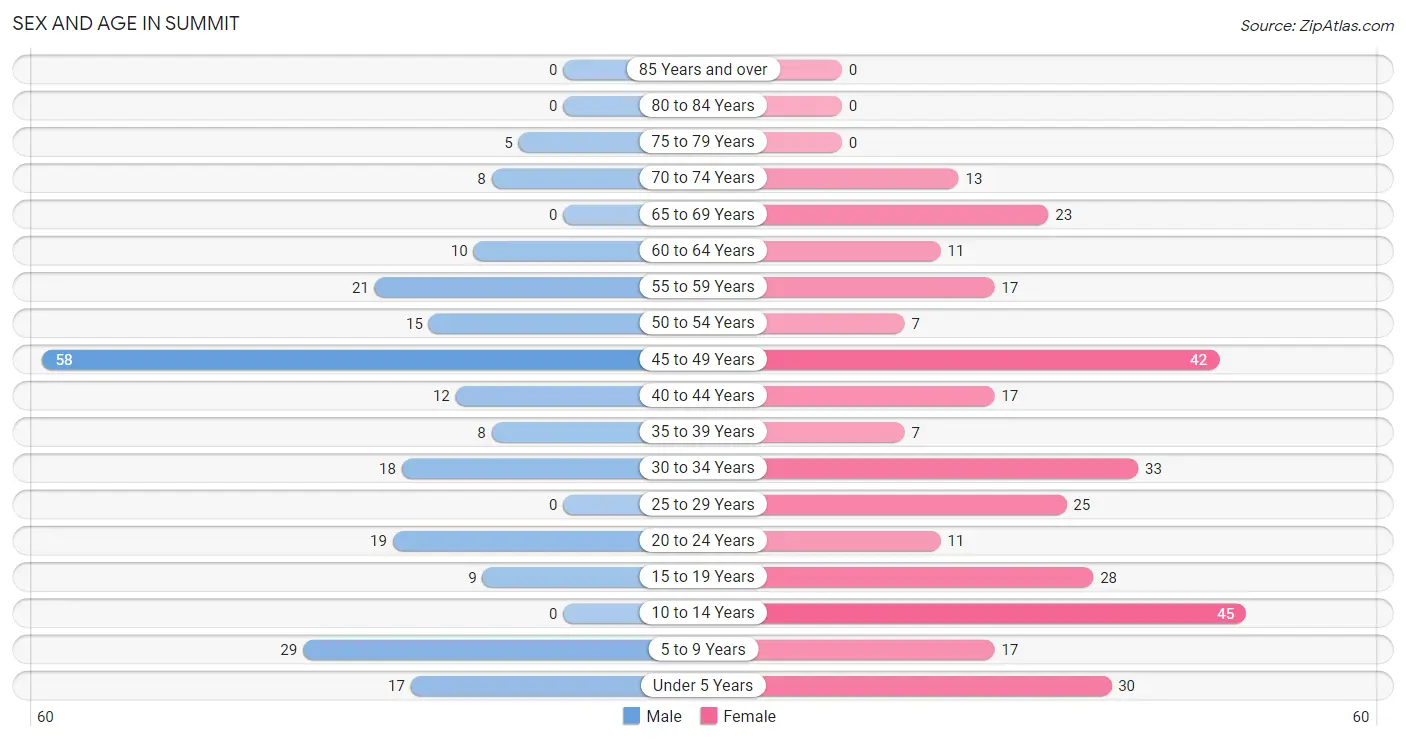
Sex and Age in Summit
Sex and Age in Summit
The most populous age groups in Summit are 45 to 49 Years (58 | 25.3%) for men and 10 to 14 Years (45 | 13.8%) for women.
| Age Bracket | Male | Female |
| Under 5 Years | 17 (7.4%) | 30 (9.2%) |
| 5 to 9 Years | 29 (12.7%) | 17 (5.2%) |
| 10 to 14 Years | 0 (0.0%) | 45 (13.8%) |
| 15 to 19 Years | 9 (3.9%) | 28 (8.6%) |
| 20 to 24 Years | 19 (8.3%) | 11 (3.4%) |
| 25 to 29 Years | 0 (0.0%) | 25 (7.7%) |
| 30 to 34 Years | 18 (7.9%) | 33 (10.1%) |
| 35 to 39 Years | 8 (3.5%) | 7 (2.1%) |
| 40 to 44 Years | 12 (5.2%) | 17 (5.2%) |
| 45 to 49 Years | 58 (25.3%) | 42 (12.9%) |
| 50 to 54 Years | 15 (6.6%) | 7 (2.1%) |
| 55 to 59 Years | 21 (9.2%) | 17 (5.2%) |
| 60 to 64 Years | 10 (4.4%) | 11 (3.4%) |
| 65 to 69 Years | 0 (0.0%) | 23 (7.1%) |
| 70 to 74 Years | 8 (3.5%) | 13 (4.0%) |
| 75 to 79 Years | 5 (2.2%) | 0 (0.0%) |
| 80 to 84 Years | 0 (0.0%) | 0 (0.0%) |
| 85 Years and over | 0 (0.0%) | 0 (0.0%) |
| Total | 229 (100.0%) | 326 (100.0%) |
Families and Households in Summit
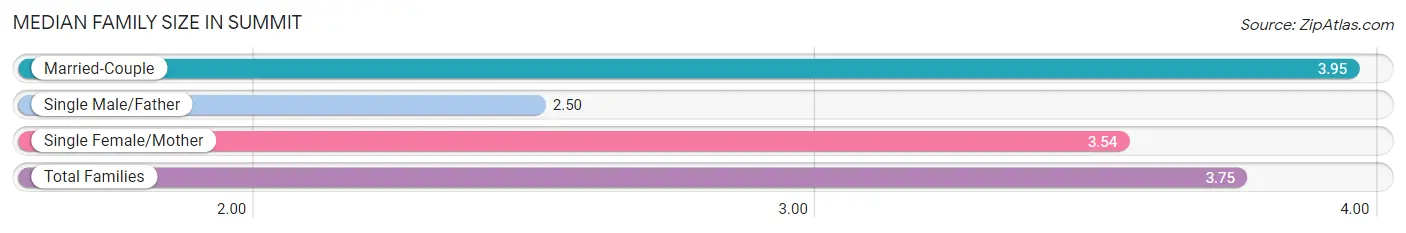
Median Family Size in Summit
The median family size in Summit is 3.75 persons per family, with married-couple families (94 | 71.2%) accounting for the largest median family size of 3.95 persons per family. On the other hand, single male/father families (10 | 7.6%) represent the smallest median family size with 2.50 persons per family.
| Family Type | # Families | Family Size |
| Married-Couple | 94 (71.2%) | 3.95 |
| Single Male/Father | 10 (7.6%) | 2.50 |
| Single Female/Mother | 28 (21.2%) | 3.54 |
| Total Families | 132 (100.0%) | 3.75 |
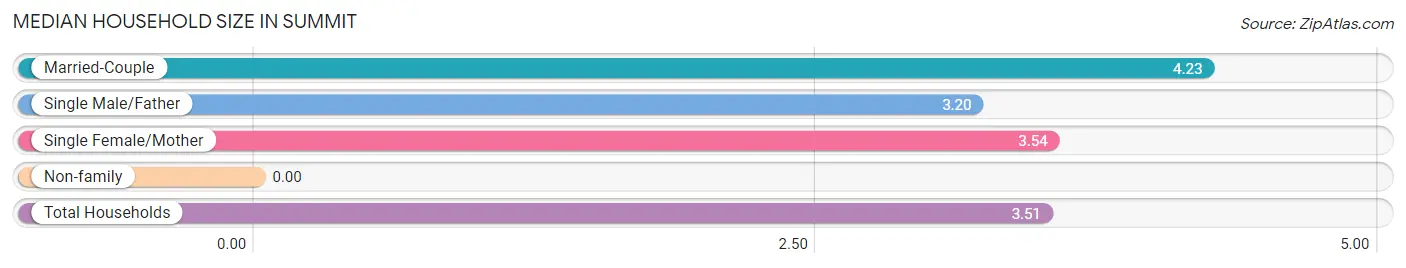
Median Household Size in Summit
| Household Type | # Households | Household Size |
| Married-Couple | 94 (59.5%) | 4.23 |
| Single Male/Father | 10 (6.3%) | 3.20 |
| Single Female/Mother | 28 (17.7%) | 3.54 |
| Non-family | 26 (16.5%) | - |
| Total Households | 158 (100.0%) | 3.51 |
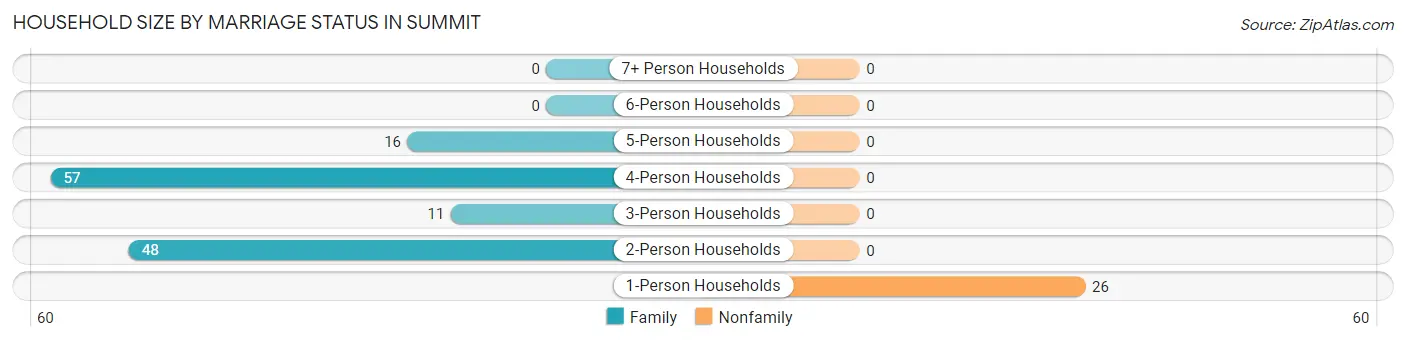
Household Size by Marriage Status in Summit
Out of a total of 158 households in Summit, 132 (83.5%) are family households, while 26 (16.5%) are nonfamily households. The most numerous type of family households are 4-person households, comprising 57, and the most common type of nonfamily households are 1-person households, comprising 26.
| Household Size | Family Households | Nonfamily Households |
| 1-Person Households | - | 26 (16.5%) |
| 2-Person Households | 48 (30.4%) | 0 (0.0%) |
| 3-Person Households | 11 (7.0%) | 0 (0.0%) |
| 4-Person Households | 57 (36.1%) | 0 (0.0%) |
| 5-Person Households | 16 (10.1%) | 0 (0.0%) |
| 6-Person Households | 0 (0.0%) | 0 (0.0%) |
| 7+ Person Households | 0 (0.0%) | 0 (0.0%) |
| Total | 132 (83.5%) | 26 (16.5%) |
Female Fertility in Summit
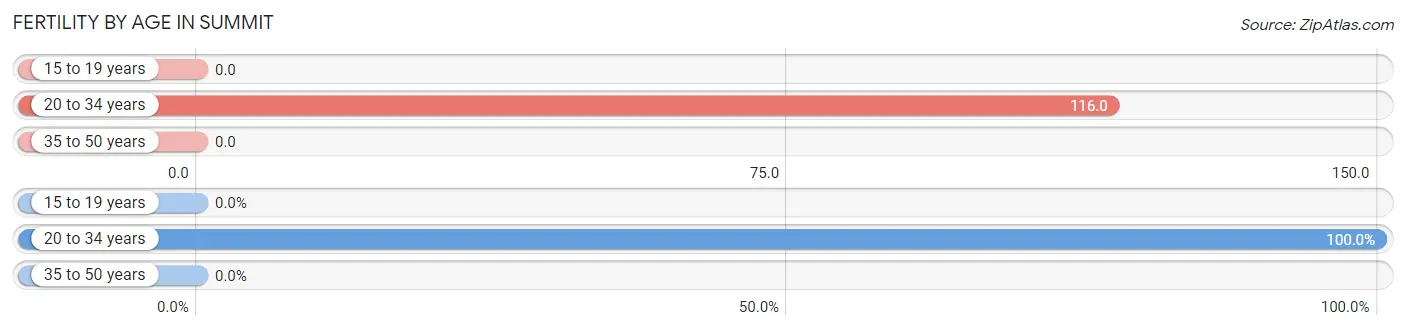
Fertility by Age in Summit
Average fertility rate in Summit is 48.0 births per 1,000 women. Women in the age bracket of 20 to 34 years have the highest fertility rate with 116.0 births per 1,000 women. Women in the age bracket of 20 to 34 years acount for 100.0% of all women with births.
| Age Bracket | Women with Births | Births / 1,000 Women |
| 15 to 19 years | 0 (0.0%) | 0.0 |
| 20 to 34 years | 8 (100.0%) | 116.0 |
| 35 to 50 years | 0 (0.0%) | 0.0 |
| Total | 8 (100.0%) | 48.0 |
Fertility by Age by Marriage Status in Summit
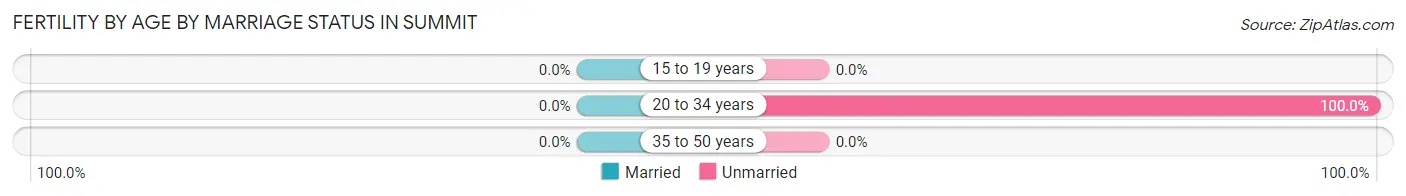
| Age Bracket | Married | Unmarried |
| 15 to 19 years | 0 (0.0%) | 0 (0.0%) |
| 20 to 34 years | 0 (0.0%) | 8 (100.0%) |
| 35 to 50 years | 0 (0.0%) | 0 (0.0%) |
| Total | 0 (0.0%) | 8 (100.0%) |
Fertility by Education in Summit
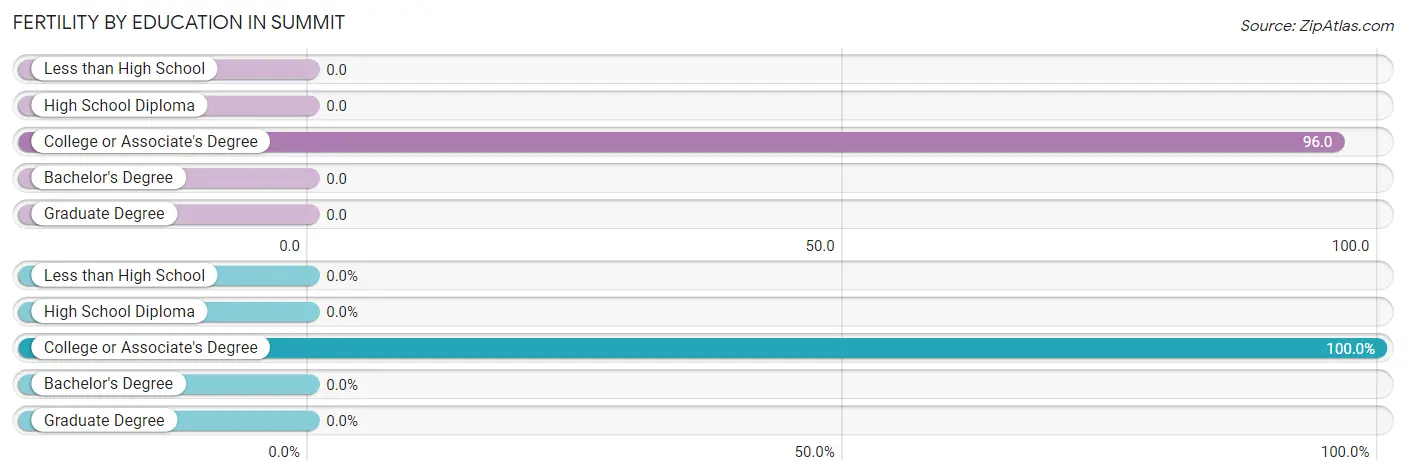
| Educational Attainment | Women with Births | Births / 1,000 Women |
| Less than High School | 0 (0.0%) | 0.0 |
| High School Diploma | 0 (0.0%) | 0.0 |
| College or Associate's Degree | 8 (100.0%) | 96.0 |
| Bachelor's Degree | 0 (0.0%) | 0.0 |
| Graduate Degree | 0 (0.0%) | 0.0 |
| Total | 8 (100.0%) | 48.0 |
Fertility by Education by Marriage Status in Summit
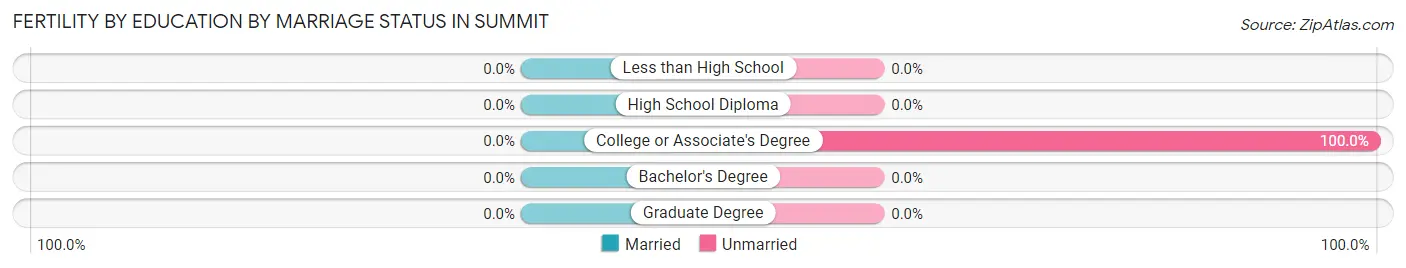
| Educational Attainment | Married | Unmarried |
| Less than High School | 0 (0.0%) | 0 (0.0%) |
| High School Diploma | 0 (0.0%) | 0 (0.0%) |
| College or Associate's Degree | 0 (0.0%) | 8 (100.0%) |
| Bachelor's Degree | 0 (0.0%) | 0 (0.0%) |
| Graduate Degree | 0 (0.0%) | 0 (0.0%) |
| Total | 0 (0.0%) | 8 (100.0%) |
Income in Summit
Income Overview in Summit
Per Capita Income in Summit is $22,702, while median incomes of families and households are $61,875 and $62,188 respectively.
| Characteristic | Number | Measure |
| Per Capita Income | 555 | $22,702 |
| Median Family Income | 132 | $61,875 |
| Mean Family Income | 132 | $74,131 |
| Median Household Income | 158 | $62,188 |
| Mean Household Income | 158 | $67,723 |
| Income Deficit | 132 | $0 |
| Wage / Income Gap (%) | 555 | 0.00% |
| Wage / Income Gap ($) | 555 | 100.00¢ per $1 |
| Gini / Inequality Index | 555 | 0.39 |
Earnings by Sex in Summit
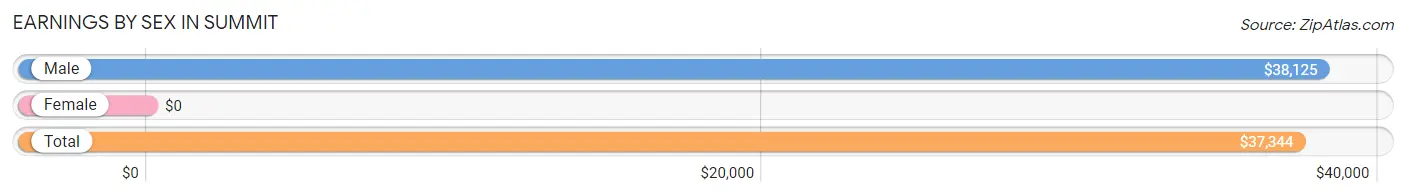
| Sex | Number | Average Earnings |
| Male | 116 (44.4%) | $38,125 |
| Female | 145 (55.6%) | $0 |
| Total | 261 (100.0%) | $37,344 |
Earnings by Sex by Income Bracket in Summit
The most common earnings brackets in Summit are $40,000 to $44,999 for men (32 | 27.6%) and $75,000 to $99,999 for women (33 | 22.8%).
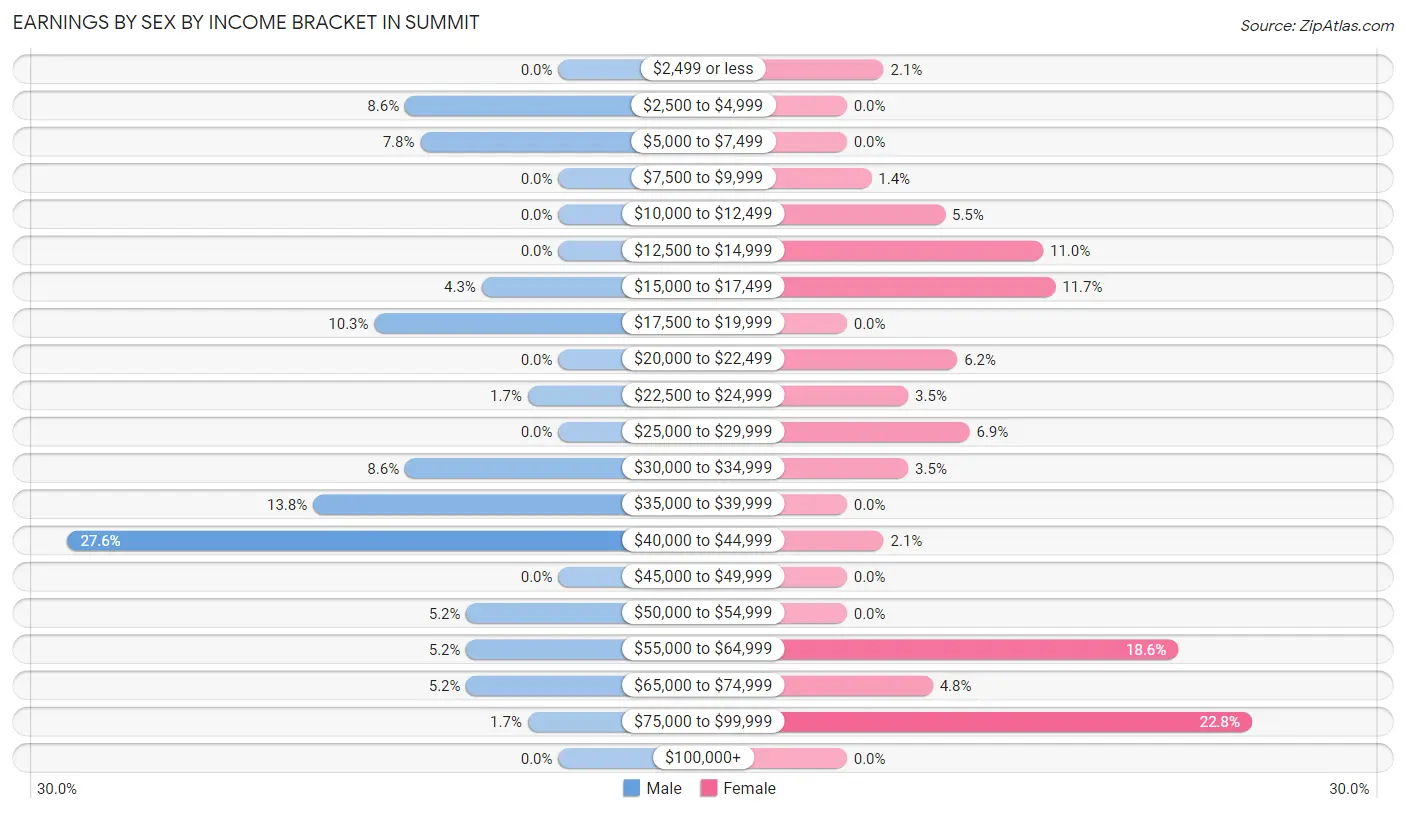
| Income | Male | Female |
| $2,499 or less | 0 (0.0%) | 3 (2.1%) |
| $2,500 to $4,999 | 10 (8.6%) | 0 (0.0%) |
| $5,000 to $7,499 | 9 (7.8%) | 0 (0.0%) |
| $7,500 to $9,999 | 0 (0.0%) | 2 (1.4%) |
| $10,000 to $12,499 | 0 (0.0%) | 8 (5.5%) |
| $12,500 to $14,999 | 0 (0.0%) | 16 (11.0%) |
| $15,000 to $17,499 | 5 (4.3%) | 17 (11.7%) |
| $17,500 to $19,999 | 12 (10.3%) | 0 (0.0%) |
| $20,000 to $22,499 | 0 (0.0%) | 9 (6.2%) |
| $22,500 to $24,999 | 2 (1.7%) | 5 (3.5%) |
| $25,000 to $29,999 | 0 (0.0%) | 10 (6.9%) |
| $30,000 to $34,999 | 10 (8.6%) | 5 (3.5%) |
| $35,000 to $39,999 | 16 (13.8%) | 0 (0.0%) |
| $40,000 to $44,999 | 32 (27.6%) | 3 (2.1%) |
| $45,000 to $49,999 | 0 (0.0%) | 0 (0.0%) |
| $50,000 to $54,999 | 6 (5.2%) | 0 (0.0%) |
| $55,000 to $64,999 | 6 (5.2%) | 27 (18.6%) |
| $65,000 to $74,999 | 6 (5.2%) | 7 (4.8%) |
| $75,000 to $99,999 | 2 (1.7%) | 33 (22.8%) |
| $100,000+ | 0 (0.0%) | 0 (0.0%) |
| Total | 116 (100.0%) | 145 (100.0%) |
Earnings by Sex by Educational Attainment in Summit
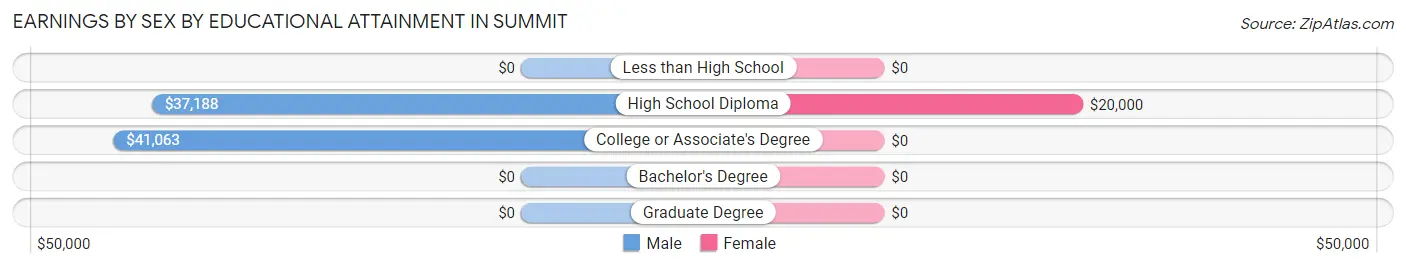
| Educational Attainment | Male Income | Female Income |
| Less than High School | - | - |
| High School Diploma | $37,188 | $20,000 |
| College or Associate's Degree | $41,063 | $0 |
| Bachelor's Degree | - | - |
| Graduate Degree | - | - |
| Total | $38,750 | $0 |
Family Income in Summit
Family Income Brackets in Summit
According to the Summit family income data, there are 51 families falling into the $100,000 to $149,999 income range, which is the most common income bracket and makes up 38.6% of all families.
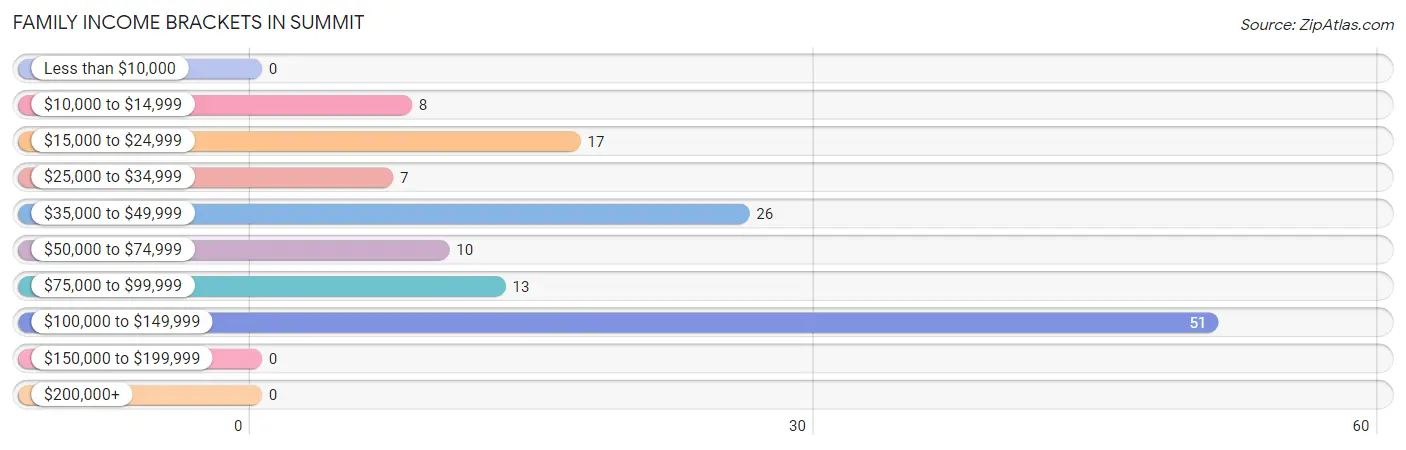
| Income Bracket | # Families | % Families |
| Less than $10,000 | 0 | 0.0% |
| $10,000 to $14,999 | 8 | 6.1% |
| $15,000 to $24,999 | 17 | 12.9% |
| $25,000 to $34,999 | 7 | 5.3% |
| $35,000 to $49,999 | 26 | 19.7% |
| $50,000 to $74,999 | 10 | 7.6% |
| $75,000 to $99,999 | 13 | 9.8% |
| $100,000 to $149,999 | 51 | 38.6% |
| $150,000 to $199,999 | 0 | 0.0% |
| $200,000+ | 0 | 0.0% |
Family Income by Famaliy Size in Summit
4-person families (43 | 32.6%) account for the highest median family income in Summit with $128,125 per family, while 4-person families (43 | 32.6%) have the highest median income of $32,031 per family member.
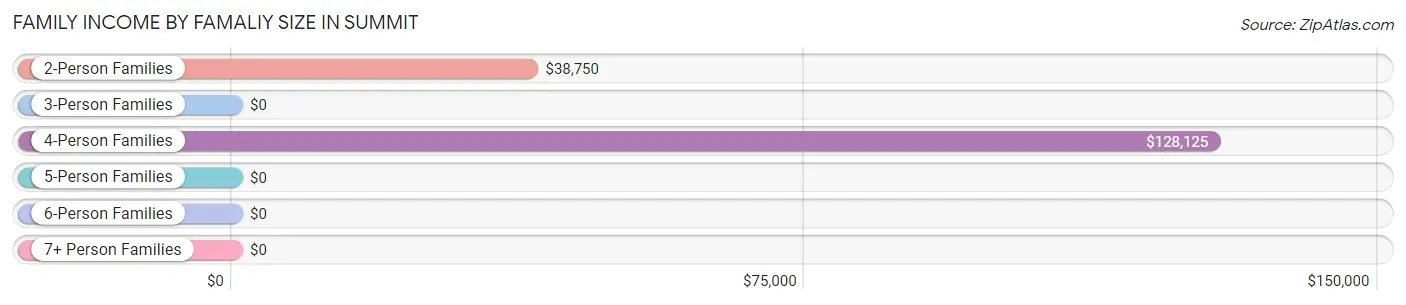
| Income Bracket | # Families | Median Income |
| 2-Person Families | 59 (44.7%) | $38,750 |
| 3-Person Families | 14 (10.6%) | $0 |
| 4-Person Families | 43 (32.6%) | $128,125 |
| 5-Person Families | 16 (12.1%) | $0 |
| 6-Person Families | 0 (0.0%) | $0 |
| 7+ Person Families | 0 (0.0%) | $0 |
| Total | 132 (100.0%) | $61,875 |
Family Income by Number of Earners in Summit
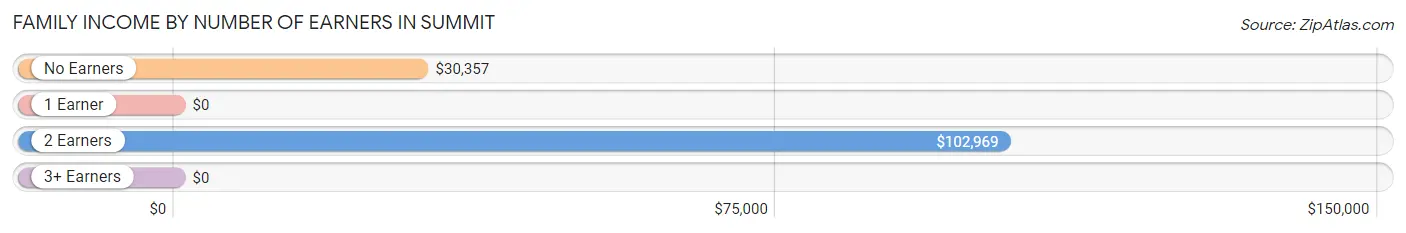
| Number of Earners | # Families | Median Income |
| No Earners | 22 (16.7%) | $30,357 |
| 1 Earner | 25 (18.9%) | $0 |
| 2 Earners | 83 (62.9%) | $102,969 |
| 3+ Earners | 2 (1.5%) | $0 |
| Total | 132 (100.0%) | $61,875 |
Household Income in Summit
Household Income Brackets in Summit
With 51 households falling in the category, the $100,000 to $149,999 income range is the most frequent in Summit, accounting for 32.3% of all households.
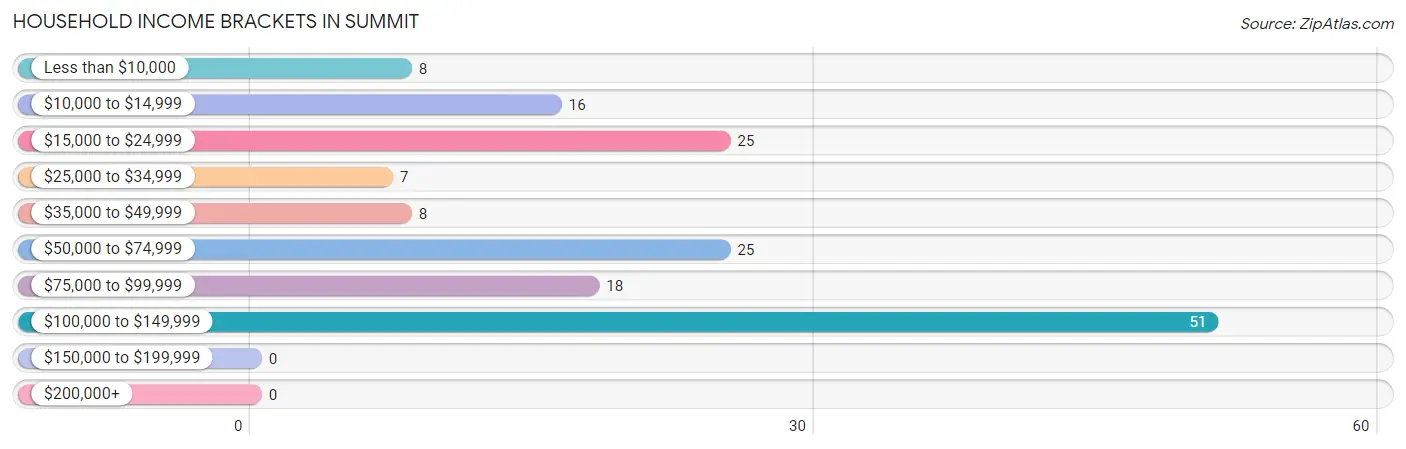
| Income Bracket | # Households | % Households |
| Less than $10,000 | 8 | 5.1% |
| $10,000 to $14,999 | 16 | 10.1% |
| $15,000 to $24,999 | 25 | 15.8% |
| $25,000 to $34,999 | 7 | 4.4% |
| $35,000 to $49,999 | 8 | 5.1% |
| $50,000 to $74,999 | 25 | 15.8% |
| $75,000 to $99,999 | 18 | 11.4% |
| $100,000 to $149,999 | 51 | 32.3% |
| $150,000 to $199,999 | 0 | 0.0% |
| $200,000+ | 0 | 0.0% |
Household Income by Householder Age in Summit
The median household income in Summit is $62,188, with the highest median household income of $85,625 found in the 45 to 64 years age bracket for the primary householder. A total of 77 households (48.7%) fall into this category. Meanwhile, the 15 to 24 years age bracket for the primary householder has the lowest median household income of $0, with 9 households (5.7%) in this group.
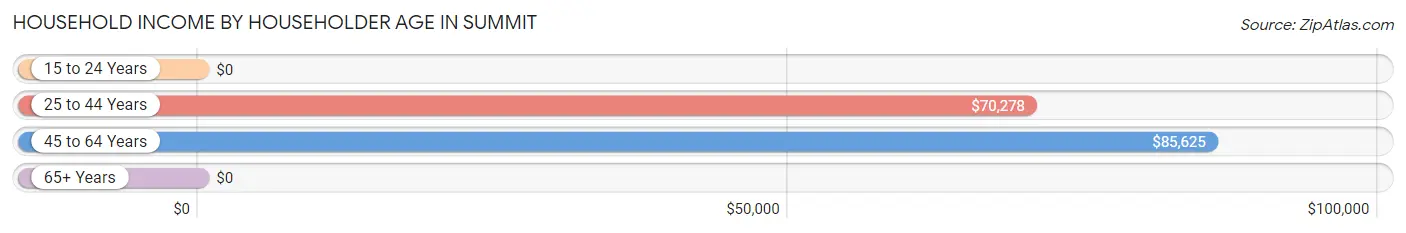
| Income Bracket | # Households | Median Income |
| 15 to 24 Years | 9 (5.7%) | $0 |
| 25 to 44 Years | 44 (27.9%) | $70,278 |
| 45 to 64 Years | 77 (48.7%) | $85,625 |
| 65+ Years | 28 (17.7%) | $0 |
| Total | 158 (100.0%) | $62,188 |
Poverty in Summit
Income Below Poverty by Sex and Age in Summit
With 17.9% poverty level for males and 14.1% for females among the residents of Summit, 65 to 74 year old males and under 5 year old females are the most vulnerable to poverty, with 8 males (100.0%) and 17 females (56.7%) in their respective age groups living below the poverty level.
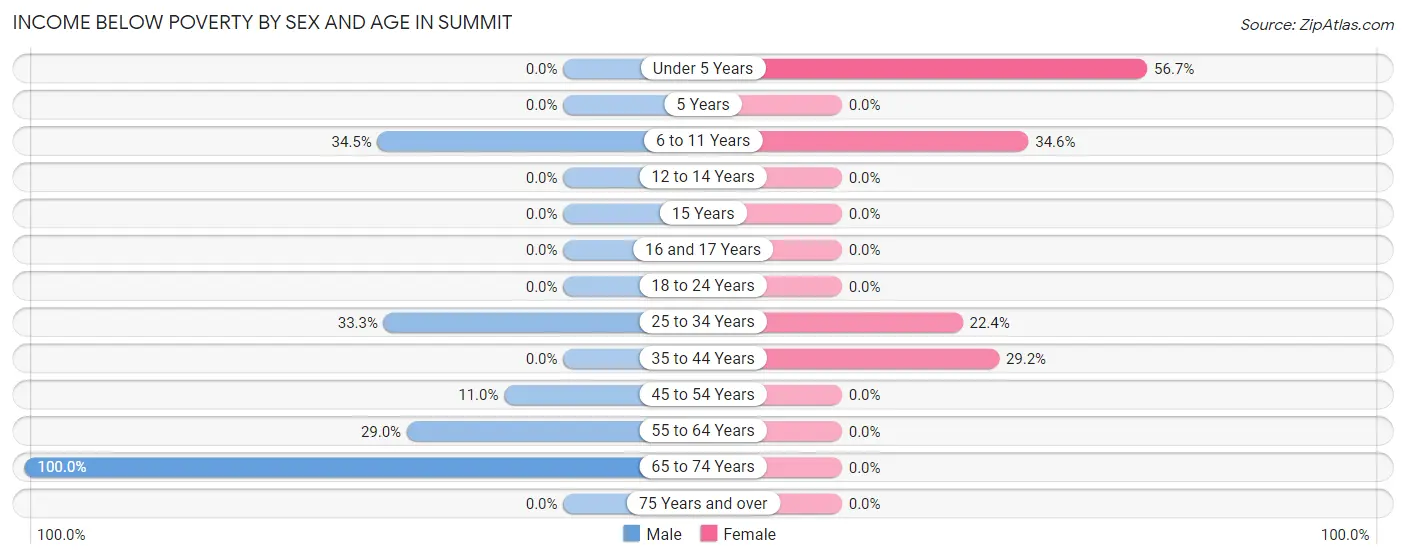
| Age Bracket | Male | Female |
| Under 5 Years | 0 (0.0%) | 17 (56.7%) |
| 5 Years | 0 (0.0%) | 0 (0.0%) |
| 6 to 11 Years | 10 (34.5%) | 9 (34.6%) |
| 12 to 14 Years | 0 (0.0%) | 0 (0.0%) |
| 15 Years | 0 (0.0%) | 0 (0.0%) |
| 16 and 17 Years | 0 (0.0%) | 0 (0.0%) |
| 18 to 24 Years | 0 (0.0%) | 0 (0.0%) |
| 25 to 34 Years | 6 (33.3%) | 13 (22.4%) |
| 35 to 44 Years | 0 (0.0%) | 7 (29.2%) |
| 45 to 54 Years | 8 (11.0%) | 0 (0.0%) |
| 55 to 64 Years | 9 (29.0%) | 0 (0.0%) |
| 65 to 74 Years | 8 (100.0%) | 0 (0.0%) |
| 75 Years and over | 0 (0.0%) | 0 (0.0%) |
| Total | 41 (17.9%) | 46 (14.1%) |
Income Above Poverty by Sex and Age in Summit
According to the poverty statistics in Summit, males aged under 5 years and females aged 12 to 14 years are the age groups that are most secure financially, with 100.0% of males and 100.0% of females in these age groups living above the poverty line.
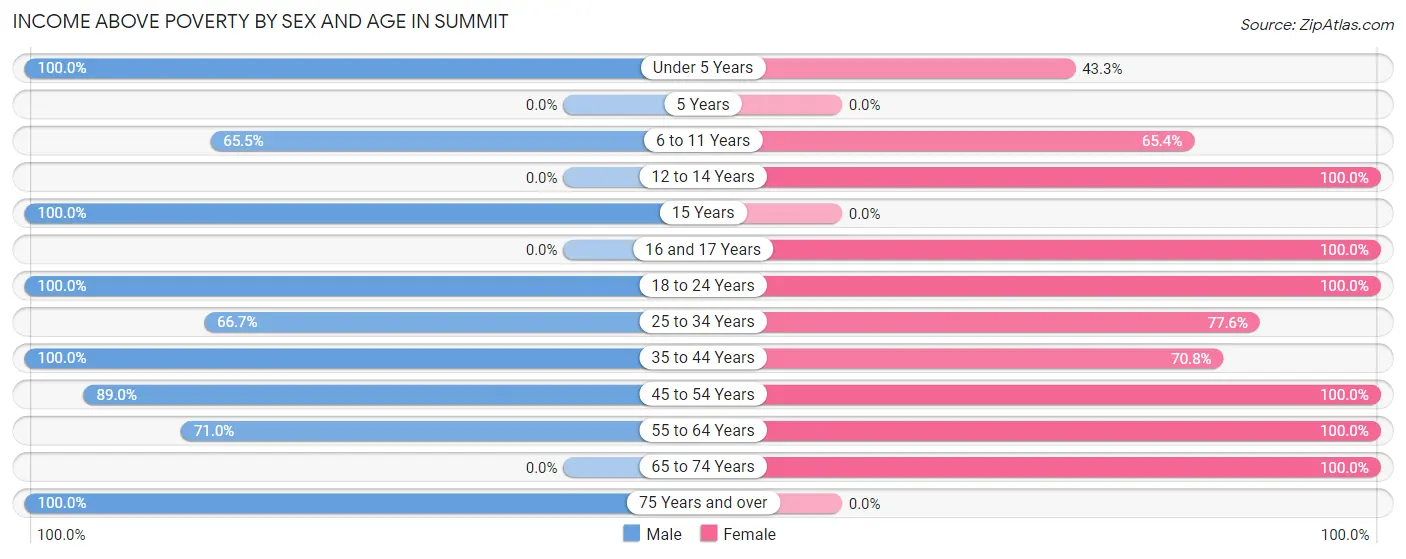
| Age Bracket | Male | Female |
| Under 5 Years | 17 (100.0%) | 13 (43.3%) |
| 5 Years | 0 (0.0%) | 0 (0.0%) |
| 6 to 11 Years | 19 (65.5%) | 17 (65.4%) |
| 12 to 14 Years | 0 (0.0%) | 36 (100.0%) |
| 15 Years | 9 (100.0%) | 0 (0.0%) |
| 16 and 17 Years | 0 (0.0%) | 21 (100.0%) |
| 18 to 24 Years | 19 (100.0%) | 18 (100.0%) |
| 25 to 34 Years | 12 (66.7%) | 45 (77.6%) |
| 35 to 44 Years | 20 (100.0%) | 17 (70.8%) |
| 45 to 54 Years | 65 (89.0%) | 49 (100.0%) |
| 55 to 64 Years | 22 (71.0%) | 28 (100.0%) |
| 65 to 74 Years | 0 (0.0%) | 36 (100.0%) |
| 75 Years and over | 5 (100.0%) | 0 (0.0%) |
| Total | 188 (82.1%) | 280 (85.9%) |
Income Below Poverty Among Married-Couple Families in Summit
The poverty statistics for married-couple families in Summit show that 5.3% or 5 of the total 94 families live below the poverty line. Families with 1 or 2 children have the highest poverty rate of 7.7%, comprising of 5 families. On the other hand, families with no children have the lowest poverty rate of 0.0%, which includes 0 families.
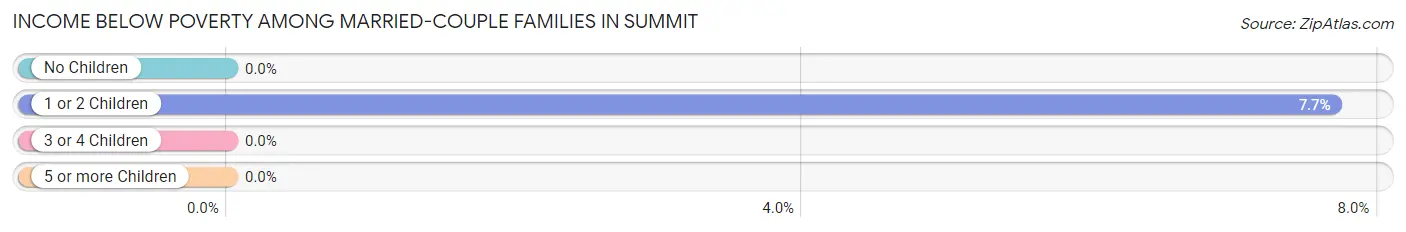
| Children | Above Poverty | Below Poverty |
| No Children | 29 (100.0%) | 0 (0.0%) |
| 1 or 2 Children | 60 (92.3%) | 5 (7.7%) |
| 3 or 4 Children | 0 (0.0%) | 0 (0.0%) |
| 5 or more Children | 0 (0.0%) | 0 (0.0%) |
| Total | 89 (94.7%) | 5 (5.3%) |
Income Below Poverty Among Single-Parent Households in Summit
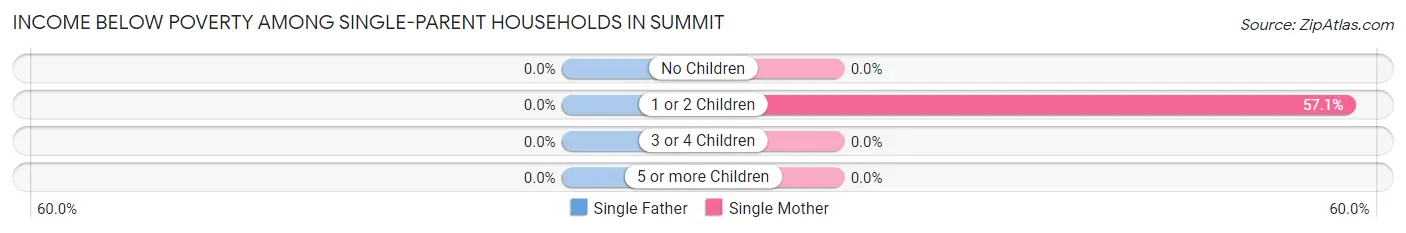
| Children | Single Father | Single Mother |
| No Children | 0 (0.0%) | 0 (0.0%) |
| 1 or 2 Children | 0 (0.0%) | 8 (57.1%) |
| 3 or 4 Children | 0 (0.0%) | 0 (0.0%) |
| 5 or more Children | 0 (0.0%) | 0 (0.0%) |
| Total | 0 (0.0%) | 8 (28.6%) |
Income Below Poverty Among Married-Couple vs Single-Parent Households in Summit
The poverty data for Summit shows that 5 of the married-couple family households (5.3%) and 8 of the single-parent households (21.0%) are living below the poverty level. Within the married-couple family households, those with 1 or 2 children have the highest poverty rate, with 5 households (7.7%) falling below the poverty line. Among the single-parent households, those with 1 or 2 children have the highest poverty rate, with 8 household (40.0%) living below poverty.
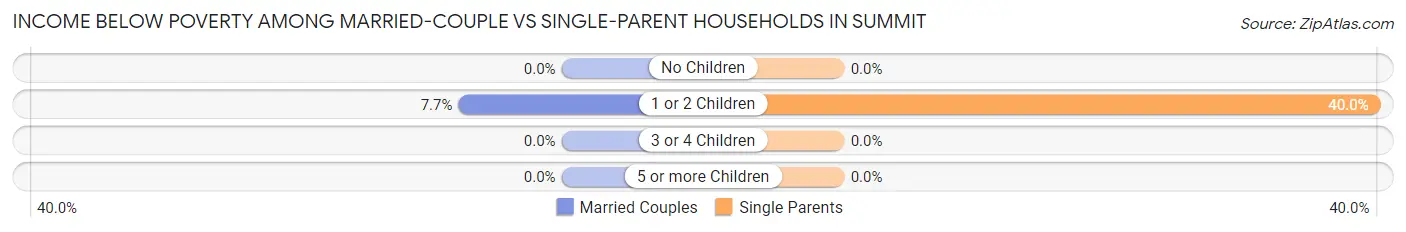
| Children | Married-Couple Families | Single-Parent Households |
| No Children | 0 (0.0%) | 0 (0.0%) |
| 1 or 2 Children | 5 (7.7%) | 8 (40.0%) |
| 3 or 4 Children | 0 (0.0%) | 0 (0.0%) |
| 5 or more Children | 0 (0.0%) | 0 (0.0%) |
| Total | 5 (5.3%) | 8 (21.0%) |
Employment Characteristics in Summit
Employment by Class of Employer in Summit
Among the 237 employed individuals in Summit, private company employees (142 | 59.9%), local government employees (52 | 21.9%), and self-employed (not incorporated) (40 | 16.9%) make up the most common classes of employment.
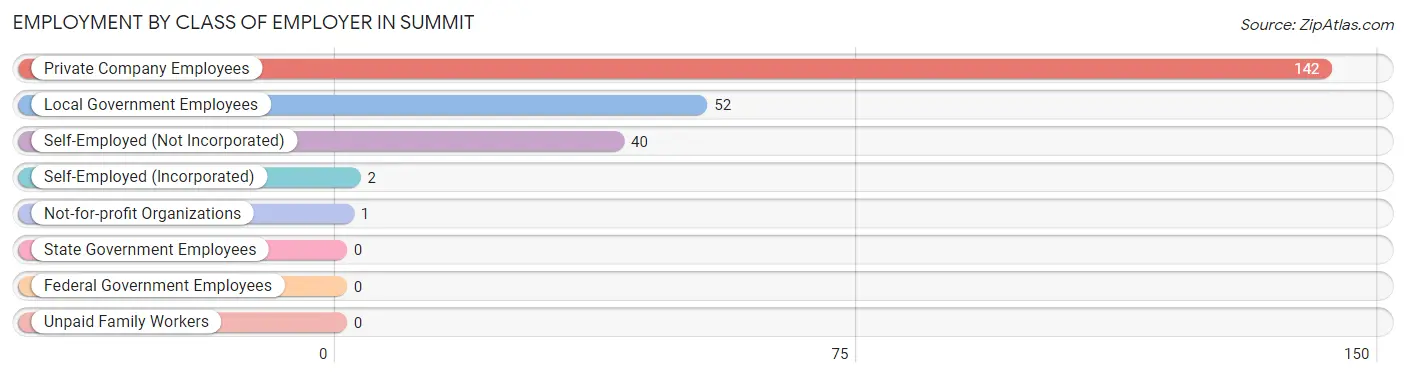
| Employer Class | # Employees | % Employees |
| Private Company Employees | 142 | 59.9% |
| Self-Employed (Incorporated) | 2 | 0.8% |
| Self-Employed (Not Incorporated) | 40 | 16.9% |
| Not-for-profit Organizations | 1 | 0.4% |
| Local Government Employees | 52 | 21.9% |
| State Government Employees | 0 | 0.0% |
| Federal Government Employees | 0 | 0.0% |
| Unpaid Family Workers | 0 | 0.0% |
| Total | 237 | 100.0% |
Employment Status by Age in Summit
According to the labor force statistics for Summit, out of the total population over 16 years of age (408), 67.9% or 277 individuals are in the labor force, with 11.9% or 33 of them unemployed. The age group with the highest labor force participation rate is 20 to 24 years, with 100.0% or 30 individuals in the labor force. Within the labor force, the 25 to 29 years age range has the highest percentage of unemployed individuals, with 90.0% or 18 of them being unemployed.
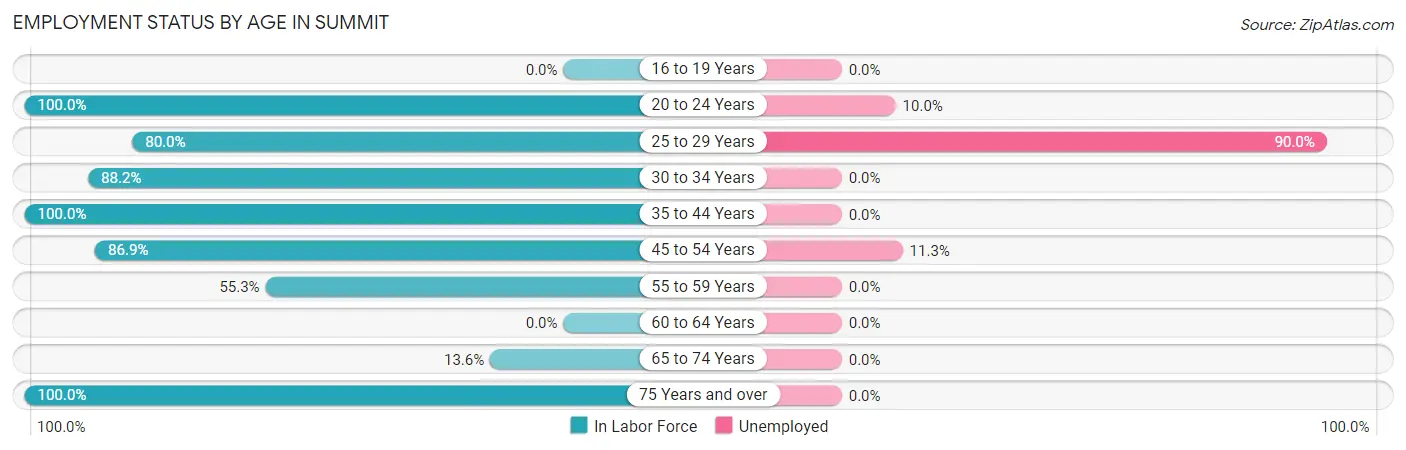
| Age Bracket | In Labor Force | Unemployed |
| 16 to 19 Years | 0 (0.0%) | 0 (0.0%) |
| 20 to 24 Years | 30 (100.0%) | 3 (10.0%) |
| 25 to 29 Years | 20 (80.0%) | 18 (90.0%) |
| 30 to 34 Years | 45 (88.2%) | 0 (0.0%) |
| 35 to 44 Years | 44 (100.0%) | 0 (0.0%) |
| 45 to 54 Years | 106 (86.9%) | 12 (11.3%) |
| 55 to 59 Years | 21 (55.3%) | 0 (0.0%) |
| 60 to 64 Years | 0 (0.0%) | 0 (0.0%) |
| 65 to 74 Years | 6 (13.6%) | 0 (0.0%) |
| 75 Years and over | 5 (100.0%) | 0 (0.0%) |
| Total | 277 (67.9%) | 33 (11.9%) |
Employment Status by Educational Attainment in Summit
According to labor force statistics for Summit, 78.4% of individuals (236) out of the total population between 25 and 64 years of age (301) are in the labor force, with 12.7% or 30 of them being unemployed. The group with the highest labor force participation rate are those with the educational attainment of bachelor's degree or higher, with 100.0% or 16 individuals in the labor force. Within the labor force, individuals with high school diploma education have the highest percentage of unemployment, with 23.7% or 22 of them being unemployed.
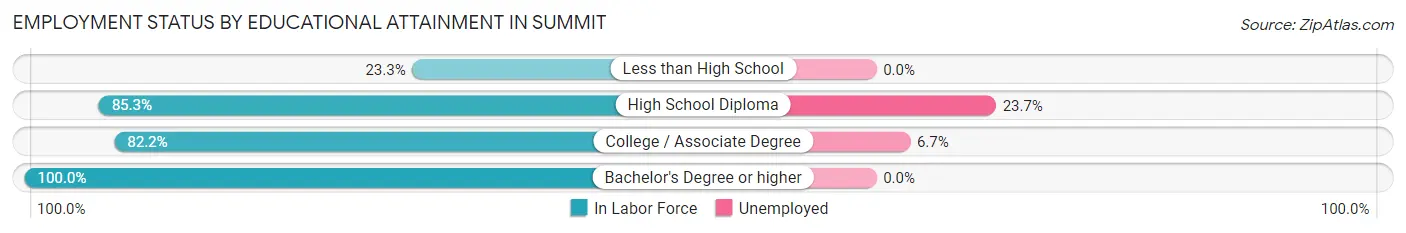
| Educational Attainment | In Labor Force | Unemployed |
| Less than High School | 7 (23.3%) | 0 (0.0%) |
| High School Diploma | 93 (85.3%) | 26 (23.7%) |
| College / Associate Degree | 120 (82.2%) | 10 (6.7%) |
| Bachelor's Degree or higher | 16 (100.0%) | 0 (0.0%) |
| Total | 236 (78.4%) | 38 (12.7%) |
Employment Occupations by Sex in Summit
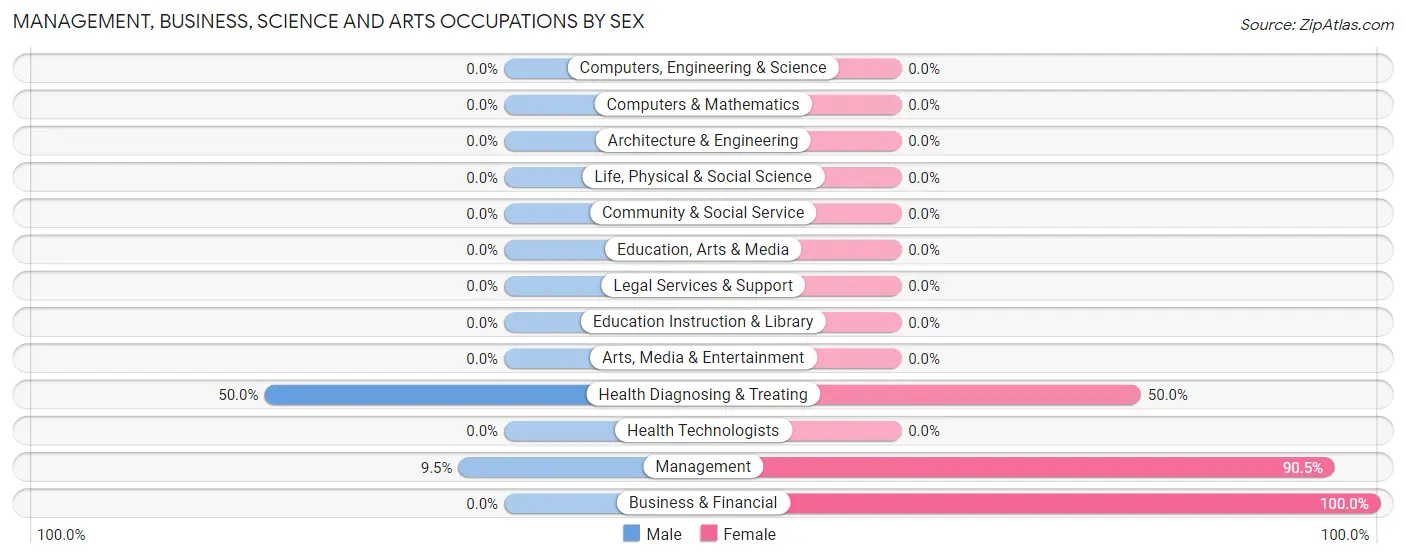
Management, Business, Science and Arts Occupations
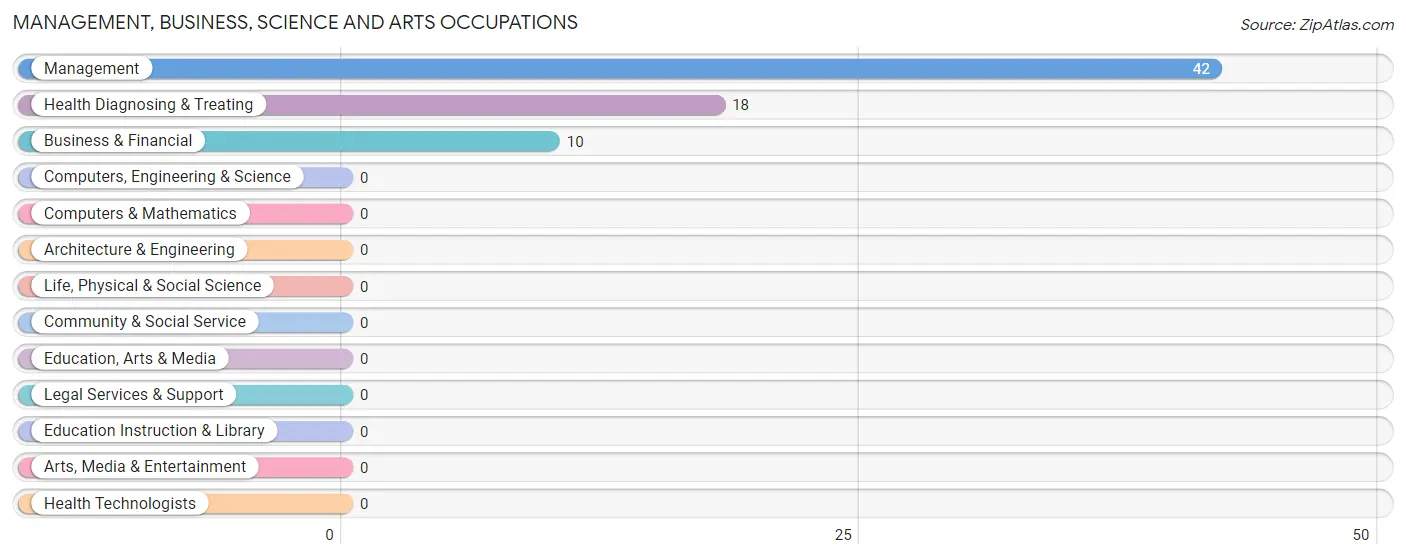
The most common Management, Business, Science and Arts occupations in Summit are Management (42 | 17.2%), Health Diagnosing & Treating (18 | 7.4%), and Business & Financial (10 | 4.1%).
Management, Business, Science and Arts Occupations by Sex
Within the Management, Business, Science and Arts occupations in Summit, the most male-oriented occupations are Health Diagnosing & Treating (50.0%), and Management (9.5%), while the most female-oriented occupations are Business & Financial (100.0%), Management (90.5%), and Health Diagnosing & Treating (50.0%).
| Occupation | Male | Female |
| Management | 4 (9.5%) | 38 (90.5%) |
| Business & Financial | 0 (0.0%) | 10 (100.0%) |
| Computers, Engineering & Science | 0 (0.0%) | 0 (0.0%) |
| Computers & Mathematics | 0 (0.0%) | 0 (0.0%) |
| Architecture & Engineering | 0 (0.0%) | 0 (0.0%) |
| Life, Physical & Social Science | 0 (0.0%) | 0 (0.0%) |
| Community & Social Service | 0 (0.0%) | 0 (0.0%) |
| Education, Arts & Media | 0 (0.0%) | 0 (0.0%) |
| Legal Services & Support | 0 (0.0%) | 0 (0.0%) |
| Education Instruction & Library | 0 (0.0%) | 0 (0.0%) |
| Arts, Media & Entertainment | 0 (0.0%) | 0 (0.0%) |
| Health Diagnosing & Treating | 9 (50.0%) | 9 (50.0%) |
| Health Technologists | 0 (0.0%) | 0 (0.0%) |
| Total (Category) | 13 (18.6%) | 57 (81.4%) |
| Total (Overall) | 112 (45.9%) | 132 (54.1%) |
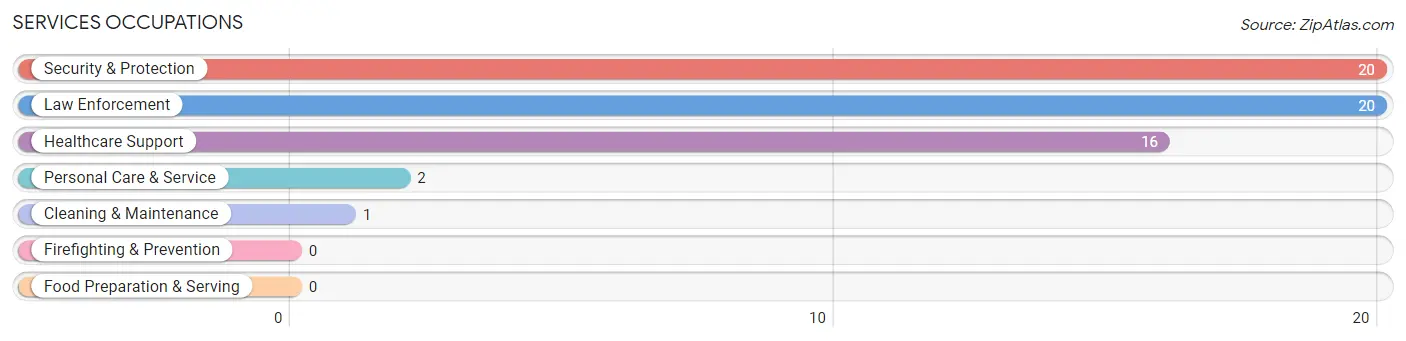
Services Occupations
The most common Services occupations in Summit are Security & Protection (20 | 8.2%), Law Enforcement (20 | 8.2%), Healthcare Support (16 | 6.6%), Personal Care & Service (2 | 0.8%), and Cleaning & Maintenance (1 | 0.4%).
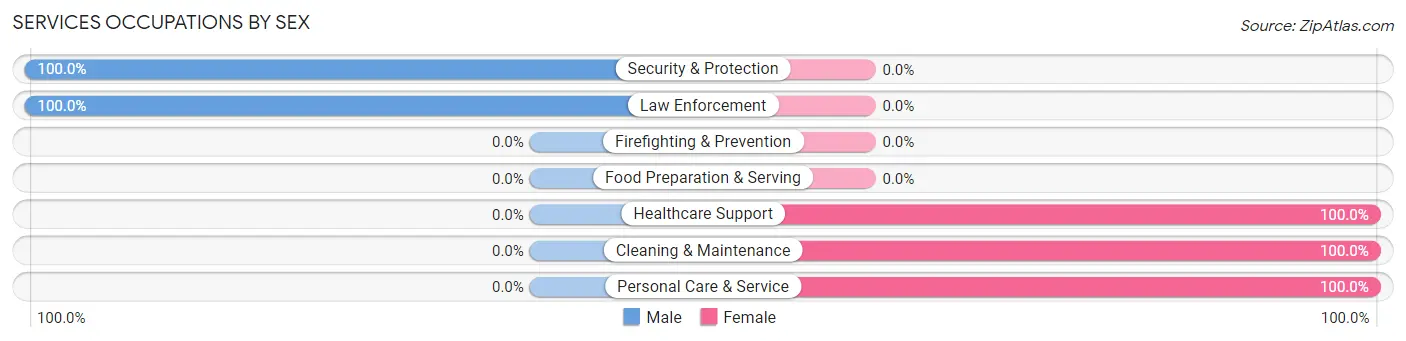
Services Occupations by Sex
Within the Services occupations in Summit, the most male-oriented occupations are Security & Protection (100.0%), and Law Enforcement (100.0%), while the most female-oriented occupations are Healthcare Support (100.0%), Cleaning & Maintenance (100.0%), and Personal Care & Service (100.0%).
| Occupation | Male | Female |
| Healthcare Support | 0 (0.0%) | 16 (100.0%) |
| Security & Protection | 20 (100.0%) | 0 (0.0%) |
| Firefighting & Prevention | 0 (0.0%) | 0 (0.0%) |
| Law Enforcement | 20 (100.0%) | 0 (0.0%) |
| Food Preparation & Serving | 0 (0.0%) | 0 (0.0%) |
| Cleaning & Maintenance | 0 (0.0%) | 1 (100.0%) |
| Personal Care & Service | 0 (0.0%) | 2 (100.0%) |
| Total (Category) | 20 (51.3%) | 19 (48.7%) |
| Total (Overall) | 112 (45.9%) | 132 (54.1%) |
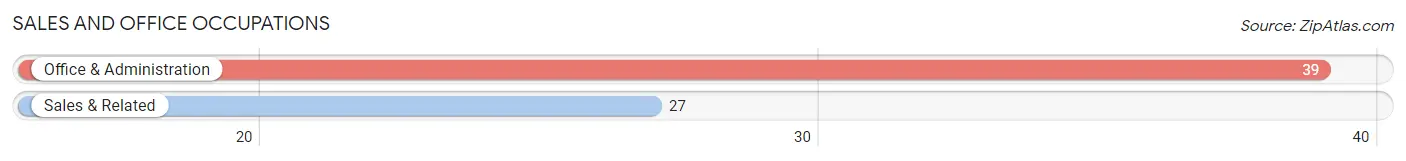
Sales and Office Occupations
The most common Sales and Office occupations in Summit are Office & Administration (39 | 16.0%), and Sales & Related (27 | 11.1%).
Sales and Office Occupations by Sex
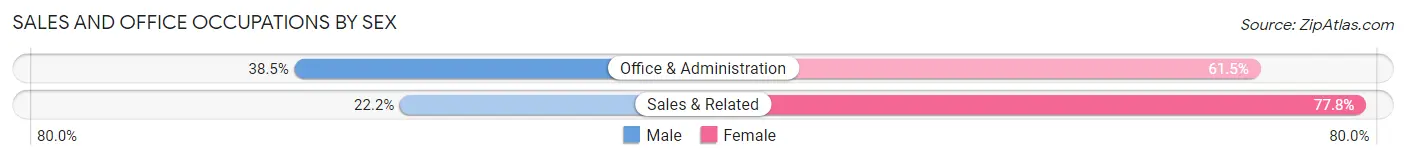
| Occupation | Male | Female |
| Sales & Related | 6 (22.2%) | 21 (77.8%) |
| Office & Administration | 15 (38.5%) | 24 (61.5%) |
| Total (Category) | 21 (31.8%) | 45 (68.2%) |
| Total (Overall) | 112 (45.9%) | 132 (54.1%) |
Natural Resources, Construction and Maintenance Occupations
The most common Natural Resources, Construction and Maintenance occupations in Summit are , and Construction & Extraction (45 | 18.4%).
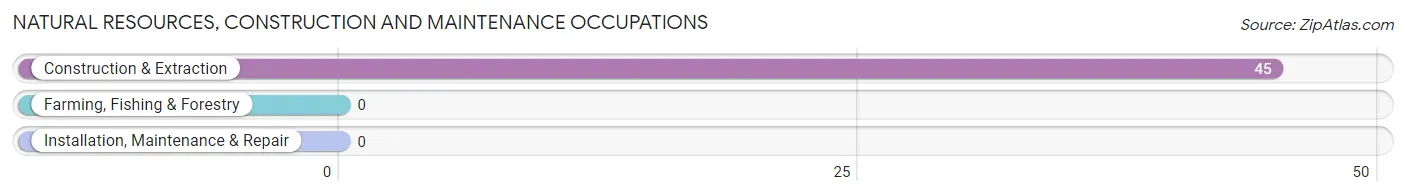
Natural Resources, Construction and Maintenance Occupations by Sex
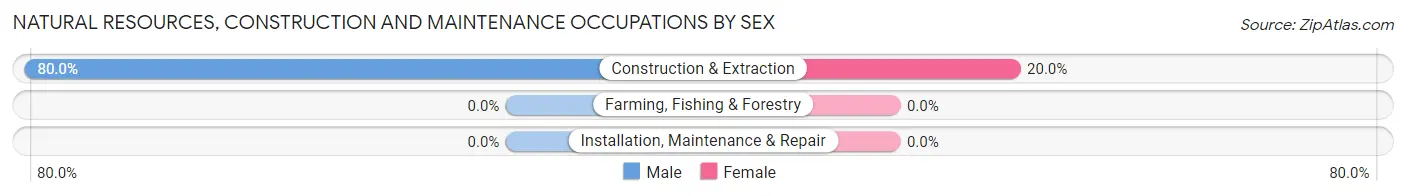
| Occupation | Male | Female |
| Farming, Fishing & Forestry | 0 (0.0%) | 0 (0.0%) |
| Construction & Extraction | 36 (80.0%) | 9 (20.0%) |
| Installation, Maintenance & Repair | 0 (0.0%) | 0 (0.0%) |
| Total (Category) | 36 (80.0%) | 9 (20.0%) |
| Total (Overall) | 112 (45.9%) | 132 (54.1%) |
Production, Transportation and Moving Occupations
The most common Production, Transportation and Moving occupations in Summit are Transportation (16 | 6.6%), Production (6 | 2.5%), and Material Moving (2 | 0.8%).
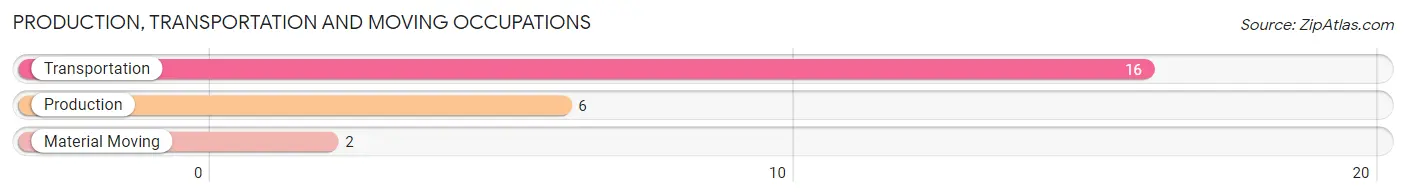
Production, Transportation and Moving Occupations by Sex
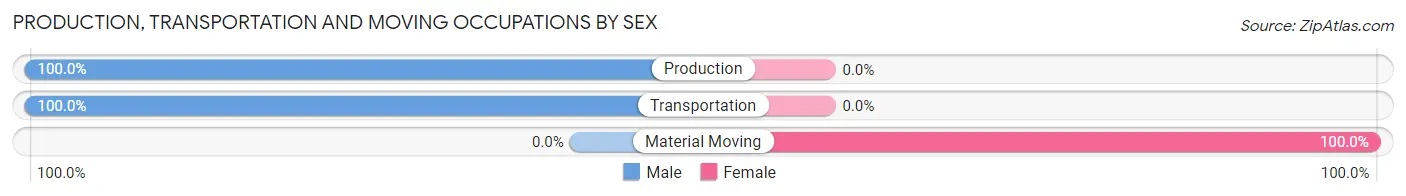
| Occupation | Male | Female |
| Production | 6 (100.0%) | 0 (0.0%) |
| Transportation | 16 (100.0%) | 0 (0.0%) |
| Material Moving | 0 (0.0%) | 2 (100.0%) |
| Total (Category) | 22 (91.7%) | 2 (8.3%) |
| Total (Overall) | 112 (45.9%) | 132 (54.1%) |
Employment Industries by Sex in Summit
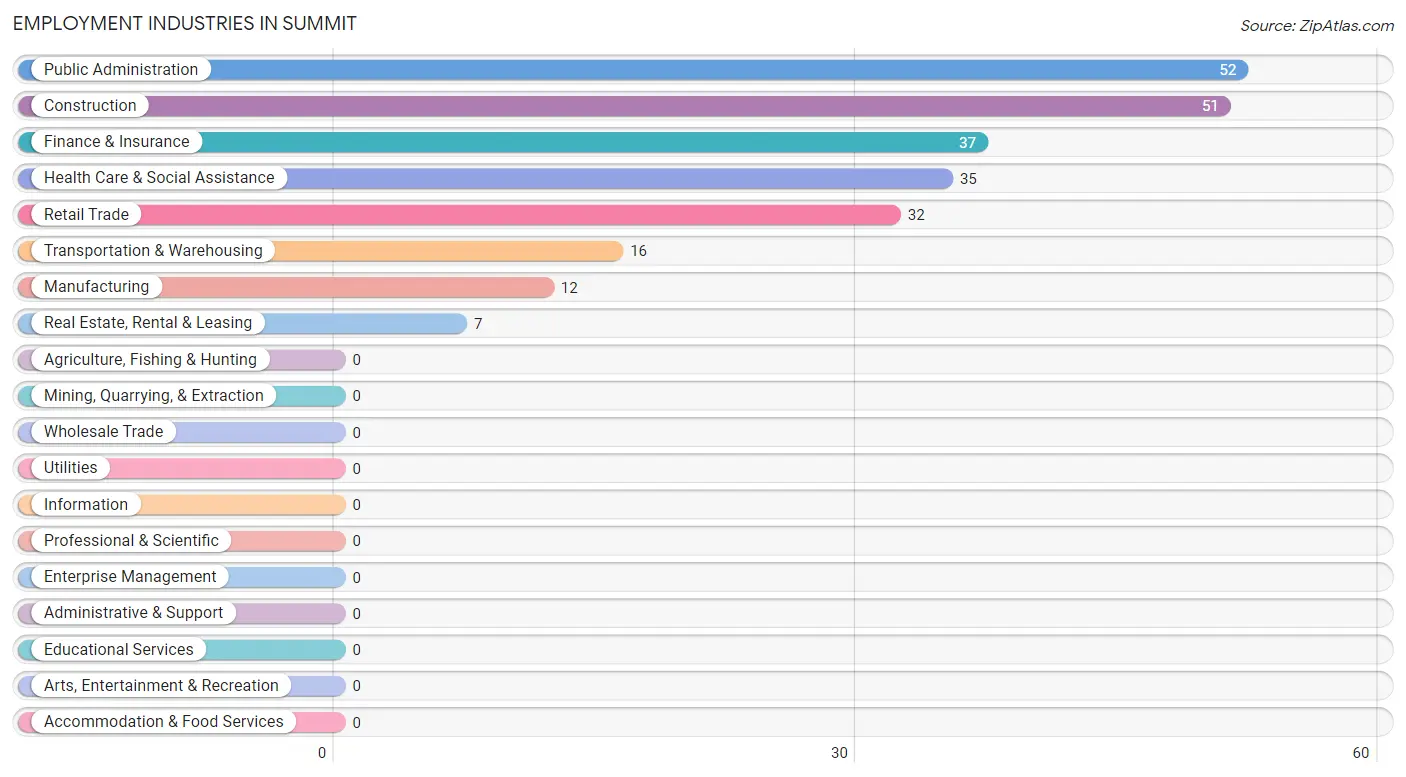
Employment Industries in Summit
The major employment industries in Summit include Public Administration (52 | 21.3%), Construction (51 | 20.9%), Finance & Insurance (37 | 15.2%), Health Care & Social Assistance (35 | 14.3%), and Retail Trade (32 | 13.1%).
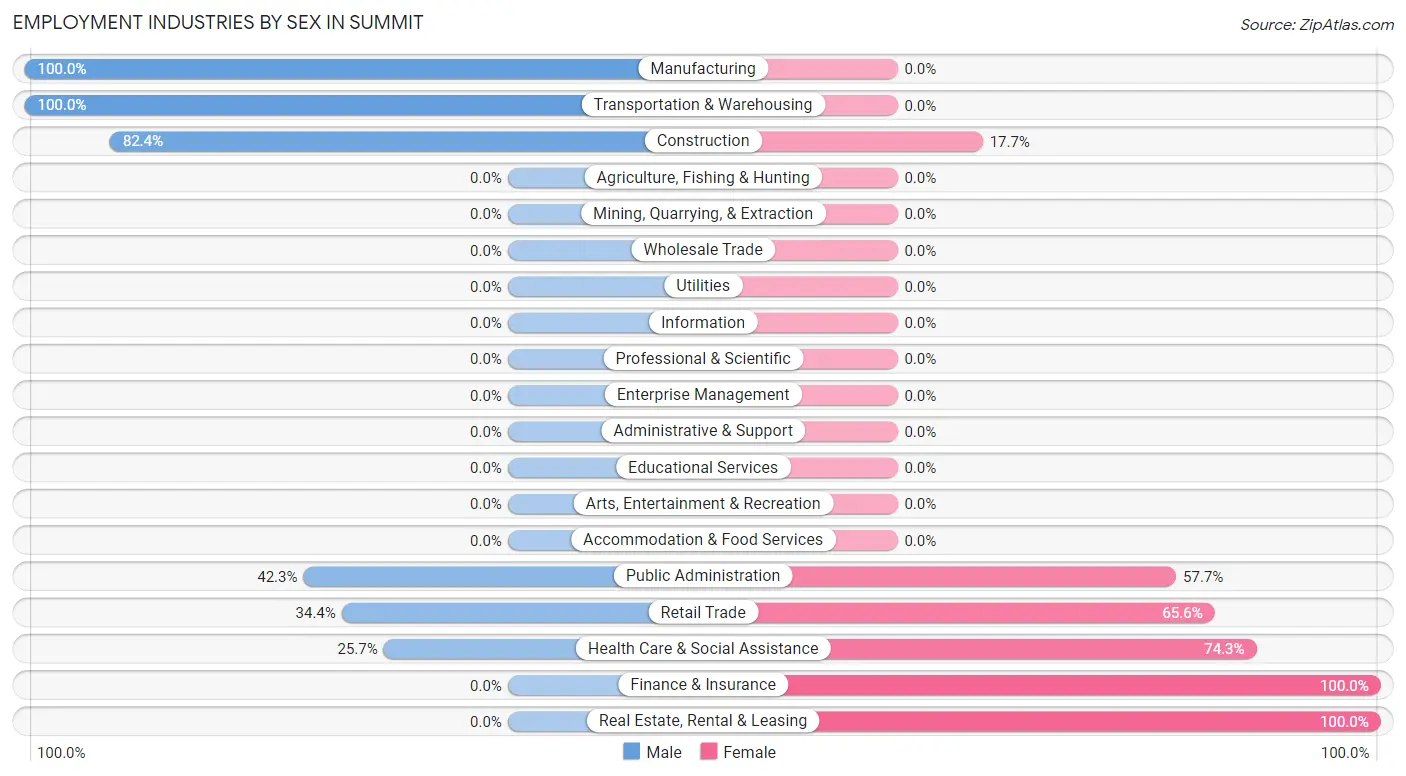
Employment Industries by Sex in Summit
The Summit industries that see more men than women are Manufacturing (100.0%), Transportation & Warehousing (100.0%), and Construction (82.4%), whereas the industries that tend to have a higher number of women are Finance & Insurance (100.0%), Real Estate, Rental & Leasing (100.0%), and Health Care & Social Assistance (74.3%).
| Industry | Male | Female |
| Agriculture, Fishing & Hunting | 0 (0.0%) | 0 (0.0%) |
| Mining, Quarrying, & Extraction | 0 (0.0%) | 0 (0.0%) |
| Construction | 42 (82.4%) | 9 (17.6%) |
| Manufacturing | 12 (100.0%) | 0 (0.0%) |
| Wholesale Trade | 0 (0.0%) | 0 (0.0%) |
| Retail Trade | 11 (34.4%) | 21 (65.6%) |
| Transportation & Warehousing | 16 (100.0%) | 0 (0.0%) |
| Utilities | 0 (0.0%) | 0 (0.0%) |
| Information | 0 (0.0%) | 0 (0.0%) |
| Finance & Insurance | 0 (0.0%) | 37 (100.0%) |
| Real Estate, Rental & Leasing | 0 (0.0%) | 7 (100.0%) |
| Professional & Scientific | 0 (0.0%) | 0 (0.0%) |
| Enterprise Management | 0 (0.0%) | 0 (0.0%) |
| Administrative & Support | 0 (0.0%) | 0 (0.0%) |
| Educational Services | 0 (0.0%) | 0 (0.0%) |
| Health Care & Social Assistance | 9 (25.7%) | 26 (74.3%) |
| Arts, Entertainment & Recreation | 0 (0.0%) | 0 (0.0%) |
| Accommodation & Food Services | 0 (0.0%) | 0 (0.0%) |
| Public Administration | 22 (42.3%) | 30 (57.7%) |
| Total | 112 (45.9%) | 132 (54.1%) |
Education in Summit
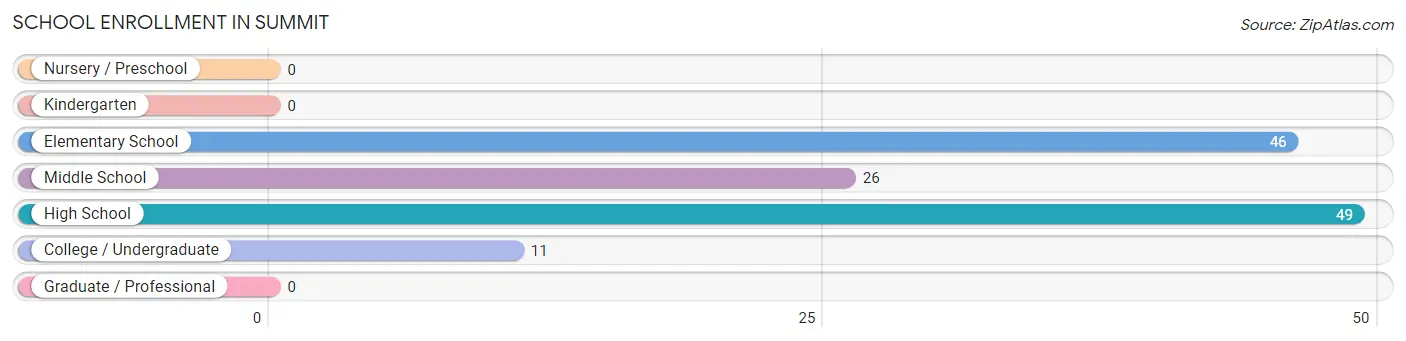
School Enrollment in Summit
The most common levels of schooling among the 132 students in Summit are high school (49 | 37.1%), elementary school (46 | 34.8%), and middle school (26 | 19.7%).
| School Level | # Students | % Students |
| Nursery / Preschool | 0 | 0.0% |
| Kindergarten | 0 | 0.0% |
| Elementary School | 46 | 34.8% |
| Middle School | 26 | 19.7% |
| High School | 49 | 37.1% |
| College / Undergraduate | 11 | 8.3% |
| Graduate / Professional | 0 | 0.0% |
| Total | 132 | 100.0% |
School Enrollment by Age by Funding Source in Summit
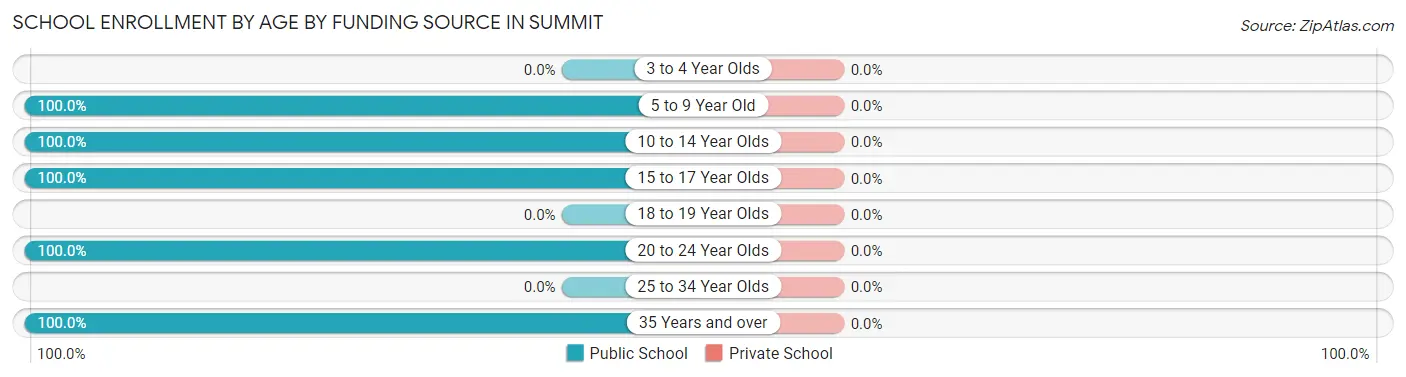
| Age Bracket | Public School | Private School |
| 3 to 4 Year Olds | 0 (0.0%) | 0 (0.0%) |
| 5 to 9 Year Old | 46 (100.0%) | 0 (0.0%) |
| 10 to 14 Year Olds | 45 (100.0%) | 0 (0.0%) |
| 15 to 17 Year Olds | 30 (100.0%) | 0 (0.0%) |
| 18 to 19 Year Olds | 0 (0.0%) | 0 (0.0%) |
| 20 to 24 Year Olds | 6 (100.0%) | 0 (0.0%) |
| 25 to 34 Year Olds | 0 (0.0%) | 0 (0.0%) |
| 35 Years and over | 5 (100.0%) | 0 (0.0%) |
| Total | 132 (100.0%) | 0 (0.0%) |
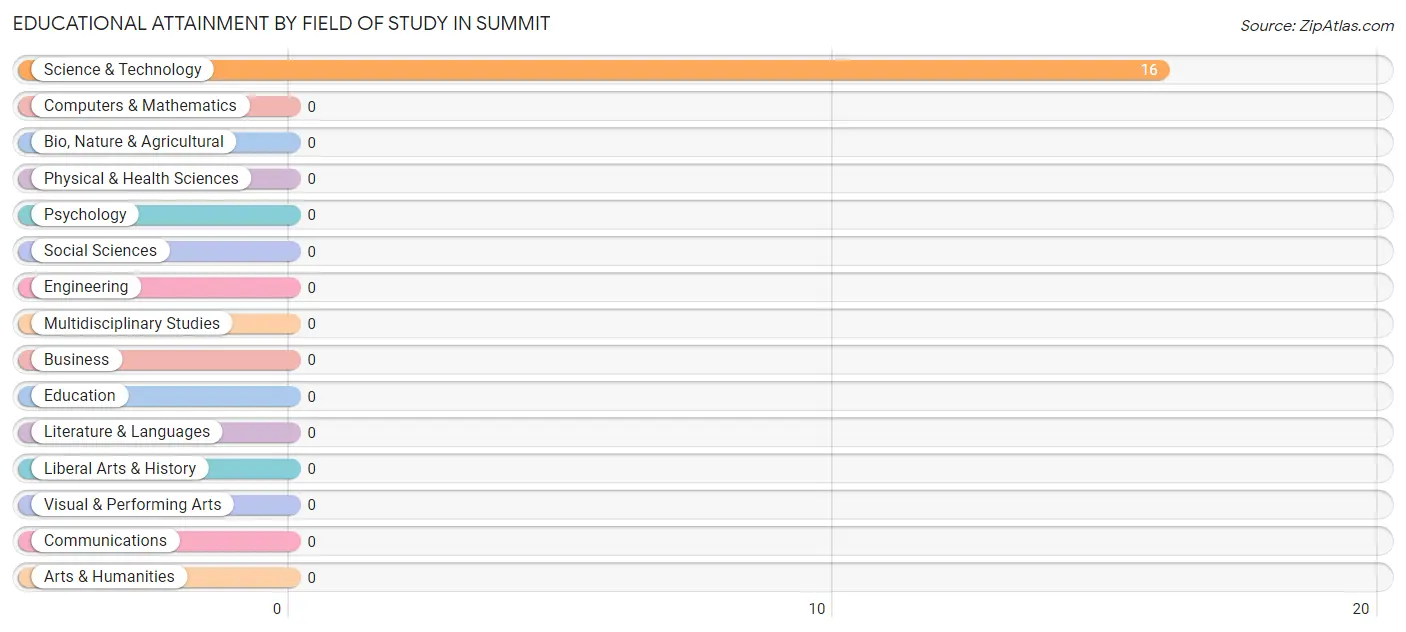
Educational Attainment by Field of Study in Summit
, and science & technology (16 | 100.0%) are the most common fields of study among 16 individuals in Summit who have obtained a bachelor's degree or higher.
| Field of Study | # Graduates | % Graduates |
| Computers & Mathematics | 0 | 0.0% |
| Bio, Nature & Agricultural | 0 | 0.0% |
| Physical & Health Sciences | 0 | 0.0% |
| Psychology | 0 | 0.0% |
| Social Sciences | 0 | 0.0% |
| Engineering | 0 | 0.0% |
| Multidisciplinary Studies | 0 | 0.0% |
| Science & Technology | 16 | 100.0% |
| Business | 0 | 0.0% |
| Education | 0 | 0.0% |
| Literature & Languages | 0 | 0.0% |
| Liberal Arts & History | 0 | 0.0% |
| Visual & Performing Arts | 0 | 0.0% |
| Communications | 0 | 0.0% |
| Arts & Humanities | 0 | 0.0% |
| Total | 16 | 100.0% |
Transportation & Commute in Summit
Vehicle Availability by Sex in Summit
The most prevalent vehicle ownership categories in Summit are males with 4 vehicles (38, accounting for 36.2%) and females with 4 vehicles (56, making up 28.8%).
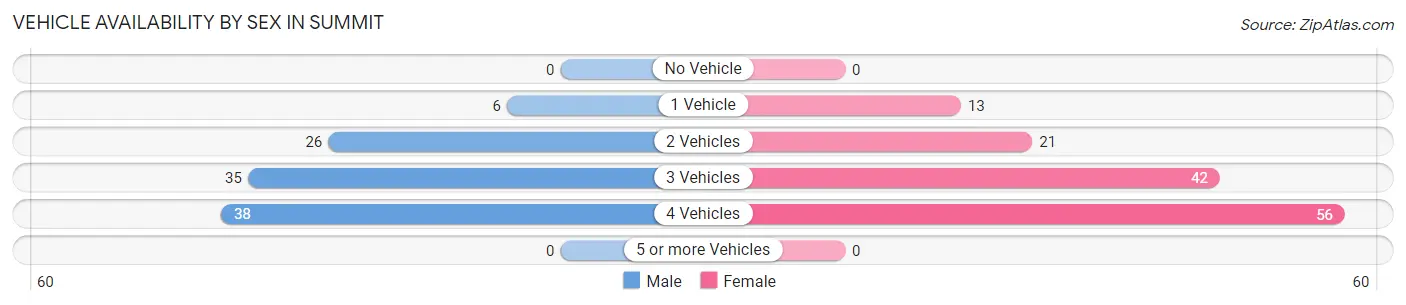
| Vehicles Available | Male | Female |
| No Vehicle | 0 (0.0%) | 0 (0.0%) |
| 1 Vehicle | 6 (5.7%) | 13 (9.9%) |
| 2 Vehicles | 26 (24.8%) | 21 (15.9%) |
| 3 Vehicles | 35 (33.3%) | 42 (31.8%) |
| 4 Vehicles | 38 (36.2%) | 56 (42.4%) |
| 5 or more Vehicles | 0 (0.0%) | 0 (0.0%) |
| Total | 105 (100.0%) | 132 (100.0%) |
Commute Time in Summit
The most frequently occuring commute durations in Summit are less than 5 minutes (142 commuters, 59.9%), 60 to 89 minutes (18 commuters, 7.6%), and 20 to 24 minutes (17 commuters, 7.2%).
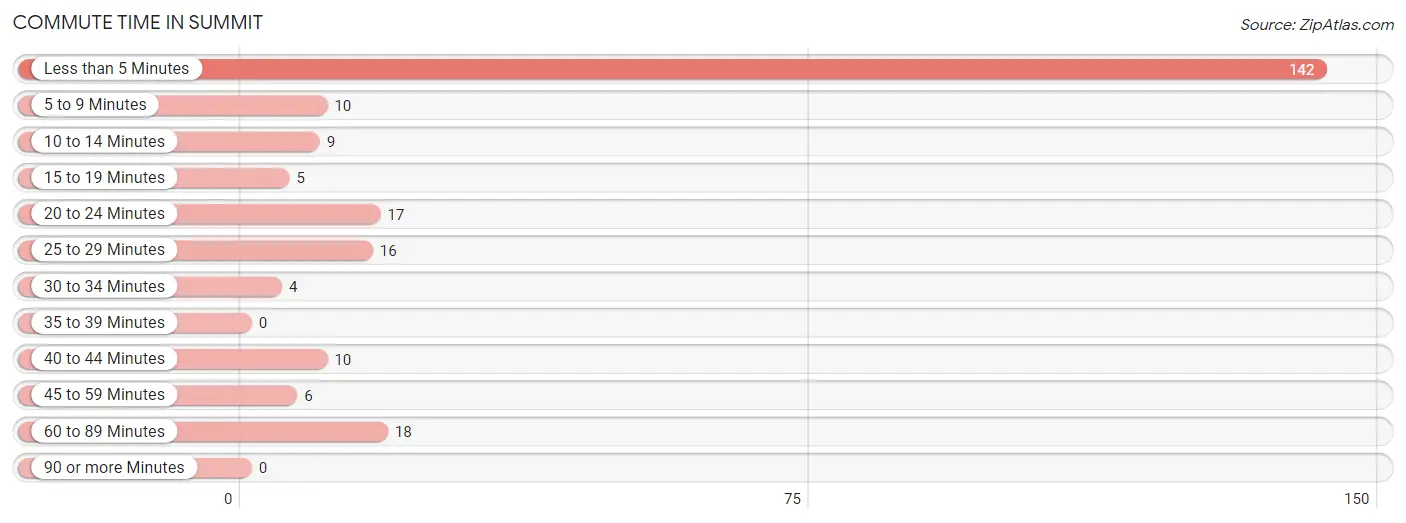
| Commute Time | # Commuters | % Commuters |
| Less than 5 Minutes | 142 | 59.9% |
| 5 to 9 Minutes | 10 | 4.2% |
| 10 to 14 Minutes | 9 | 3.8% |
| 15 to 19 Minutes | 5 | 2.1% |
| 20 to 24 Minutes | 17 | 7.2% |
| 25 to 29 Minutes | 16 | 6.8% |
| 30 to 34 Minutes | 4 | 1.7% |
| 35 to 39 Minutes | 0 | 0.0% |
| 40 to 44 Minutes | 10 | 4.2% |
| 45 to 59 Minutes | 6 | 2.5% |
| 60 to 89 Minutes | 18 | 7.6% |
| 90 or more Minutes | 0 | 0.0% |
Commute Time by Sex in Summit
The most common commute times in Summit are less than 5 minutes (37 commuters, 35.2%) for males and less than 5 minutes (105 commuters, 79.5%) for females.
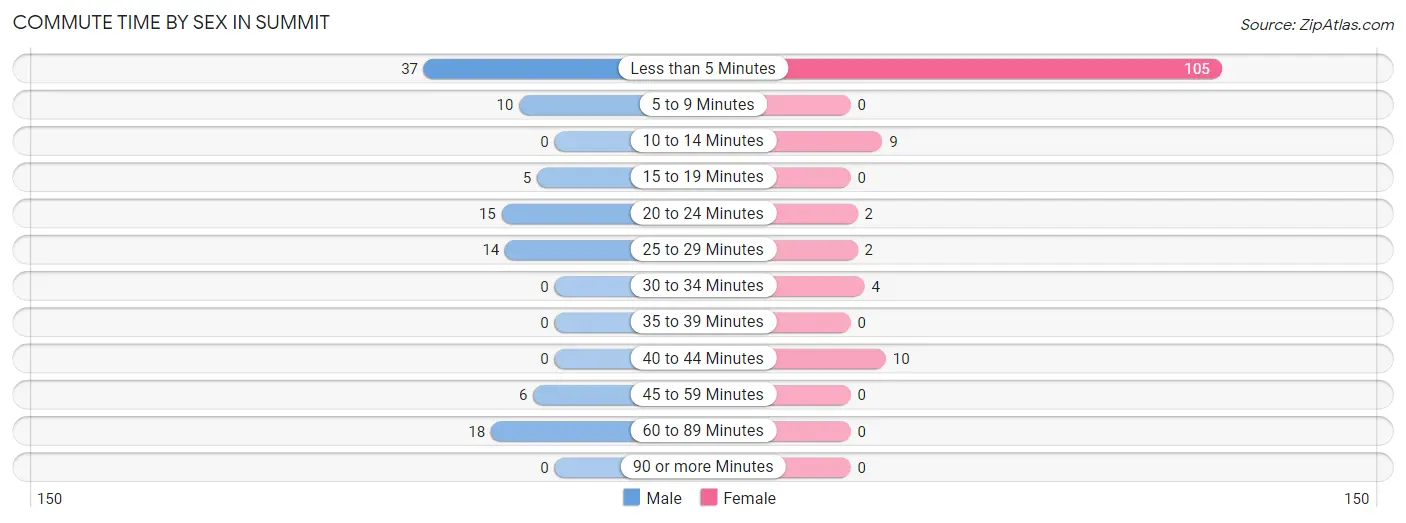
| Commute Time | Male | Female |
| Less than 5 Minutes | 37 (35.2%) | 105 (79.5%) |
| 5 to 9 Minutes | 10 (9.5%) | 0 (0.0%) |
| 10 to 14 Minutes | 0 (0.0%) | 9 (6.8%) |
| 15 to 19 Minutes | 5 (4.8%) | 0 (0.0%) |
| 20 to 24 Minutes | 15 (14.3%) | 2 (1.5%) |
| 25 to 29 Minutes | 14 (13.3%) | 2 (1.5%) |
| 30 to 34 Minutes | 0 (0.0%) | 4 (3.0%) |
| 35 to 39 Minutes | 0 (0.0%) | 0 (0.0%) |
| 40 to 44 Minutes | 0 (0.0%) | 10 (7.6%) |
| 45 to 59 Minutes | 6 (5.7%) | 0 (0.0%) |
| 60 to 89 Minutes | 18 (17.1%) | 0 (0.0%) |
| 90 or more Minutes | 0 (0.0%) | 0 (0.0%) |
Time of Departure to Work by Sex in Summit
The most frequent times of departure to work in Summit are 6:00 AM to 6:29 AM (27, 25.7%) for males and 8:00 AM to 8:29 AM (51, 38.6%) for females.
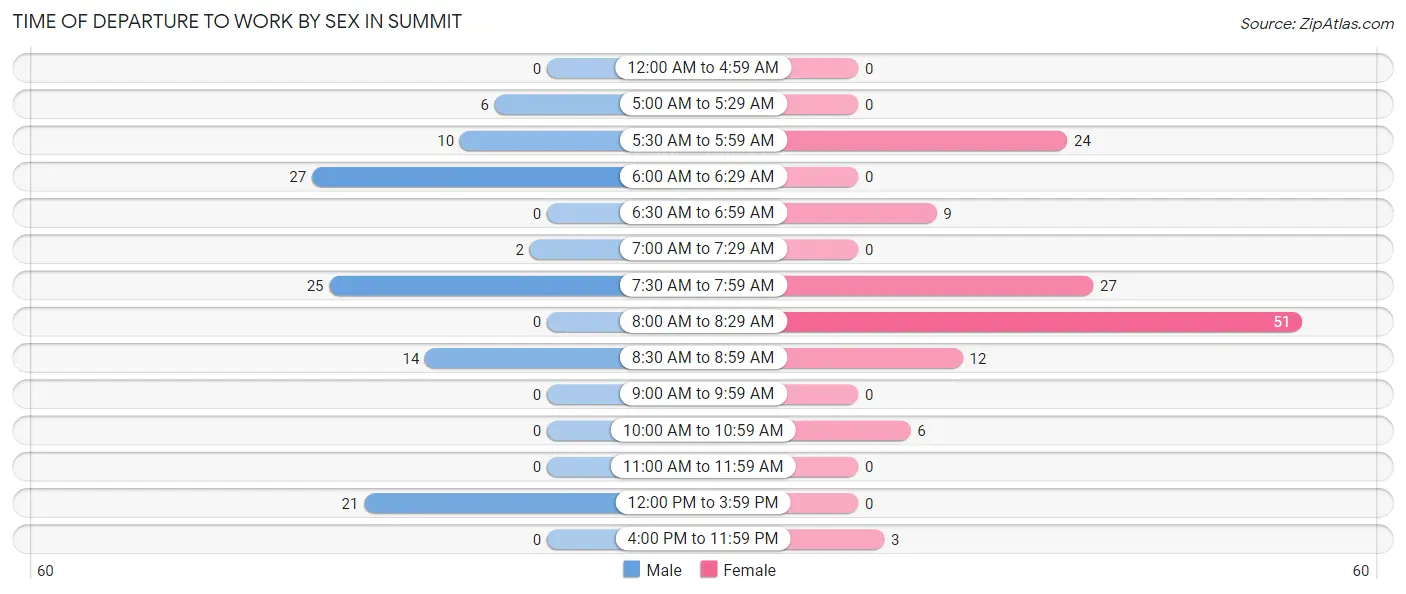
| Time of Departure | Male | Female |
| 12:00 AM to 4:59 AM | 0 (0.0%) | 0 (0.0%) |
| 5:00 AM to 5:29 AM | 6 (5.7%) | 0 (0.0%) |
| 5:30 AM to 5:59 AM | 10 (9.5%) | 24 (18.2%) |
| 6:00 AM to 6:29 AM | 27 (25.7%) | 0 (0.0%) |
| 6:30 AM to 6:59 AM | 0 (0.0%) | 9 (6.8%) |
| 7:00 AM to 7:29 AM | 2 (1.9%) | 0 (0.0%) |
| 7:30 AM to 7:59 AM | 25 (23.8%) | 27 (20.4%) |
| 8:00 AM to 8:29 AM | 0 (0.0%) | 51 (38.6%) |
| 8:30 AM to 8:59 AM | 14 (13.3%) | 12 (9.1%) |
| 9:00 AM to 9:59 AM | 0 (0.0%) | 0 (0.0%) |
| 10:00 AM to 10:59 AM | 0 (0.0%) | 6 (4.5%) |
| 11:00 AM to 11:59 AM | 0 (0.0%) | 0 (0.0%) |
| 12:00 PM to 3:59 PM | 21 (20.0%) | 0 (0.0%) |
| 4:00 PM to 11:59 PM | 0 (0.0%) | 3 (2.3%) |
| Total | 105 (100.0%) | 132 (100.0%) |
Housing Occupancy in Summit
Occupancy by Ownership in Summit
Of the total 158 dwellings in Summit, owner-occupied units account for 112 (70.9%), while renter-occupied units make up 46 (29.1%).
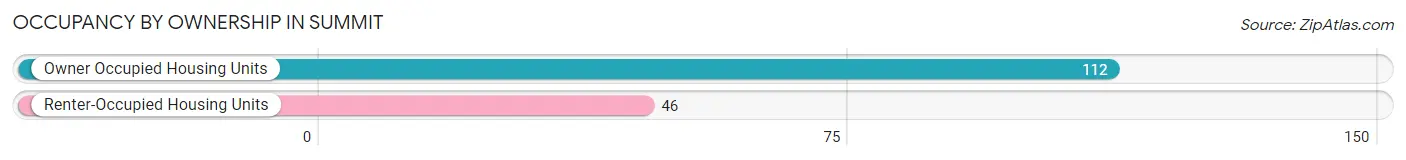
| Occupancy | # Housing Units | % Housing Units |
| Owner Occupied Housing Units | 112 | 70.9% |
| Renter-Occupied Housing Units | 46 | 29.1% |
| Total Occupied Housing Units | 158 | 100.0% |
Occupancy by Household Size in Summit
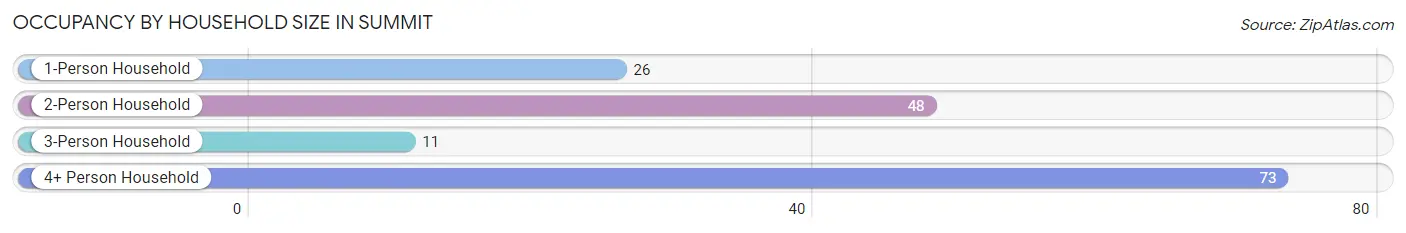
| Household Size | # Housing Units | % Housing Units |
| 1-Person Household | 26 | 16.5% |
| 2-Person Household | 48 | 30.4% |
| 3-Person Household | 11 | 7.0% |
| 4+ Person Household | 73 | 46.2% |
| Total Housing Units | 158 | 100.0% |
Occupancy by Ownership by Household Size in Summit
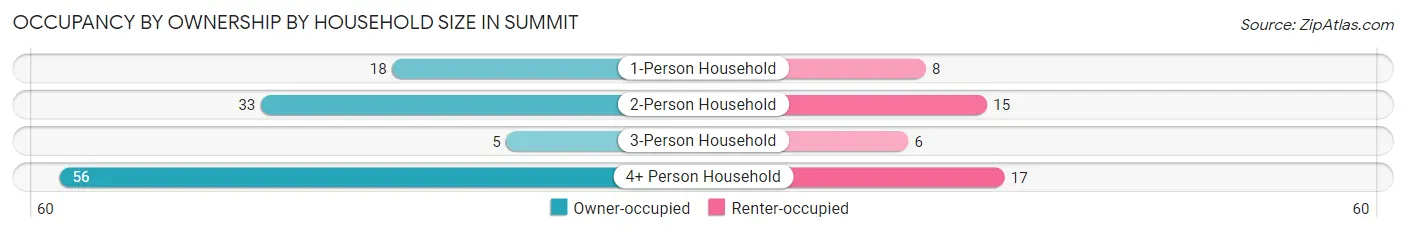
| Household Size | Owner-occupied | Renter-occupied |
| 1-Person Household | 18 (69.2%) | 8 (30.8%) |
| 2-Person Household | 33 (68.8%) | 15 (31.2%) |
| 3-Person Household | 5 (45.5%) | 6 (54.5%) |
| 4+ Person Household | 56 (76.7%) | 17 (23.3%) |
| Total Housing Units | 112 (70.9%) | 46 (29.1%) |
Occupancy by Educational Attainment in Summit
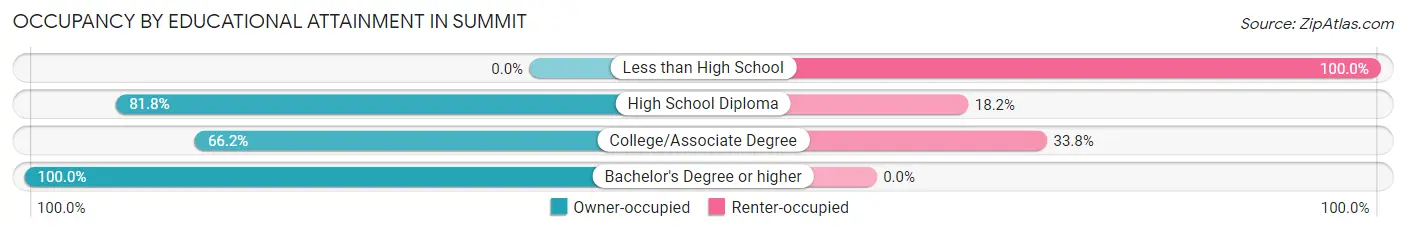
| Household Size | Owner-occupied | Renter-occupied |
| Less than High School | 0 (0.0%) | 9 (100.0%) |
| High School Diploma | 54 (81.8%) | 12 (18.2%) |
| College/Associate Degree | 49 (66.2%) | 25 (33.8%) |
| Bachelor's Degree or higher | 9 (100.0%) | 0 (0.0%) |
Occupancy by Age of Householder in Summit
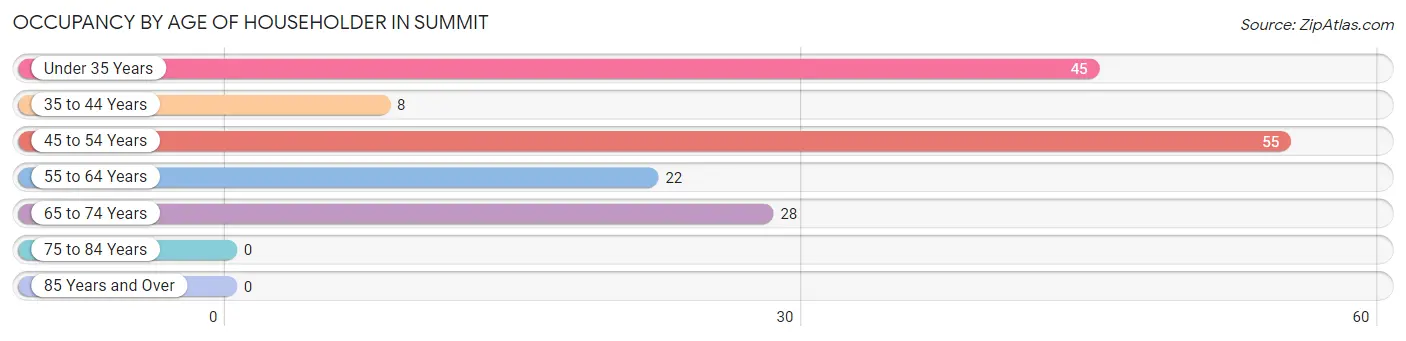
| Age Bracket | # Households | % Households |
| Under 35 Years | 45 | 28.5% |
| 35 to 44 Years | 8 | 5.1% |
| 45 to 54 Years | 55 | 34.8% |
| 55 to 64 Years | 22 | 13.9% |
| 65 to 74 Years | 28 | 17.7% |
| 75 to 84 Years | 0 | 0.0% |
| 85 Years and Over | 0 | 0.0% |
| Total | 158 | 100.0% |
Housing Finances in Summit
Median Income by Occupancy in Summit
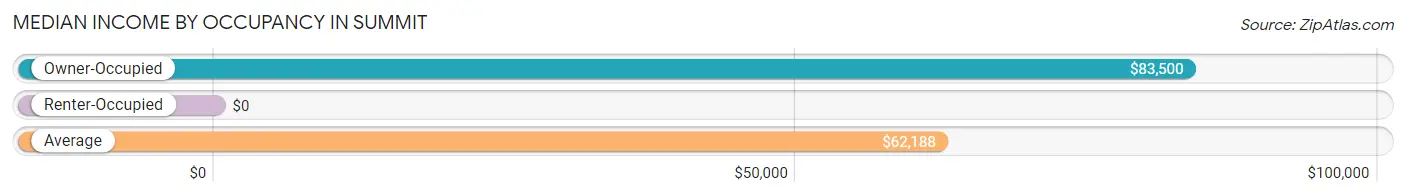
| Occupancy Type | # Households | Median Income |
| Owner-Occupied | 112 (70.9%) | $83,500 |
| Renter-Occupied | 46 (29.1%) | $0 |
| Average | 158 (100.0%) | $62,188 |
Occupancy by Householder Income Bracket in Summit
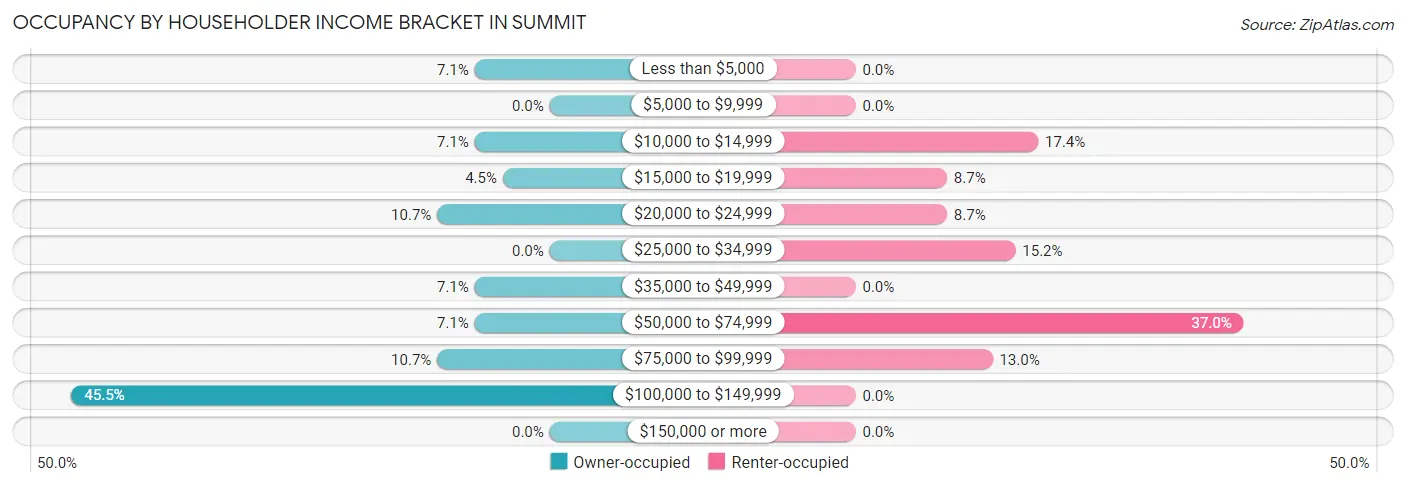
| Income Bracket | Owner-occupied | Renter-occupied |
| Less than $5,000 | 8 (7.1%) | 0 (0.0%) |
| $5,000 to $9,999 | 0 (0.0%) | 0 (0.0%) |
| $10,000 to $14,999 | 8 (7.1%) | 8 (17.4%) |
| $15,000 to $19,999 | 5 (4.5%) | 4 (8.7%) |
| $20,000 to $24,999 | 12 (10.7%) | 4 (8.7%) |
| $25,000 to $34,999 | 0 (0.0%) | 7 (15.2%) |
| $35,000 to $49,999 | 8 (7.1%) | 0 (0.0%) |
| $50,000 to $74,999 | 8 (7.1%) | 17 (37.0%) |
| $75,000 to $99,999 | 12 (10.7%) | 6 (13.0%) |
| $100,000 to $149,999 | 51 (45.5%) | 0 (0.0%) |
| $150,000 or more | 0 (0.0%) | 0 (0.0%) |
| Total | 112 (100.0%) | 46 (100.0%) |
Monthly Housing Cost Tiers in Summit
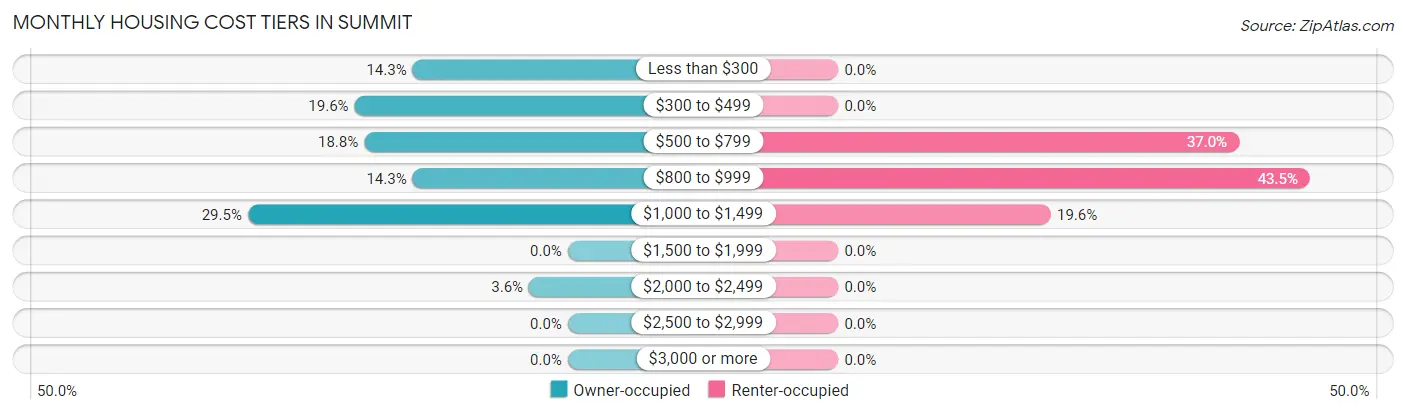
| Monthly Cost | Owner-occupied | Renter-occupied |
| Less than $300 | 16 (14.3%) | 0 (0.0%) |
| $300 to $499 | 22 (19.6%) | 0 (0.0%) |
| $500 to $799 | 21 (18.8%) | 17 (37.0%) |
| $800 to $999 | 16 (14.3%) | 20 (43.5%) |
| $1,000 to $1,499 | 33 (29.5%) | 9 (19.6%) |
| $1,500 to $1,999 | 0 (0.0%) | 0 (0.0%) |
| $2,000 to $2,499 | 4 (3.6%) | 0 (0.0%) |
| $2,500 to $2,999 | 0 (0.0%) | 0 (0.0%) |
| $3,000 or more | 0 (0.0%) | 0 (0.0%) |
| Total | 112 (100.0%) | 46 (100.0%) |
Physical Housing Characteristics in Summit
Housing Structures in Summit
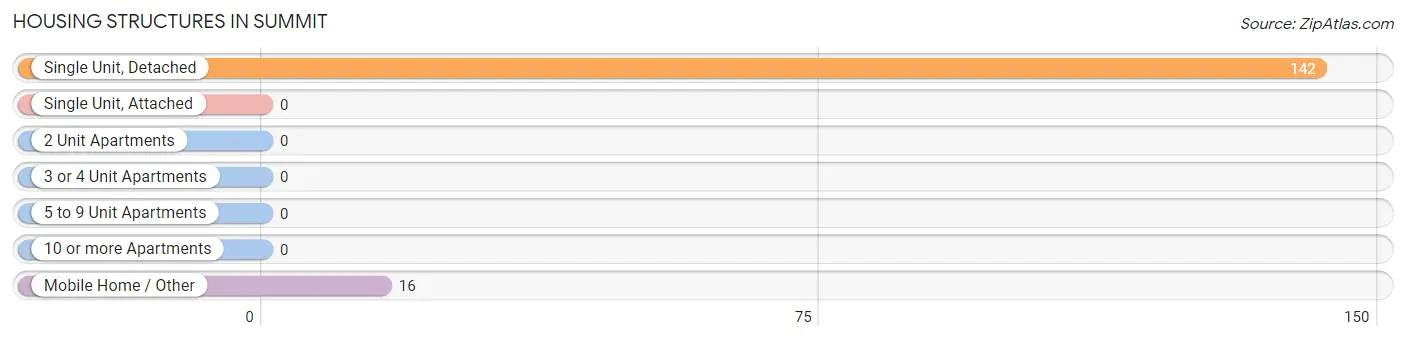
| Structure Type | # Housing Units | % Housing Units |
| Single Unit, Detached | 142 | 89.9% |
| Single Unit, Attached | 0 | 0.0% |
| 2 Unit Apartments | 0 | 0.0% |
| 3 or 4 Unit Apartments | 0 | 0.0% |
| 5 to 9 Unit Apartments | 0 | 0.0% |
| 10 or more Apartments | 0 | 0.0% |
| Mobile Home / Other | 16 | 10.1% |
| Total | 158 | 100.0% |
Housing Structures by Occupancy in Summit
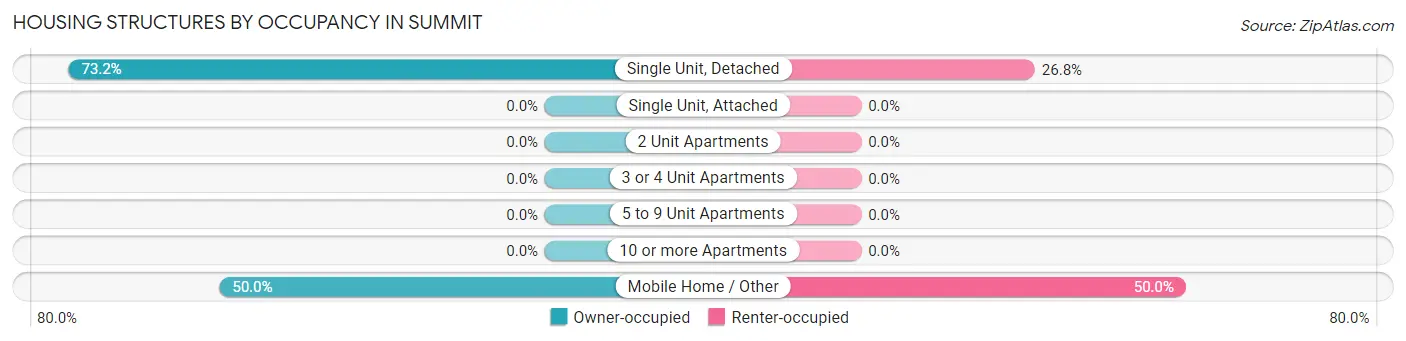
| Structure Type | Owner-occupied | Renter-occupied |
| Single Unit, Detached | 104 (73.2%) | 38 (26.8%) |
| Single Unit, Attached | 0 (0.0%) | 0 (0.0%) |
| 2 Unit Apartments | 0 (0.0%) | 0 (0.0%) |
| 3 or 4 Unit Apartments | 0 (0.0%) | 0 (0.0%) |
| 5 to 9 Unit Apartments | 0 (0.0%) | 0 (0.0%) |
| 10 or more Apartments | 0 (0.0%) | 0 (0.0%) |
| Mobile Home / Other | 8 (50.0%) | 8 (50.0%) |
| Total | 112 (70.9%) | 46 (29.1%) |
Housing Structures by Number of Rooms in Summit
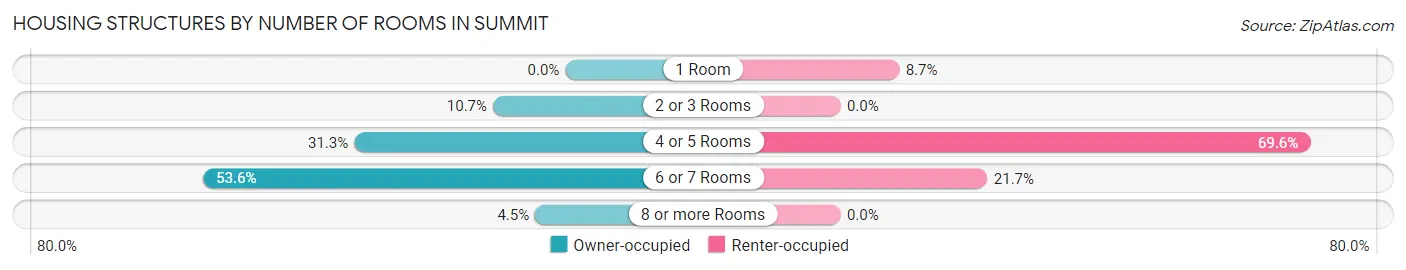
| Number of Rooms | Owner-occupied | Renter-occupied |
| 1 Room | 0 (0.0%) | 4 (8.7%) |
| 2 or 3 Rooms | 12 (10.7%) | 0 (0.0%) |
| 4 or 5 Rooms | 35 (31.2%) | 32 (69.6%) |
| 6 or 7 Rooms | 60 (53.6%) | 10 (21.7%) |
| 8 or more Rooms | 5 (4.5%) | 0 (0.0%) |
| Total | 112 (100.0%) | 46 (100.0%) |
Housing Structure by Heating Type in Summit
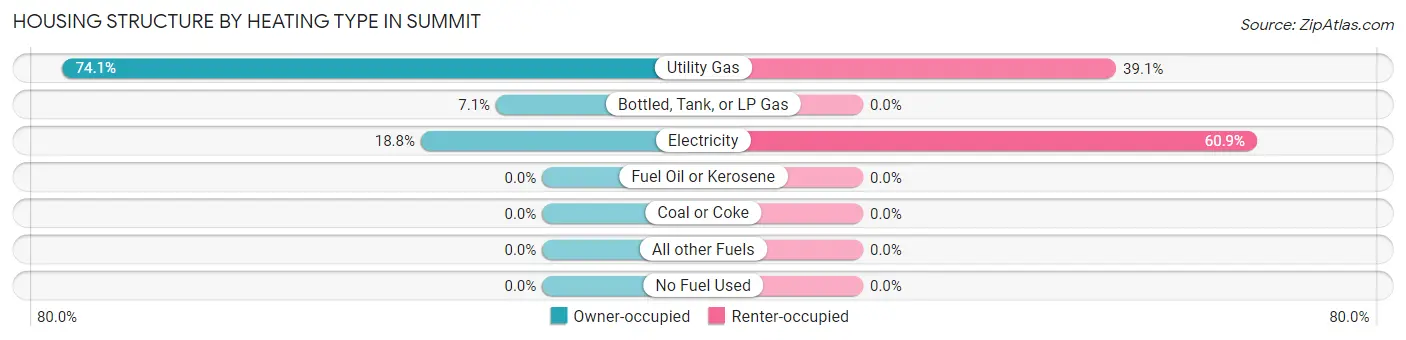
| Heating Type | Owner-occupied | Renter-occupied |
| Utility Gas | 83 (74.1%) | 18 (39.1%) |
| Bottled, Tank, or LP Gas | 8 (7.1%) | 0 (0.0%) |
| Electricity | 21 (18.8%) | 28 (60.9%) |
| Fuel Oil or Kerosene | 0 (0.0%) | 0 (0.0%) |
| Coal or Coke | 0 (0.0%) | 0 (0.0%) |
| All other Fuels | 0 (0.0%) | 0 (0.0%) |
| No Fuel Used | 0 (0.0%) | 0 (0.0%) |
| Total | 112 (100.0%) | 46 (100.0%) |
Household Vehicle Usage in Summit
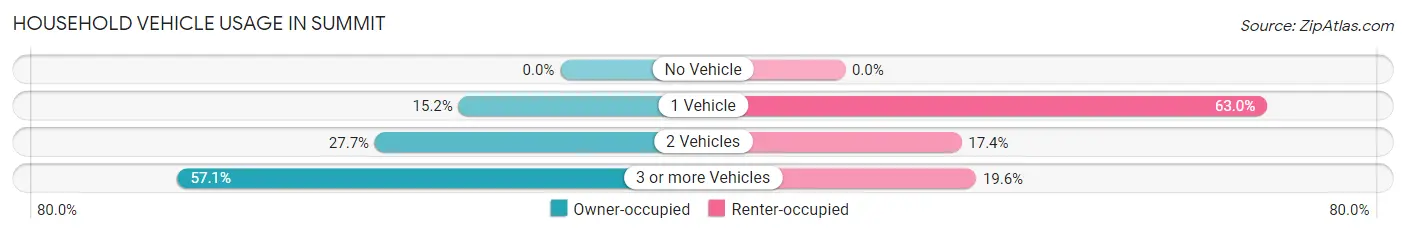
| Vehicles per Household | Owner-occupied | Renter-occupied |
| No Vehicle | 0 (0.0%) | 0 (0.0%) |
| 1 Vehicle | 17 (15.2%) | 29 (63.0%) |
| 2 Vehicles | 31 (27.7%) | 8 (17.4%) |
| 3 or more Vehicles | 64 (57.1%) | 9 (19.6%) |
| Total | 112 (100.0%) | 46 (100.0%) |
Real Estate & Mortgages in Summit
Real Estate and Mortgage Overview in Summit
| Characteristic | Without Mortgage | With Mortgage |
| Housing Units | 44 | 68 |
| Median Property Value | - | - |
| Median Household Income | $23,750 | $0 |
| Monthly Housing Costs | $356 | $0 |
| Real Estate Taxes | $333 | $7 |
Property Value by Mortgage Status in Summit
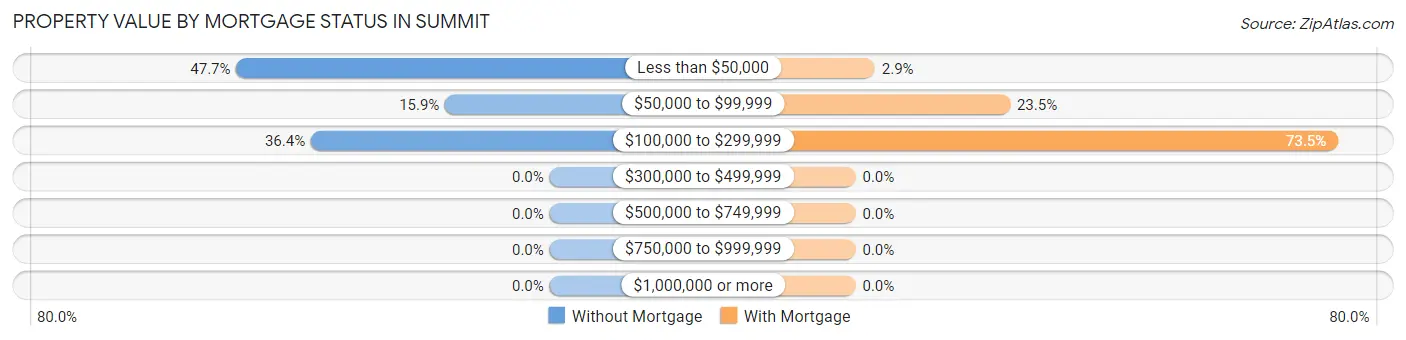
| Property Value | Without Mortgage | With Mortgage |
| Less than $50,000 | 21 (47.7%) | 2 (2.9%) |
| $50,000 to $99,999 | 7 (15.9%) | 16 (23.5%) |
| $100,000 to $299,999 | 16 (36.4%) | 50 (73.5%) |
| $300,000 to $499,999 | 0 (0.0%) | 0 (0.0%) |
| $500,000 to $749,999 | 0 (0.0%) | 0 (0.0%) |
| $750,000 to $999,999 | 0 (0.0%) | 0 (0.0%) |
| $1,000,000 or more | 0 (0.0%) | 0 (0.0%) |
| Total | 44 (100.0%) | 68 (100.0%) |
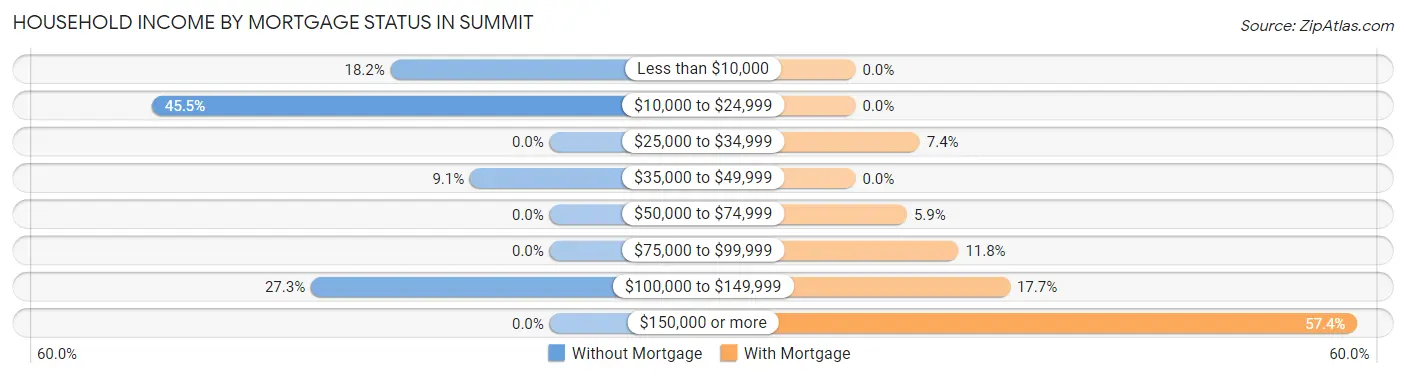
Household Income by Mortgage Status in Summit
| Household Income | Without Mortgage | With Mortgage |
| Less than $10,000 | 8 (18.2%) | 0 (0.0%) |
| $10,000 to $24,999 | 20 (45.5%) | 0 (0.0%) |
| $25,000 to $34,999 | 0 (0.0%) | 5 (7.3%) |
| $35,000 to $49,999 | 4 (9.1%) | 0 (0.0%) |
| $50,000 to $74,999 | 0 (0.0%) | 4 (5.9%) |
| $75,000 to $99,999 | 0 (0.0%) | 8 (11.8%) |
| $100,000 to $149,999 | 12 (27.3%) | 12 (17.6%) |
| $150,000 or more | 0 (0.0%) | 39 (57.4%) |
| Total | 44 (100.0%) | 68 (100.0%) |
Property Value to Household Income Ratio in Summit
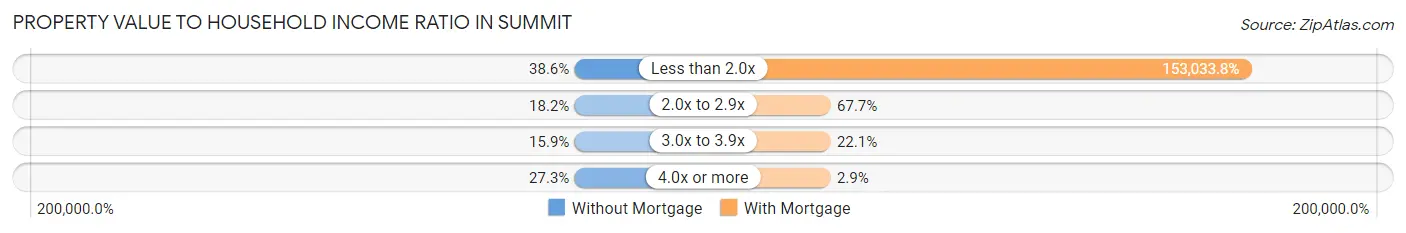
| Value-to-Income Ratio | Without Mortgage | With Mortgage |
| Less than 2.0x | 17 (38.6%) | 104,063 (153,033.8%) |
| 2.0x to 2.9x | 8 (18.2%) | 46 (67.6%) |
| 3.0x to 3.9x | 7 (15.9%) | 15 (22.1%) |
| 4.0x or more | 12 (27.3%) | 2 (2.9%) |
| Total | 44 (100.0%) | 68 (100.0%) |
Real Estate Taxes by Mortgage Status in Summit
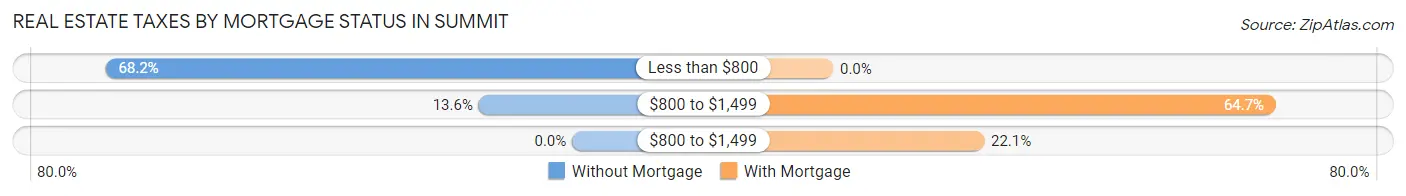
| Property Taxes | Without Mortgage | With Mortgage |
| Less than $800 | 30 (68.2%) | 0 (0.0%) |
| $800 to $1,499 | 6 (13.6%) | 44 (64.7%) |
| $800 to $1,499 | 0 (0.0%) | 15 (22.1%) |
| Total | 44 (100.0%) | 68 (100.0%) |
Health & Disability in Summit
Health Insurance Coverage by Age in Summit
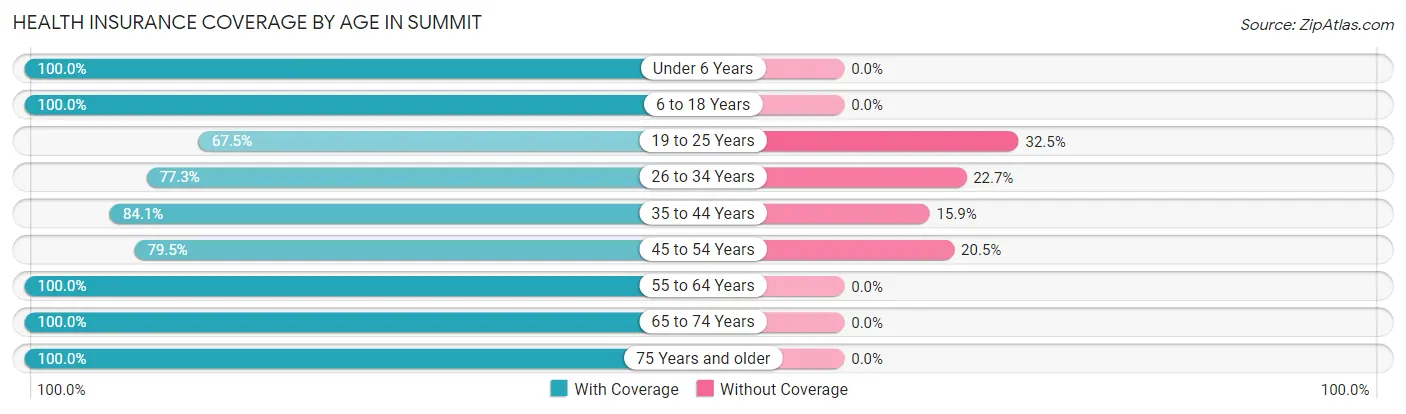
| Age Bracket | With Coverage | Without Coverage |
| Under 6 Years | 47 (100.0%) | 0 (0.0%) |
| 6 to 18 Years | 128 (100.0%) | 0 (0.0%) |
| 19 to 25 Years | 27 (67.5%) | 13 (32.5%) |
| 26 to 34 Years | 51 (77.3%) | 15 (22.7%) |
| 35 to 44 Years | 37 (84.1%) | 7 (15.9%) |
| 45 to 54 Years | 97 (79.5%) | 25 (20.5%) |
| 55 to 64 Years | 59 (100.0%) | 0 (0.0%) |
| 65 to 74 Years | 44 (100.0%) | 0 (0.0%) |
| 75 Years and older | 5 (100.0%) | 0 (0.0%) |
| Total | 495 (89.2%) | 60 (10.8%) |
Health Insurance Coverage by Citizenship Status in Summit
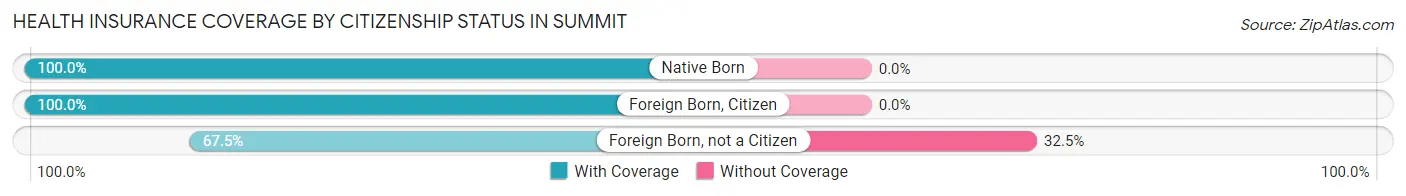
| Citizenship Status | With Coverage | Without Coverage |
| Native Born | 47 (100.0%) | 0 (0.0%) |
| Foreign Born, Citizen | 128 (100.0%) | 0 (0.0%) |
| Foreign Born, not a Citizen | 27 (67.5%) | 13 (32.5%) |
Health Insurance Coverage by Household Income in Summit
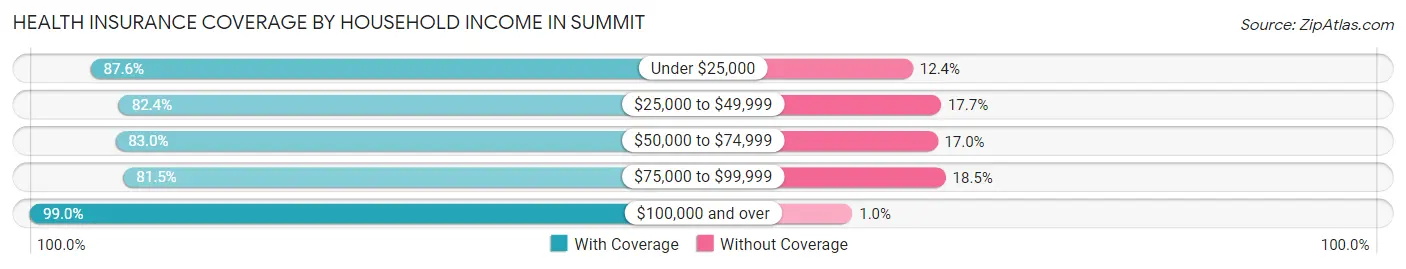
| Household Income | With Coverage | Without Coverage |
| Under $25,000 | 92 (87.6%) | 13 (12.4%) |
| $25,000 to $49,999 | 56 (82.4%) | 12 (17.6%) |
| $50,000 to $74,999 | 88 (83.0%) | 18 (17.0%) |
| $75,000 to $99,999 | 66 (81.5%) | 15 (18.5%) |
| $100,000 and over | 193 (99.0%) | 2 (1.0%) |
Public vs Private Health Insurance Coverage by Age in Summit
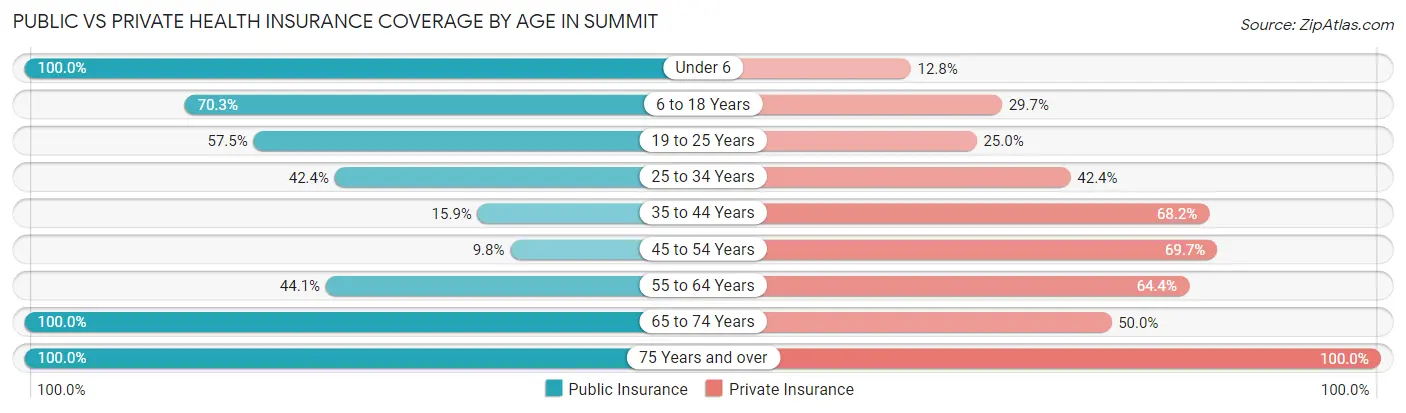
| Age Bracket | Public Insurance | Private Insurance |
| Under 6 | 47 (100.0%) | 6 (12.8%) |
| 6 to 18 Years | 90 (70.3%) | 38 (29.7%) |
| 19 to 25 Years | 23 (57.5%) | 10 (25.0%) |
| 25 to 34 Years | 28 (42.4%) | 28 (42.4%) |
| 35 to 44 Years | 7 (15.9%) | 30 (68.2%) |
| 45 to 54 Years | 12 (9.8%) | 85 (69.7%) |
| 55 to 64 Years | 26 (44.1%) | 38 (64.4%) |
| 65 to 74 Years | 44 (100.0%) | 22 (50.0%) |
| 75 Years and over | 5 (100.0%) | 5 (100.0%) |
| Total | 282 (50.8%) | 262 (47.2%) |
Disability Status by Sex by Age in Summit
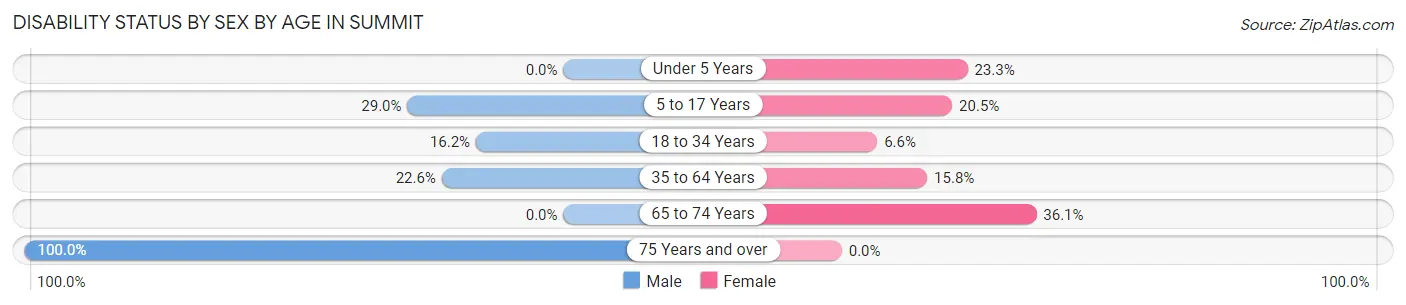
| Age Bracket | Male | Female |
| Under 5 Years | 0 (0.0%) | 7 (23.3%) |
| 5 to 17 Years | 11 (28.9%) | 17 (20.5%) |
| 18 to 34 Years | 6 (16.2%) | 5 (6.6%) |
| 35 to 64 Years | 28 (22.6%) | 16 (15.8%) |
| 65 to 74 Years | 0 (0.0%) | 13 (36.1%) |
| 75 Years and over | 5 (100.0%) | 0 (0.0%) |
Disability Class by Sex by Age in Summit
Disability Class: Hearing Difficulty
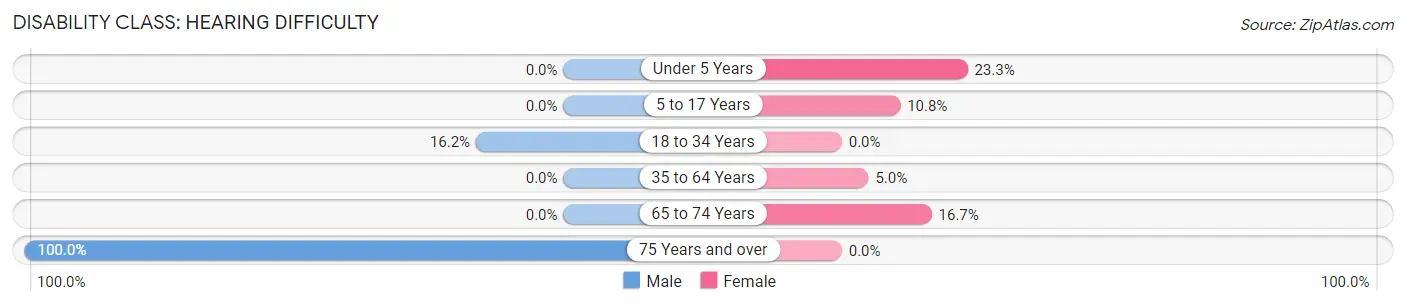
| Age Bracket | Male | Female |
| Under 5 Years | 0 (0.0%) | 7 (23.3%) |
| 5 to 17 Years | 0 (0.0%) | 9 (10.8%) |
| 18 to 34 Years | 6 (16.2%) | 0 (0.0%) |
| 35 to 64 Years | 0 (0.0%) | 5 (5.0%) |
| 65 to 74 Years | 0 (0.0%) | 6 (16.7%) |
| 75 Years and over | 5 (100.0%) | 0 (0.0%) |
Disability Class: Vision Difficulty
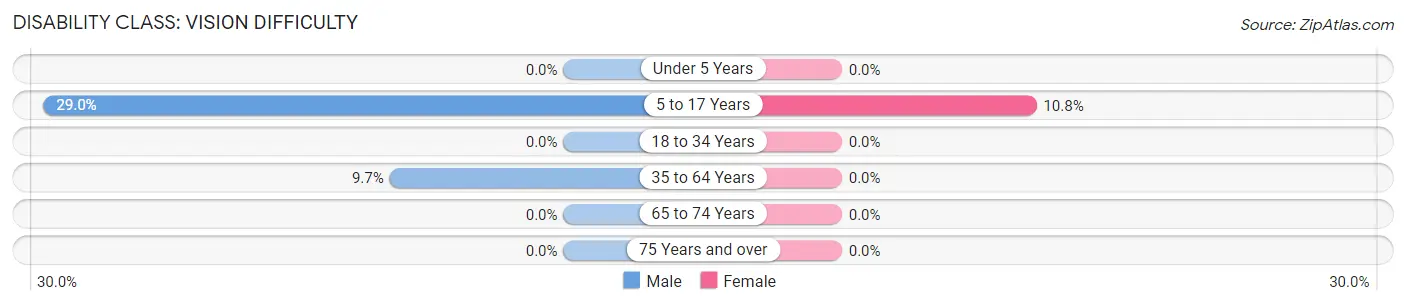
| Age Bracket | Male | Female |
| Under 5 Years | 0 (0.0%) | 0 (0.0%) |
| 5 to 17 Years | 11 (28.9%) | 9 (10.8%) |
| 18 to 34 Years | 0 (0.0%) | 0 (0.0%) |
| 35 to 64 Years | 12 (9.7%) | 0 (0.0%) |
| 65 to 74 Years | 0 (0.0%) | 0 (0.0%) |
| 75 Years and over | 0 (0.0%) | 0 (0.0%) |
Disability Class: Cognitive Difficulty
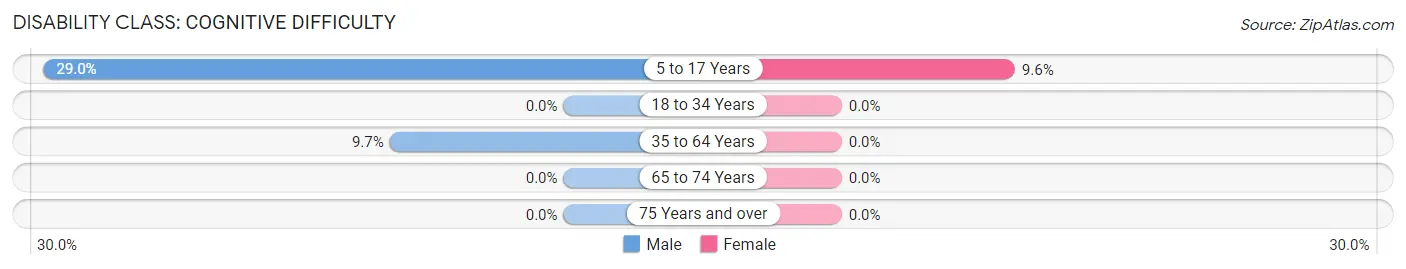
| Age Bracket | Male | Female |
| 5 to 17 Years | 11 (28.9%) | 8 (9.6%) |
| 18 to 34 Years | 0 (0.0%) | 0 (0.0%) |
| 35 to 64 Years | 12 (9.7%) | 0 (0.0%) |
| 65 to 74 Years | 0 (0.0%) | 0 (0.0%) |
| 75 Years and over | 0 (0.0%) | 0 (0.0%) |
Disability Class: Ambulatory Difficulty
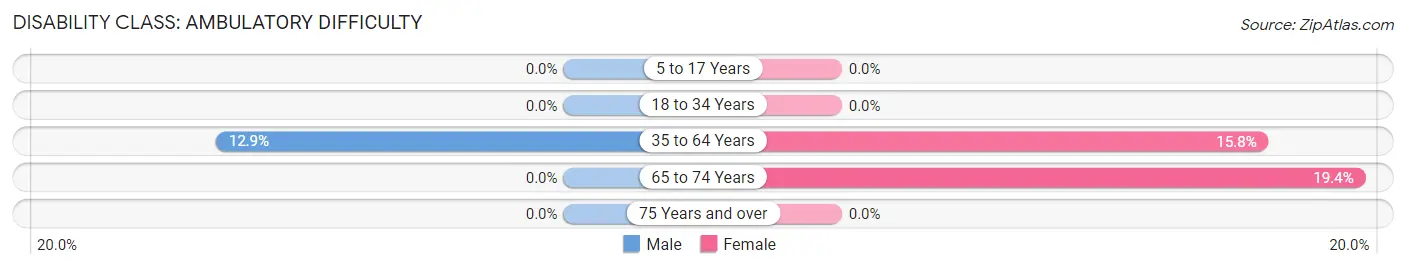
| Age Bracket | Male | Female |
| 5 to 17 Years | 0 (0.0%) | 0 (0.0%) |
| 18 to 34 Years | 0 (0.0%) | 0 (0.0%) |
| 35 to 64 Years | 16 (12.9%) | 16 (15.8%) |
| 65 to 74 Years | 0 (0.0%) | 7 (19.4%) |
| 75 Years and over | 0 (0.0%) | 0 (0.0%) |
Disability Class: Self-Care Difficulty
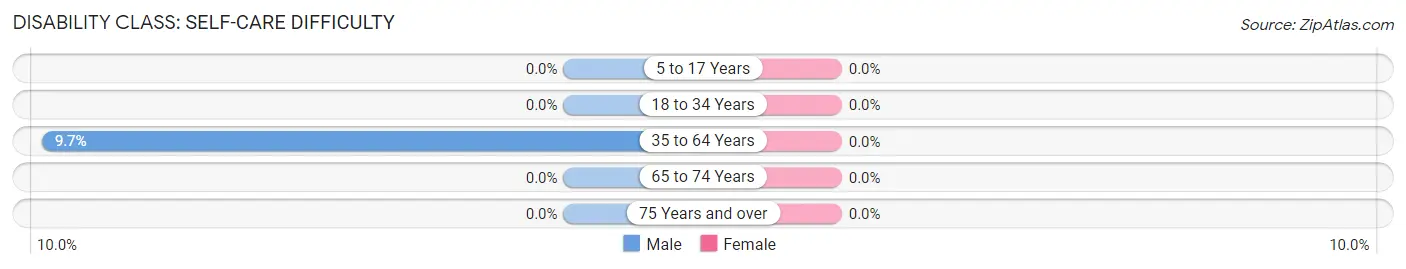
| Age Bracket | Male | Female |
| 5 to 17 Years | 0 (0.0%) | 0 (0.0%) |
| 18 to 34 Years | 0 (0.0%) | 0 (0.0%) |
| 35 to 64 Years | 12 (9.7%) | 0 (0.0%) |
| 65 to 74 Years | 0 (0.0%) | 0 (0.0%) |
| 75 Years and over | 0 (0.0%) | 0 (0.0%) |
Technology Access in Summit
Computing Device Access in Summit
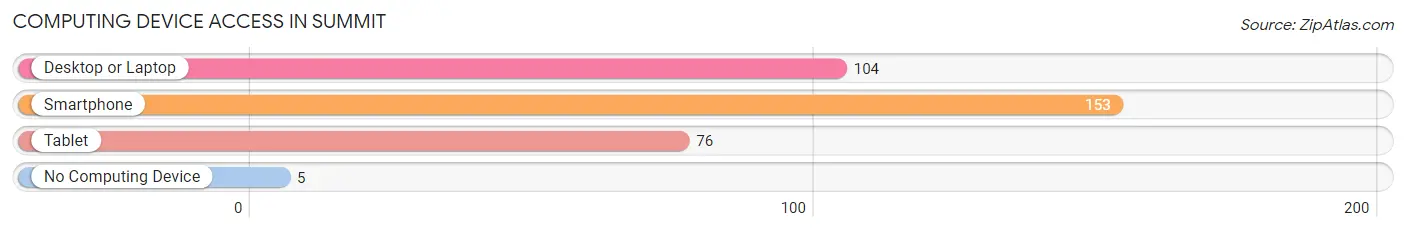
| Device Type | # Households | % Households |
| Desktop or Laptop | 104 | 65.8% |
| Smartphone | 153 | 96.8% |
| Tablet | 76 | 48.1% |
| No Computing Device | 5 | 3.2% |
| Total | 158 | 100.0% |
Internet Access in Summit
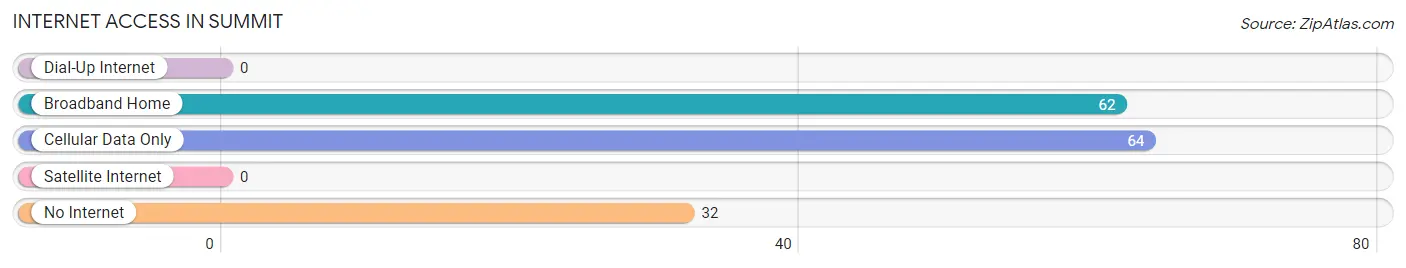
| Internet Type | # Households | % Households |
| Dial-Up Internet | 0 | 0.0% |
| Broadband Home | 62 | 39.2% |
| Cellular Data Only | 64 | 40.5% |
| Satellite Internet | 0 | 0.0% |
| No Internet | 32 | 20.3% |
| Total | 158 | 100.0% |
Summit Summary
Summit is a small town located in the Ozark Mountains of Arkansas. It is situated in the northwest corner of the state, near the Oklahoma border. The town has a population of just over 500 people, and is part of the Fort Smith metropolitan area.
History
Summit was founded in 1883 by a group of settlers from Missouri. The town was originally known as “Summit Station”, and was a stop on the St. Louis and San Francisco Railway. The town was officially incorporated in 1887.
In the early 1900s, Summit was a thriving agricultural community. The town was home to several cotton gins, a grist mill, and a sawmill. The town also had a hotel, a bank, and several stores.
In the 1950s, the town began to decline as the railroad industry declined. The town’s population dropped from over 1,000 in 1950 to just over 500 in 2000.
Geography
Summit is located in the Ozark Mountains of Arkansas. The town is situated in the northwest corner of the state, near the Oklahoma border. The town is located at the intersection of U.S. Route 71 and Arkansas Highway 59.
The town is situated on a plateau, with elevations ranging from 1,000 to 1,500 feet above sea level. The town is surrounded by rolling hills and forests. The nearest major city is Fort Smith, which is located about 25 miles to the south.
Economy
Summit’s economy is largely based on agriculture. The town is home to several farms, which produce a variety of crops, including cotton, soybeans, corn, and wheat. The town also has several small businesses, including a grocery store, a hardware store, and a restaurant.
Demographics
As of the 2010 census, Summit had a population of 517 people. The town is predominantly white, with 94.3% of the population identifying as white. The town also has a small Hispanic population, with 4.3% of the population identifying as Hispanic or Latino.
The median household income in Summit is $35,000, and the median home value is $90,000. The town has a poverty rate of 17.3%, which is higher than the national average.
Conclusion
Summit is a small town located in the Ozark Mountains of Arkansas. The town has a population of just over 500 people, and is part of the Fort Smith metropolitan area. The town’s economy is largely based on agriculture, and the town has a poverty rate of 17.3%. Summit is predominantly white, with 94.3% of the population identifying as white.
Common Questions
What is the Total Population of Summit?
Total Population of Summit is 555.
What is the Total Male Population of Summit?
Total Male Population of Summit is 229.
What is the Total Female Population of Summit?
Total Female Population of Summit is 326.
What is the Ratio of Males per 100 Females in Summit?
There are 70.25 Males per 100 Females in Summit.
What is the Ratio of Females per 100 Males in Summit?
There are 142.36 Females per 100 Males in Summit.
What is the Median Population Age in Summit?
Median Population Age in Summit is 33.8 Years.
What is the Average Family Size in Summit
Average Family Size in Summit is 3.8 People.
What is the Average Household Size in Summit
Average Household Size in Summit is 3.5 People.
What is Per Capita Income in Summit?
Per Capita income in Summit is $22,702.
What is the Median Family Income in Summit?
Median Family Income in Summit is $61,875.
What is the Median Household income in Summit?
Median Household Income in Summit is $62,188.
What is Inequality or Gini Index in Summit?
Inequality or Gini Index in Summit is 0.39.
How Large is the Labor Force in Summit?
There are 277 People in the Labor Forcein in Summit.
What is the Percentage of People in the Labor Force in Summit?
67.9% of People are in the Labor Force in Summit.
What is the Unemployment Rate in Summit?
Unemployment Rate in Summit is 11.9%.