Roland, AR Map & Demographics
Roland Map
Roland Overview
$57,086
PER CAPITA INCOME
$67,917
AVG HOUSEHOLD INCOME
59.9%
WAGE / INCOME GAP [ % ]
40.1¢/ $1
WAGE / INCOME GAP [ $ ]
0.53
INEQUALITY / GINI INDEX
999
TOTAL POPULATION
545
MALE POPULATION
454
FEMALE POPULATION
120.04
MALES / 100 FEMALES
83.30
FEMALES / 100 MALES
47.4
MEDIAN AGE
3.3
AVG FAMILY SIZE
2.6
AVG HOUSEHOLD SIZE
429
LABOR FORCE [ PEOPLE ]
52.6%
PERCENT IN LABOR FORCE
4.4%
UNEMPLOYMENT RATE
Roland Zip Codes
Roland Area Codes
Income in Roland
Income Overview in Roland
| Characteristic | Number | Measure |
| Per Capita Income | 999 | $57,086 |
| Median Family Income | 269 | $0 |
| Mean Family Income | 269 | $179,352 |
| Median Household Income | 387 | $67,917 |
| Mean Household Income | 387 | $131,509 |
| Income Deficit | 269 | $0 |
| Wage / Income Gap (%) | 999 | 59.90% |
| Wage / Income Gap ($) | 999 | 40.10¢ per $1 |
| Gini / Inequality Index | 999 | 0.53 |
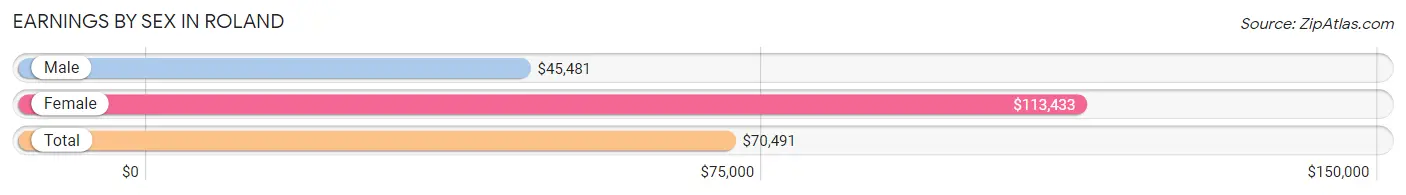
Earnings by Sex in Roland
Average Earnings in Roland are $70,491, $45,481 for men and $113,433 for women, a difference of 59.9%.
| Sex | Number | Average Earnings |
| Male | 251 (53.3%) | $45,481 |
| Female | 220 (46.7%) | $113,433 |
| Total | 471 (100.0%) | $70,491 |
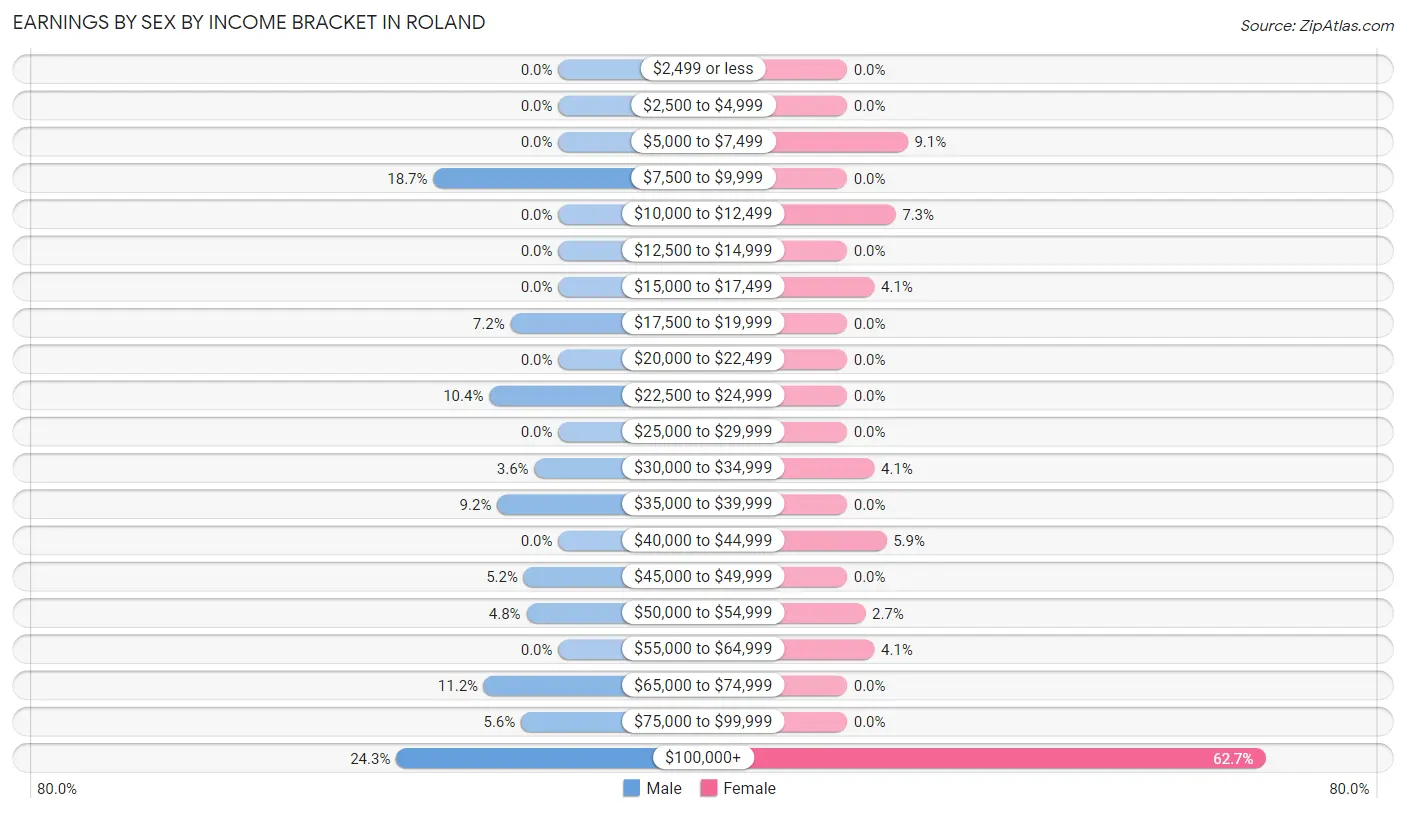
Earnings by Sex by Income Bracket in Roland
The most common earnings brackets in Roland are $100,000+ for men (61 | 24.3%) and $100,000+ for women (138 | 62.7%).
| Income | Male | Female |
| $2,499 or less | 0 (0.0%) | 0 (0.0%) |
| $2,500 to $4,999 | 0 (0.0%) | 0 (0.0%) |
| $5,000 to $7,499 | 0 (0.0%) | 20 (9.1%) |
| $7,500 to $9,999 | 47 (18.7%) | 0 (0.0%) |
| $10,000 to $12,499 | 0 (0.0%) | 16 (7.3%) |
| $12,500 to $14,999 | 0 (0.0%) | 0 (0.0%) |
| $15,000 to $17,499 | 0 (0.0%) | 9 (4.1%) |
| $17,500 to $19,999 | 18 (7.2%) | 0 (0.0%) |
| $20,000 to $22,499 | 0 (0.0%) | 0 (0.0%) |
| $22,500 to $24,999 | 26 (10.4%) | 0 (0.0%) |
| $25,000 to $29,999 | 0 (0.0%) | 0 (0.0%) |
| $30,000 to $34,999 | 9 (3.6%) | 9 (4.1%) |
| $35,000 to $39,999 | 23 (9.2%) | 0 (0.0%) |
| $40,000 to $44,999 | 0 (0.0%) | 13 (5.9%) |
| $45,000 to $49,999 | 13 (5.2%) | 0 (0.0%) |
| $50,000 to $54,999 | 12 (4.8%) | 6 (2.7%) |
| $55,000 to $64,999 | 0 (0.0%) | 9 (4.1%) |
| $65,000 to $74,999 | 28 (11.2%) | 0 (0.0%) |
| $75,000 to $99,999 | 14 (5.6%) | 0 (0.0%) |
| $100,000+ | 61 (24.3%) | 138 (62.7%) |
| Total | 251 (100.0%) | 220 (100.0%) |
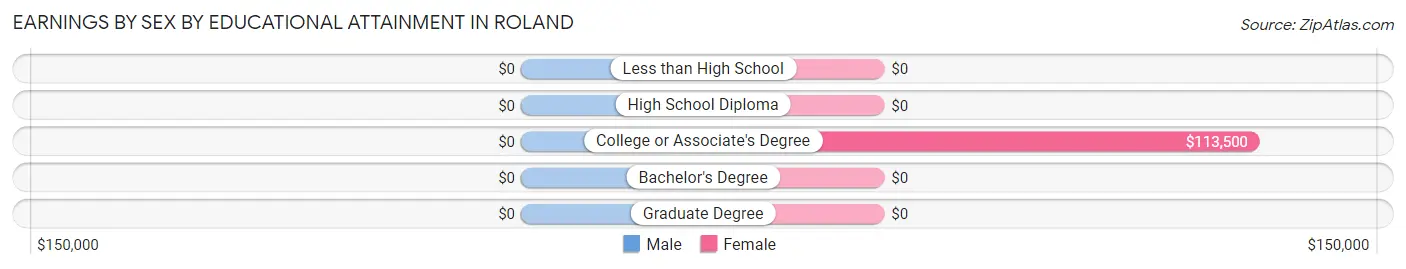
Earnings by Sex by Educational Attainment in Roland
| Educational Attainment | Male Income | Female Income |
| Less than High School | - | - |
| High School Diploma | - | - |
| College or Associate's Degree | - | - |
| Bachelor's Degree | - | - |
| Graduate Degree | - | - |
| Total | $46,827 | $113,533 |
Family Income in Roland
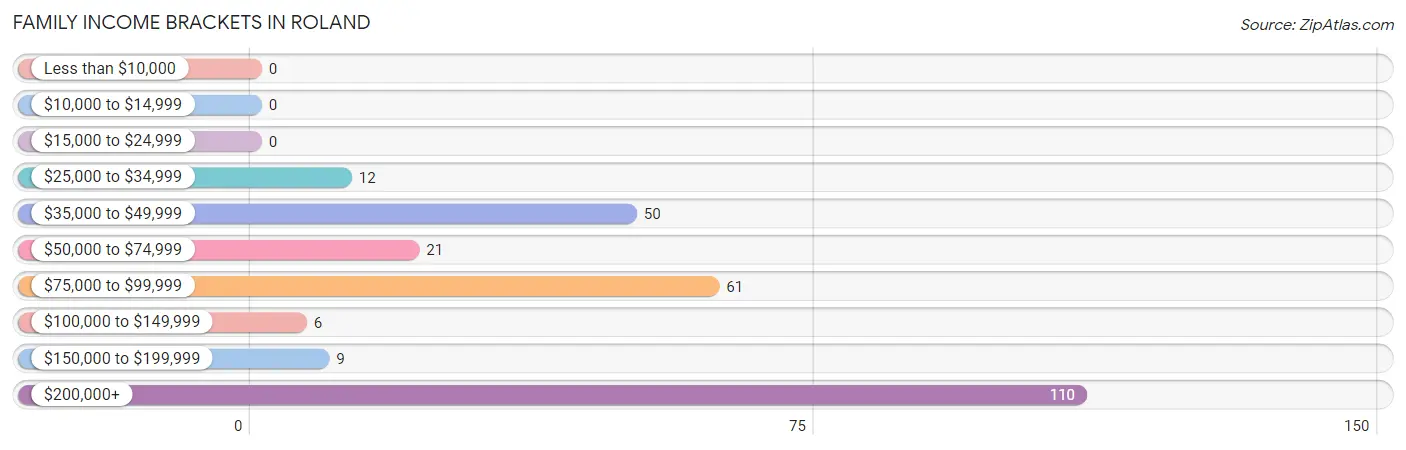
Family Income Brackets in Roland
According to the Roland family income data, there are 110 families falling into the $200,000+ income range, which is the most common income bracket and makes up 40.9% of all families.
| Income Bracket | # Families | % Families |
| Less than $10,000 | 0 | 0.0% |
| $10,000 to $14,999 | 0 | 0.0% |
| $15,000 to $24,999 | 0 | 0.0% |
| $25,000 to $34,999 | 12 | 4.5% |
| $35,000 to $49,999 | 50 | 18.6% |
| $50,000 to $74,999 | 21 | 7.8% |
| $75,000 to $99,999 | 61 | 22.7% |
| $100,000 to $149,999 | 6 | 2.2% |
| $150,000 to $199,999 | 9 | 3.3% |
| $200,000+ | 110 | 40.9% |
Family Income by Famaliy Size in Roland
| Income Bracket | # Families | Median Income |
| 2-Person Families | 114 (42.4%) | $0 |
| 3-Person Families | 6 (2.2%) | $0 |
| 4-Person Families | 136 (50.6%) | $0 |
| 5-Person Families | 13 (4.8%) | $0 |
| 6-Person Families | 0 (0.0%) | $0 |
| 7+ Person Families | 0 (0.0%) | $0 |
| Total | 269 (100.0%) | $0 |
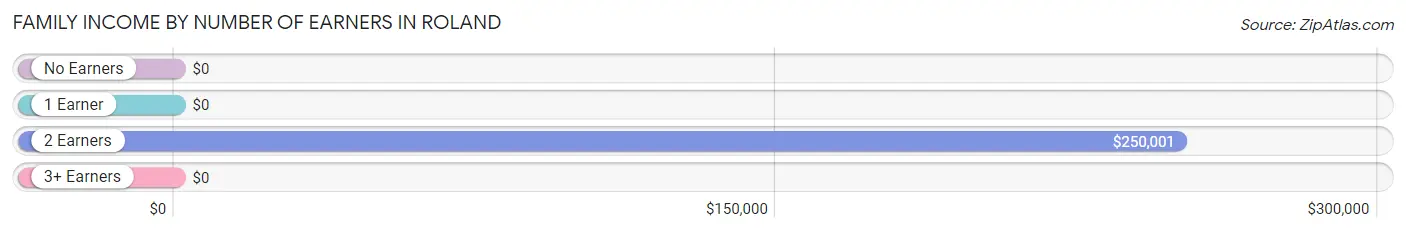
Family Income by Number of Earners in Roland
| Number of Earners | # Families | Median Income |
| No Earners | 10 (3.7%) | $0 |
| 1 Earner | 138 (51.3%) | $0 |
| 2 Earners | 115 (42.7%) | $250,001 |
| 3+ Earners | 6 (2.2%) | $0 |
| Total | 269 (100.0%) | $0 |
Household Income in Roland
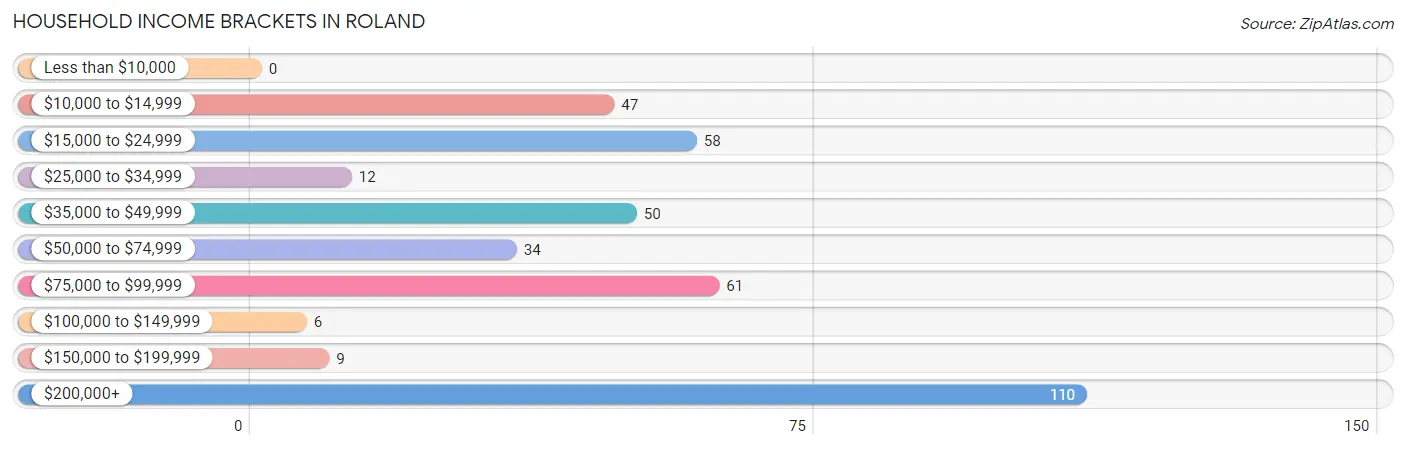
Household Income Brackets in Roland
With 110 households falling in the category, the $200,000+ income range is the most frequent in Roland, accounting for 28.4% of all households.
| Income Bracket | # Households | % Households |
| Less than $10,000 | 0 | 0.0% |
| $10,000 to $14,999 | 47 | 12.1% |
| $15,000 to $24,999 | 58 | 15.0% |
| $25,000 to $34,999 | 12 | 3.1% |
| $35,000 to $49,999 | 50 | 12.9% |
| $50,000 to $74,999 | 34 | 8.8% |
| $75,000 to $99,999 | 61 | 15.8% |
| $100,000 to $149,999 | 6 | 1.6% |
| $150,000 to $199,999 | 9 | 2.3% |
| $200,000+ | 110 | 28.4% |
Household Income by Householder Age in Roland
The median household income in Roland is $67,917, with the highest median household income of $250,001 found in the 45 to 64 years age bracket for the primary householder. A total of 193 households (49.9%) fall into this category.
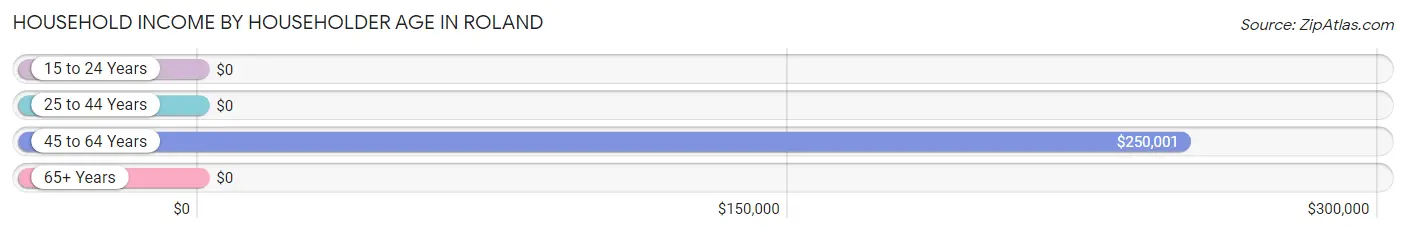
| Income Bracket | # Households | Median Income |
| 15 to 24 Years | 0 (0.0%) | $0 |
| 25 to 44 Years | 84 (21.7%) | $0 |
| 45 to 64 Years | 193 (49.9%) | $250,001 |
| 65+ Years | 110 (28.4%) | $0 |
| Total | 387 (100.0%) | $67,917 |
Poverty in Roland
Income Below Poverty by Sex and Age in Roland
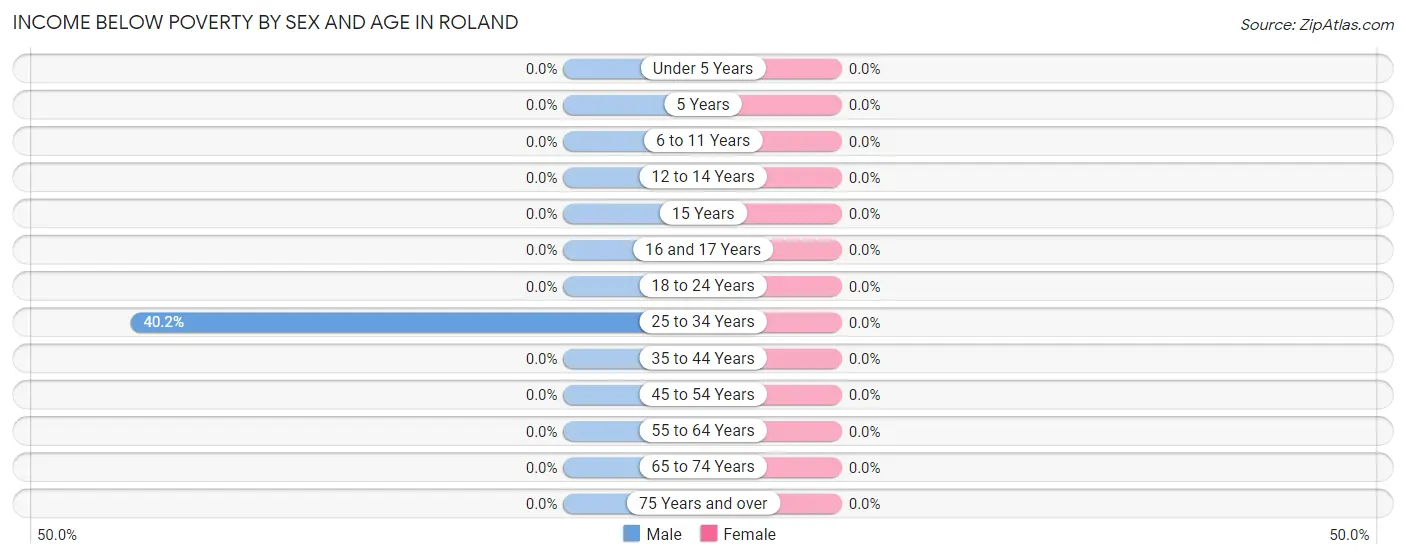
| Age Bracket | Male | Female |
| Under 5 Years | 0 (0.0%) | 0 (0.0%) |
| 5 Years | 0 (0.0%) | 0 (0.0%) |
| 6 to 11 Years | 0 (0.0%) | 0 (0.0%) |
| 12 to 14 Years | 0 (0.0%) | 0 (0.0%) |
| 15 Years | 0 (0.0%) | 0 (0.0%) |
| 16 and 17 Years | 0 (0.0%) | 0 (0.0%) |
| 18 to 24 Years | 0 (0.0%) | 0 (0.0%) |
| 25 to 34 Years | 47 (40.2%) | 0 (0.0%) |
| 35 to 44 Years | 0 (0.0%) | 0 (0.0%) |
| 45 to 54 Years | 0 (0.0%) | 0 (0.0%) |
| 55 to 64 Years | 0 (0.0%) | 0 (0.0%) |
| 65 to 74 Years | 0 (0.0%) | 0 (0.0%) |
| 75 Years and over | 0 (0.0%) | 0 (0.0%) |
| Total | 47 (8.6%) | 0 (0.0%) |
Income Above Poverty by Sex and Age in Roland
According to the poverty statistics in Roland, males aged under 5 years and females aged 6 to 11 years are the age groups that are most secure financially, with 100.0% of males and 100.0% of females in these age groups living above the poverty line.
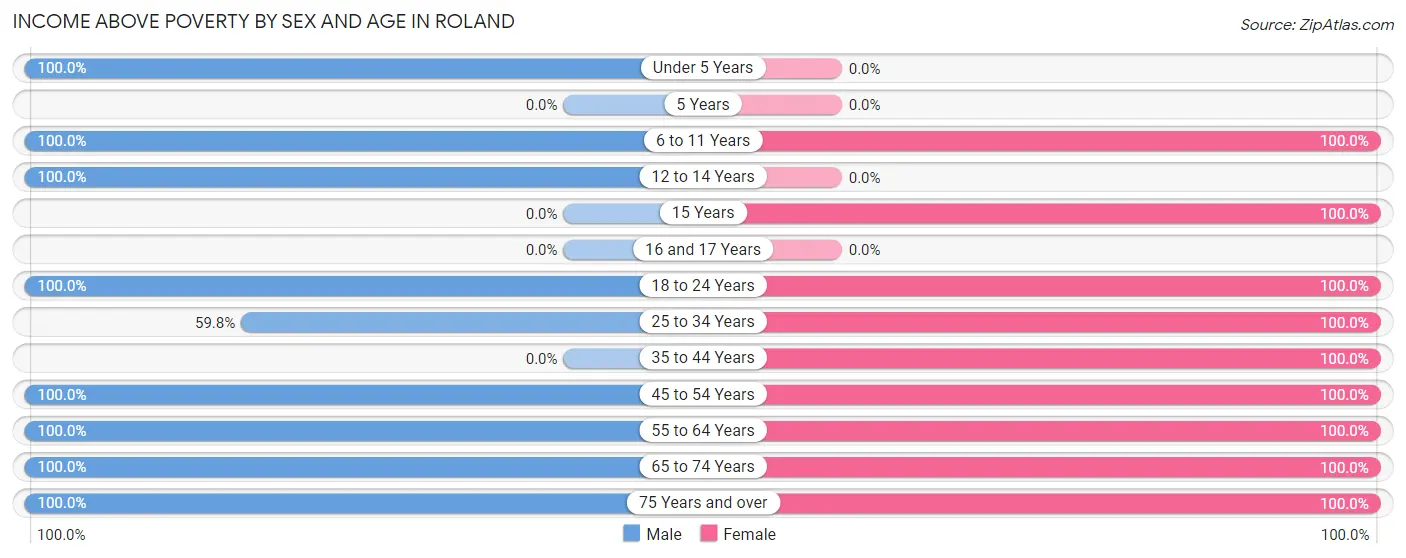
| Age Bracket | Male | Female |
| Under 5 Years | 57 (100.0%) | 0 (0.0%) |
| 5 Years | 0 (0.0%) | 0 (0.0%) |
| 6 to 11 Years | 24 (100.0%) | 32 (100.0%) |
| 12 to 14 Years | 31 (100.0%) | 0 (0.0%) |
| 15 Years | 0 (0.0%) | 39 (100.0%) |
| 16 and 17 Years | 0 (0.0%) | 0 (0.0%) |
| 18 to 24 Years | 54 (100.0%) | 6 (100.0%) |
| 25 to 34 Years | 70 (59.8%) | 38 (100.0%) |
| 35 to 44 Years | 0 (0.0%) | 18 (100.0%) |
| 45 to 54 Years | 119 (100.0%) | 119 (100.0%) |
| 55 to 64 Years | 57 (100.0%) | 122 (100.0%) |
| 65 to 74 Years | 58 (100.0%) | 24 (100.0%) |
| 75 Years and over | 28 (100.0%) | 56 (100.0%) |
| Total | 498 (91.4%) | 454 (100.0%) |
Income Below Poverty Among Married-Couple Families in Roland
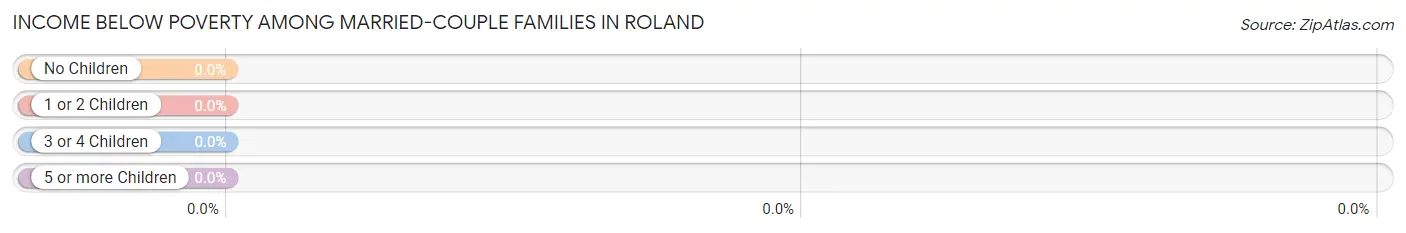
| Children | Above Poverty | Below Poverty |
| No Children | 138 (100.0%) | 0 (0.0%) |
| 1 or 2 Children | 98 (100.0%) | 0 (0.0%) |
| 3 or 4 Children | 13 (100.0%) | 0 (0.0%) |
| 5 or more Children | 0 (0.0%) | 0 (0.0%) |
| Total | 249 (100.0%) | 0 (0.0%) |
Income Below Poverty Among Single-Parent Households in Roland
| Children | Single Father | Single Mother |
| No Children | 0 (0.0%) | 0 (0.0%) |
| 1 or 2 Children | 0 (0.0%) | 0 (0.0%) |
| 3 or 4 Children | 0 (0.0%) | 0 (0.0%) |
| 5 or more Children | 0 (0.0%) | 0 (0.0%) |
| Total | 0 (0.0%) | 0 (0.0%) |
Income Below Poverty Among Married-Couple vs Single-Parent Households in Roland
| Children | Married-Couple Families | Single-Parent Households |
| No Children | 0 (0.0%) | 0 (0.0%) |
| 1 or 2 Children | 0 (0.0%) | 0 (0.0%) |
| 3 or 4 Children | 0 (0.0%) | 0 (0.0%) |
| 5 or more Children | 0 (0.0%) | 0 (0.0%) |
| Total | 0 (0.0%) | 0 (0.0%) |
Race in Roland
The most populous races in Roland are White / Caucasian (965 | 96.6%), Two or more Races (34 | 3.4%), and Hispanic or Latino (13 | 1.3%).
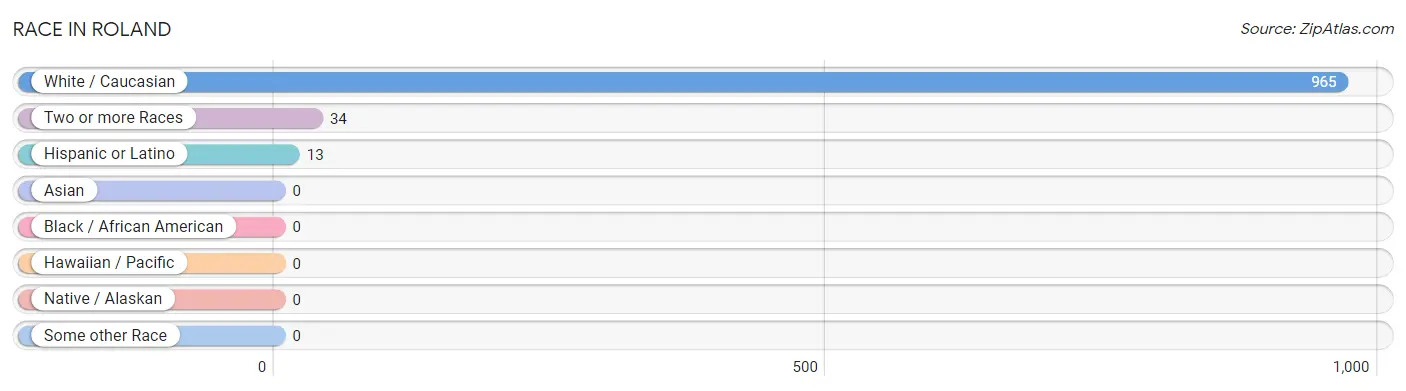
| Race | # Population | % Population |
| Asian | 0 | 0.0% |
| Black / African American | 0 | 0.0% |
| Hawaiian / Pacific | 0 | 0.0% |
| Hispanic or Latino | 13 | 1.3% |
| Native / Alaskan | 0 | 0.0% |
| White / Caucasian | 965 | 96.6% |
| Two or more Races | 34 | 3.4% |
| Some other Race | 0 | 0.0% |
| Total | 999 | 100.0% |
Ancestry in Roland
The most populous ancestries reported in Roland are Irish (207 | 20.7%), American (180 | 18.0%), English (48 | 4.8%), German (39 | 3.9%), and Pennsylvania German (18 | 1.8%), together accounting for 49.2% of all Roland residents.
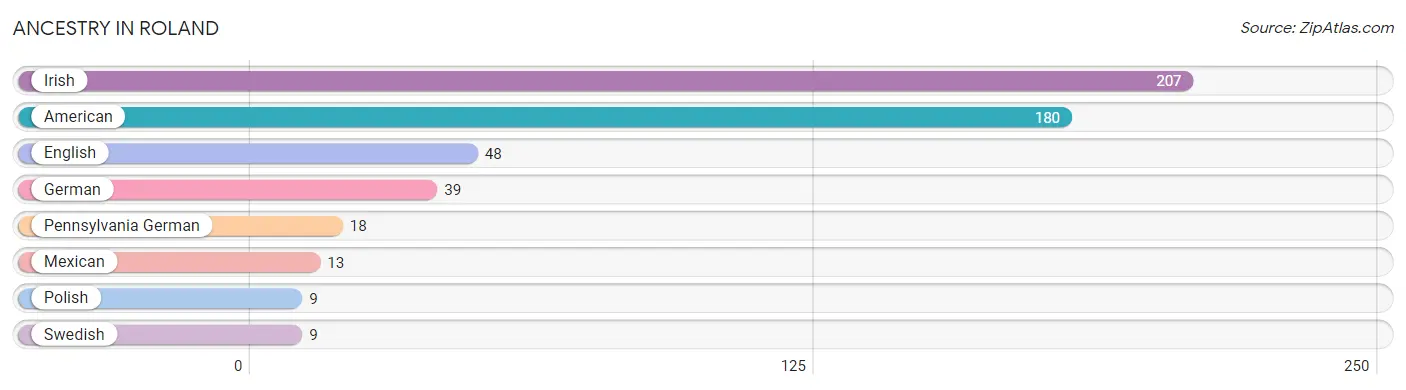
| Ancestry | # Population | % Population |
| American | 180 | 18.0% |
| English | 48 | 4.8% |
| German | 39 | 3.9% |
| Irish | 207 | 20.7% |
| Mexican | 13 | 1.3% |
| Pennsylvania German | 18 | 1.8% |
| Polish | 9 | 0.9% |
| Swedish | 9 | 0.9% | View All 8 Rows |
Immigrants in Roland

| Immigration Origin | # Population | % Population | View All 0 Rows |
Sex and Age in Roland
Sex and Age in Roland
The most populous age groups in Roland are 30 to 34 Years (84 | 15.4%) for men and 55 to 59 Years (89 | 19.6%) for women.
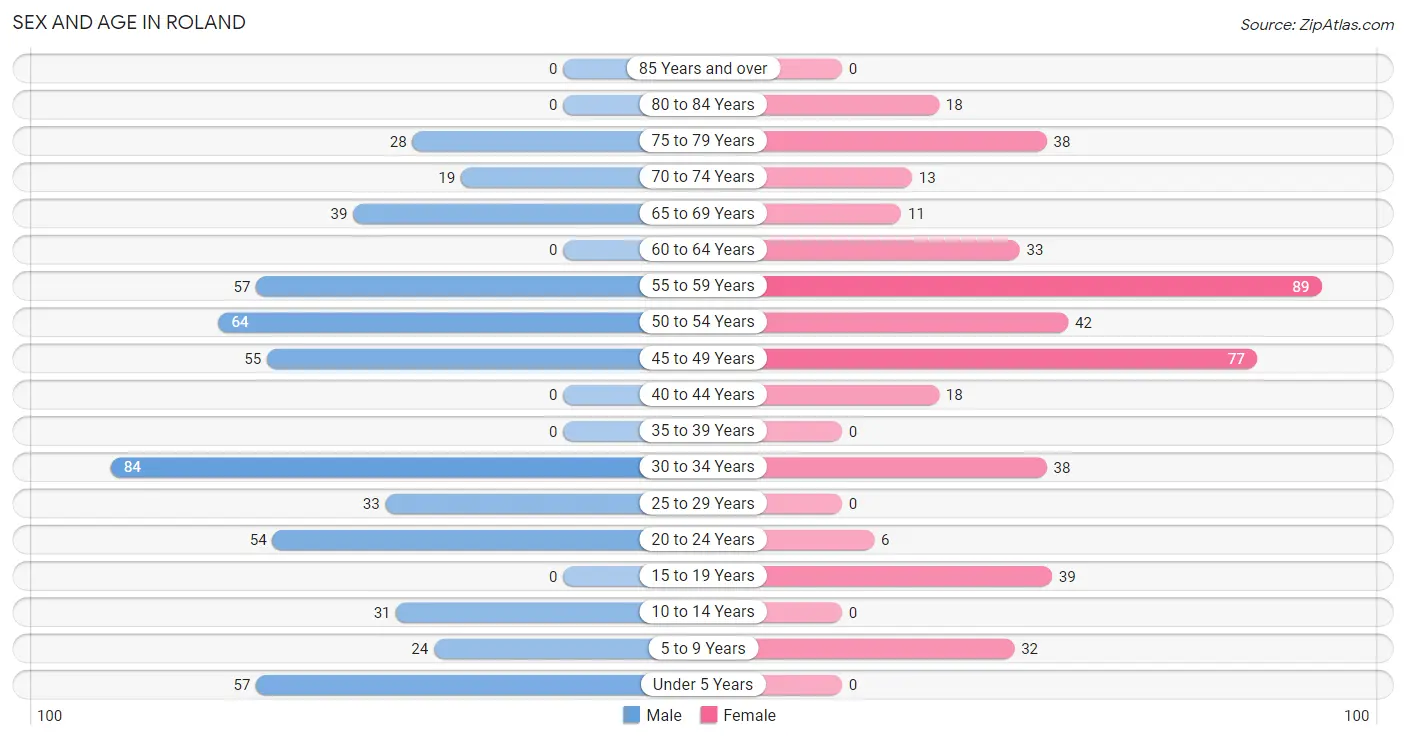
| Age Bracket | Male | Female |
| Under 5 Years | 57 (10.5%) | 0 (0.0%) |
| 5 to 9 Years | 24 (4.4%) | 32 (7.0%) |
| 10 to 14 Years | 31 (5.7%) | 0 (0.0%) |
| 15 to 19 Years | 0 (0.0%) | 39 (8.6%) |
| 20 to 24 Years | 54 (9.9%) | 6 (1.3%) |
| 25 to 29 Years | 33 (6.1%) | 0 (0.0%) |
| 30 to 34 Years | 84 (15.4%) | 38 (8.4%) |
| 35 to 39 Years | 0 (0.0%) | 0 (0.0%) |
| 40 to 44 Years | 0 (0.0%) | 18 (4.0%) |
| 45 to 49 Years | 55 (10.1%) | 77 (17.0%) |
| 50 to 54 Years | 64 (11.7%) | 42 (9.2%) |
| 55 to 59 Years | 57 (10.5%) | 89 (19.6%) |
| 60 to 64 Years | 0 (0.0%) | 33 (7.3%) |
| 65 to 69 Years | 39 (7.2%) | 11 (2.4%) |
| 70 to 74 Years | 19 (3.5%) | 13 (2.9%) |
| 75 to 79 Years | 28 (5.1%) | 38 (8.4%) |
| 80 to 84 Years | 0 (0.0%) | 18 (4.0%) |
| 85 Years and over | 0 (0.0%) | 0 (0.0%) |
| Total | 545 (100.0%) | 454 (100.0%) |
Families and Households in Roland
Median Family Size in Roland
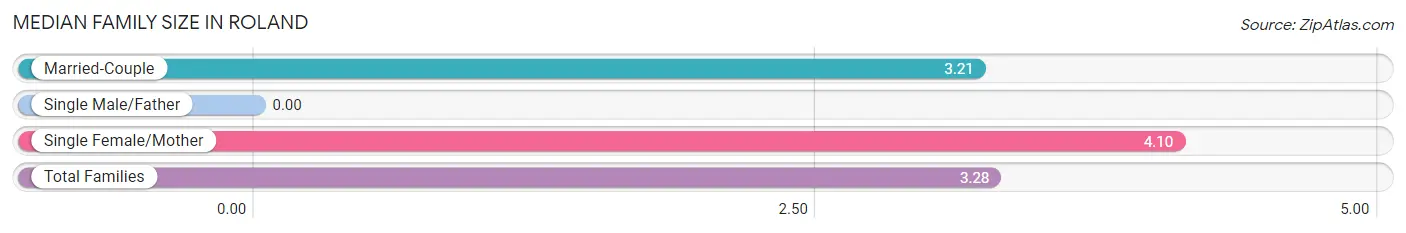
| Family Type | # Families | Family Size |
| Married-Couple | 249 (92.6%) | 3.21 |
| Single Male/Father | 0 (0.0%) | - |
| Single Female/Mother | 20 (7.4%) | 4.10 |
| Total Families | 269 (100.0%) | 3.28 |
Median Household Size in Roland
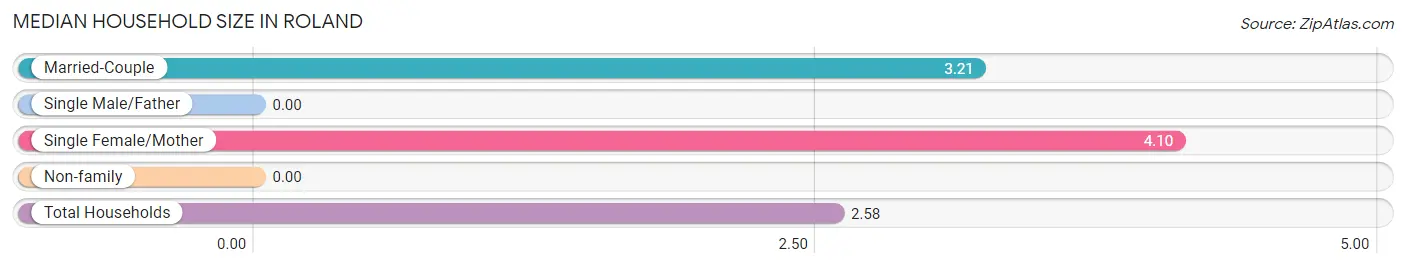
| Household Type | # Households | Household Size |
| Married-Couple | 249 (64.3%) | 3.21 |
| Single Male/Father | 0 (0.0%) | - |
| Single Female/Mother | 20 (5.2%) | 4.10 |
| Non-family | 118 (30.5%) | - |
| Total Households | 387 (100.0%) | 2.58 |
Household Size by Marriage Status in Roland
Out of a total of 387 households in Roland, 269 (69.5%) are family households, while 118 (30.5%) are nonfamily households. The most numerous type of family households are 4-person households, comprising 136, and the most common type of nonfamily households are 1-person households, comprising 118.
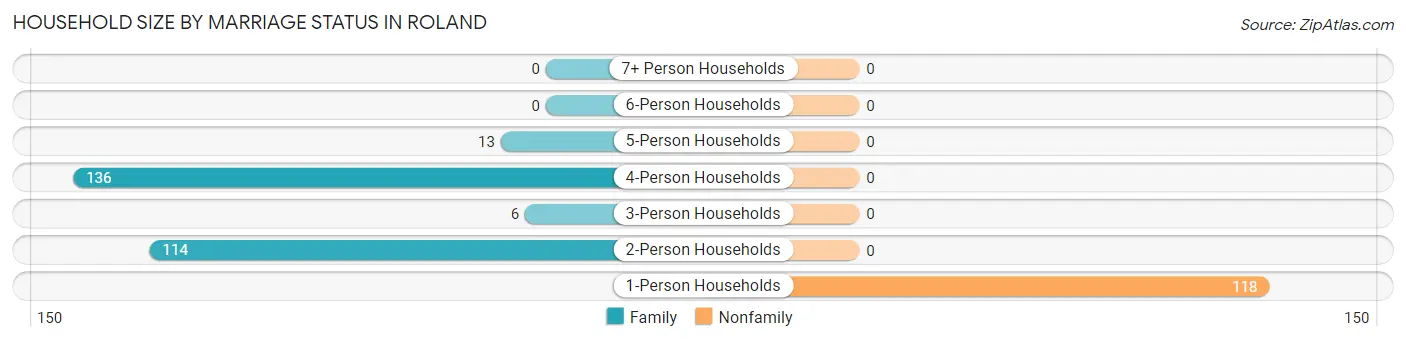
| Household Size | Family Households | Nonfamily Households |
| 1-Person Households | - | 118 (30.5%) |
| 2-Person Households | 114 (29.5%) | 0 (0.0%) |
| 3-Person Households | 6 (1.5%) | 0 (0.0%) |
| 4-Person Households | 136 (35.1%) | 0 (0.0%) |
| 5-Person Households | 13 (3.4%) | 0 (0.0%) |
| 6-Person Households | 0 (0.0%) | 0 (0.0%) |
| 7+ Person Households | 0 (0.0%) | 0 (0.0%) |
| Total | 269 (69.5%) | 118 (30.5%) |
Female Fertility in Roland
Fertility by Age in Roland
| Age Bracket | Women with Births | Births / 1,000 Women |
| 15 to 19 years | 0 (0.0%) | 0.0 |
| 20 to 34 years | 0 (0.0%) | 0.0 |
| 35 to 50 years | 0 (0.0%) | 0.0 |
| Total | 0 (0.0%) | 0.0 |
Fertility by Age by Marriage Status in Roland
| Age Bracket | Married | Unmarried |
| 15 to 19 years | 0 (0.0%) | 0 (0.0%) |
| 20 to 34 years | 0 (0.0%) | 0 (0.0%) |
| 35 to 50 years | 0 (0.0%) | 0 (0.0%) |
| Total | 0 (0.0%) | 0 (0.0%) |
Fertility by Education in Roland
| Educational Attainment | Women with Births | Births / 1,000 Women |
| Less than High School | 0 (0.0%) | 0.0 |
| High School Diploma | 0 (0.0%) | 0.0 |
| College or Associate's Degree | 0 (0.0%) | 0.0 |
| Bachelor's Degree | 0 (0.0%) | 0.0 |
| Graduate Degree | 0 (0.0%) | 0.0 |
| Total | 0 (0.0%) | 0.0 |
Fertility by Education by Marriage Status in Roland
| Educational Attainment | Married | Unmarried |
| Less than High School | 0 (0.0%) | 0 (0.0%) |
| High School Diploma | 0 (0.0%) | 0 (0.0%) |
| College or Associate's Degree | 0 (0.0%) | 0 (0.0%) |
| Bachelor's Degree | 0 (0.0%) | 0 (0.0%) |
| Graduate Degree | 0 (0.0%) | 0 (0.0%) |
| Total | 0 (0.0%) | 0 (0.0%) |
Employment Characteristics in Roland
Employment by Class of Employer in Roland
Among the 410 employed individuals in Roland, self-employed (not incorporated) (116 | 28.3%), private company employees (110 | 26.8%), and not-for-profit organizations (65 | 15.9%) make up the most common classes of employment.
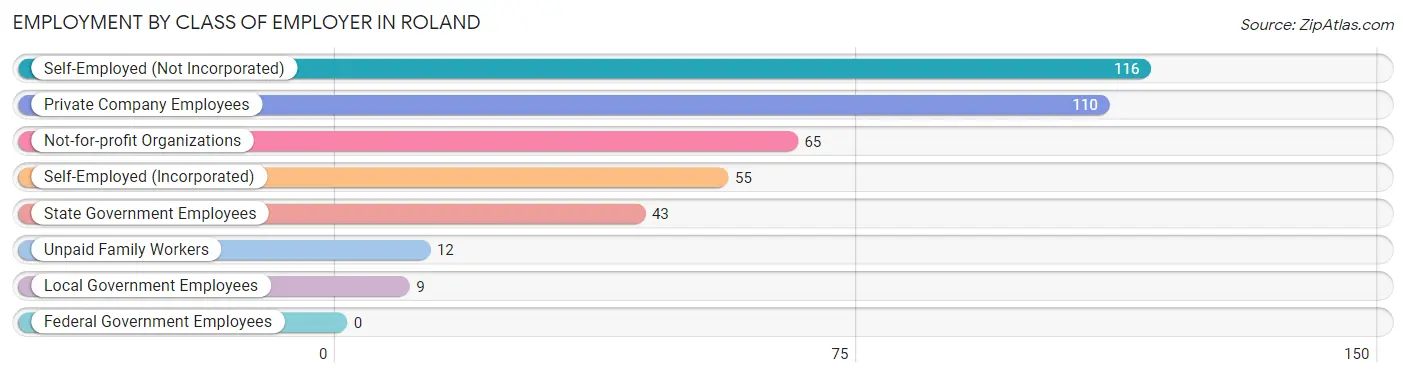
| Employer Class | # Employees | % Employees |
| Private Company Employees | 110 | 26.8% |
| Self-Employed (Incorporated) | 55 | 13.4% |
| Self-Employed (Not Incorporated) | 116 | 28.3% |
| Not-for-profit Organizations | 65 | 15.9% |
| Local Government Employees | 9 | 2.2% |
| State Government Employees | 43 | 10.5% |
| Federal Government Employees | 0 | 0.0% |
| Unpaid Family Workers | 12 | 2.9% |
| Total | 410 | 100.0% |
Employment Status by Age in Roland
According to the labor force statistics for Roland, out of the total population over 16 years of age (816), 52.6% or 429 individuals are in the labor force, with 4.4% or 19 of them unemployed. The age group with the highest labor force participation rate is 55 to 59 years, with 100.0% or 146 individuals in the labor force. Within the labor force, the 45 to 54 years age range has the highest percentage of unemployed individuals, with 8.1% or 14 of them being unemployed.
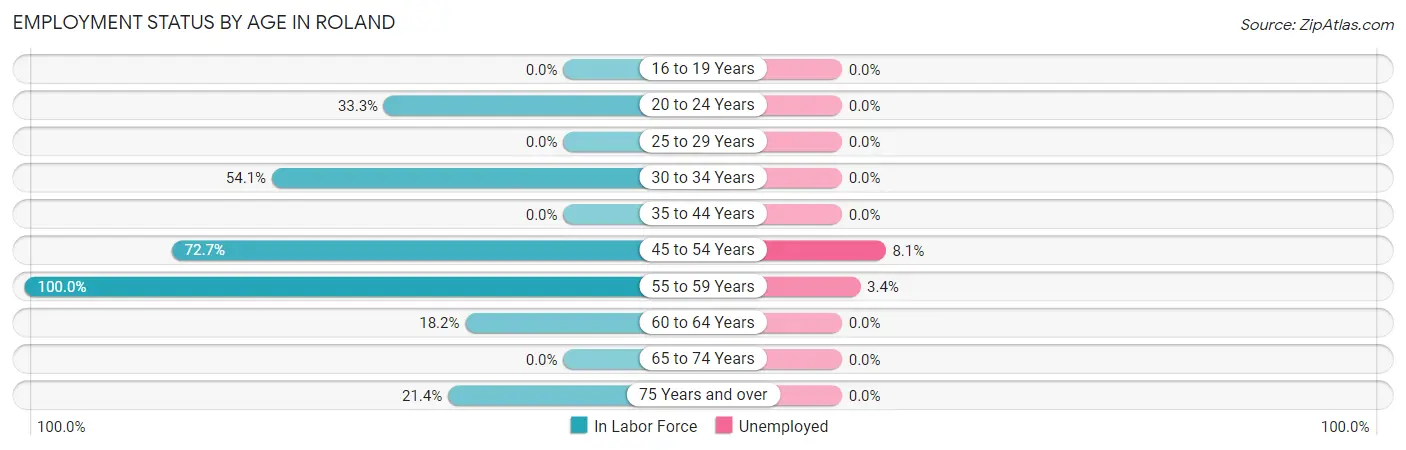
| Age Bracket | In Labor Force | Unemployed |
| 16 to 19 Years | 0 (0.0%) | 0 (0.0%) |
| 20 to 24 Years | 20 (33.3%) | 0 (0.0%) |
| 25 to 29 Years | 0 (0.0%) | 0 (0.0%) |
| 30 to 34 Years | 66 (54.1%) | 0 (0.0%) |
| 35 to 44 Years | 0 (0.0%) | 0 (0.0%) |
| 45 to 54 Years | 173 (72.7%) | 14 (8.1%) |
| 55 to 59 Years | 146 (100.0%) | 5 (3.4%) |
| 60 to 64 Years | 6 (18.2%) | 0 (0.0%) |
| 65 to 74 Years | 0 (0.0%) | 0 (0.0%) |
| 75 Years and over | 18 (21.4%) | 0 (0.0%) |
| Total | 429 (52.6%) | 19 (4.4%) |
Employment Status by Educational Attainment in Roland
According to labor force statistics for Roland, 66.3% of individuals (391) out of the total population between 25 and 64 years of age (590) are in the labor force, with 4.9% or 19 of them being unemployed. The group with the highest labor force participation rate are those with the educational attainment of bachelor's degree or higher, with 100.0% or 215 individuals in the labor force. Within the labor force, individuals with high school diploma education have the highest percentage of unemployment, with 18.9% or 14 of them being unemployed.
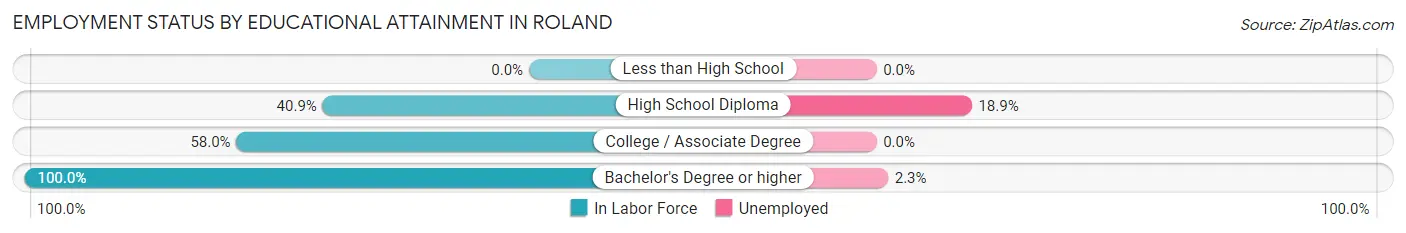
| Educational Attainment | In Labor Force | Unemployed |
| Less than High School | 0 (0.0%) | 0 (0.0%) |
| High School Diploma | 74 (40.9%) | 34 (18.9%) |
| College / Associate Degree | 102 (58.0%) | 0 (0.0%) |
| Bachelor's Degree or higher | 215 (100.0%) | 5 (2.3%) |
| Total | 391 (66.3%) | 29 (4.9%) |
Employment Occupations by Sex in Roland
Management, Business, Science and Arts Occupations
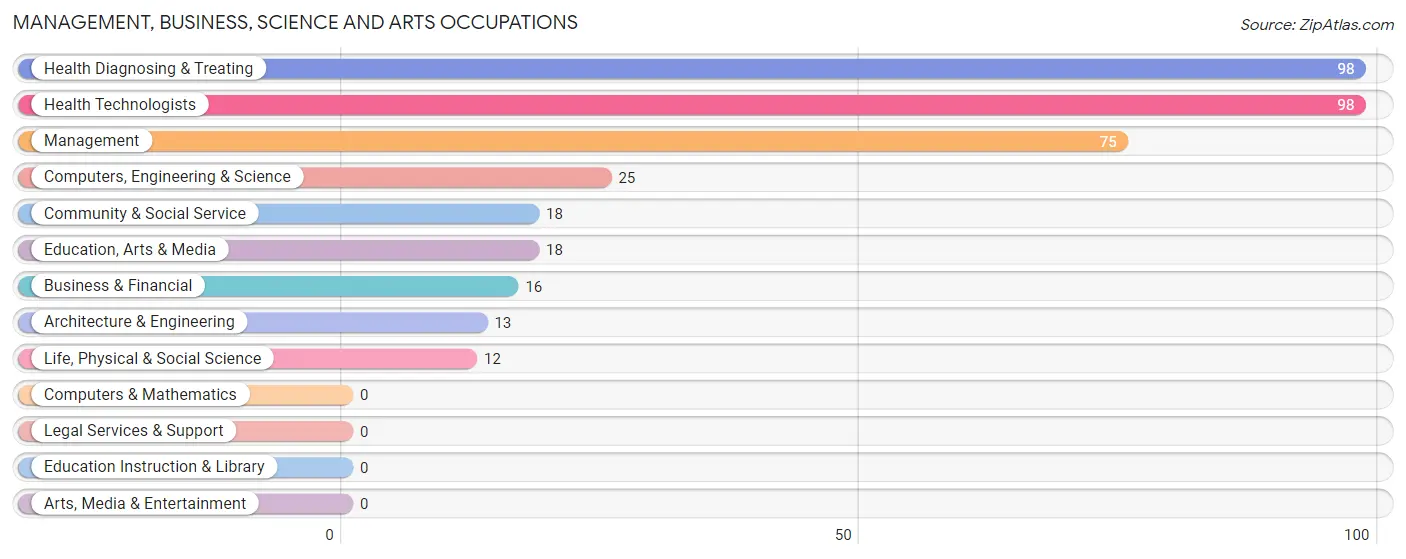
The most common Management, Business, Science and Arts occupations in Roland are Health Diagnosing & Treating (98 | 23.9%), Health Technologists (98 | 23.9%), Management (75 | 18.3%), Computers, Engineering & Science (25 | 6.1%), and Community & Social Service (18 | 4.4%).
Management, Business, Science and Arts Occupations by Sex
Within the Management, Business, Science and Arts occupations in Roland, the most male-oriented occupations are Computers, Engineering & Science (100.0%), Architecture & Engineering (100.0%), and Life, Physical & Social Science (100.0%), while the most female-oriented occupations are Management (100.0%), Business & Financial (100.0%), and Health Diagnosing & Treating (79.6%).
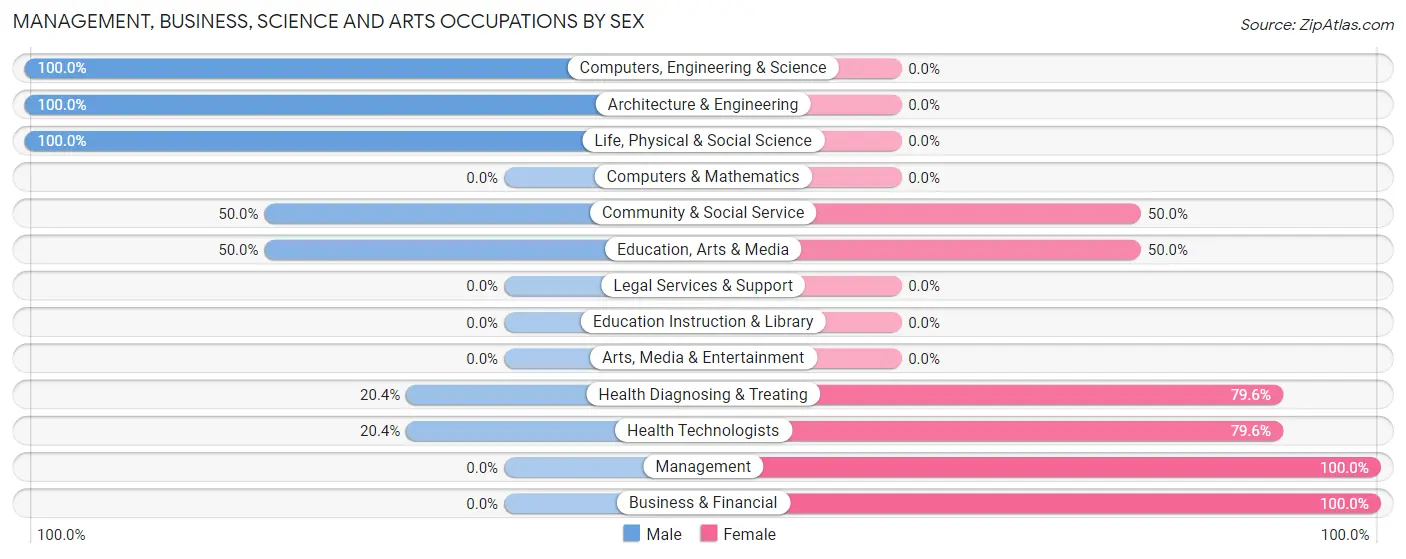
| Occupation | Male | Female |
| Management | 0 (0.0%) | 75 (100.0%) |
| Business & Financial | 0 (0.0%) | 16 (100.0%) |
| Computers, Engineering & Science | 25 (100.0%) | 0 (0.0%) |
| Computers & Mathematics | 0 (0.0%) | 0 (0.0%) |
| Architecture & Engineering | 13 (100.0%) | 0 (0.0%) |
| Life, Physical & Social Science | 12 (100.0%) | 0 (0.0%) |
| Community & Social Service | 9 (50.0%) | 9 (50.0%) |
| Education, Arts & Media | 9 (50.0%) | 9 (50.0%) |
| Legal Services & Support | 0 (0.0%) | 0 (0.0%) |
| Education Instruction & Library | 0 (0.0%) | 0 (0.0%) |
| Arts, Media & Entertainment | 0 (0.0%) | 0 (0.0%) |
| Health Diagnosing & Treating | 20 (20.4%) | 78 (79.6%) |
| Health Technologists | 20 (20.4%) | 78 (79.6%) |
| Total (Category) | 54 (23.3%) | 178 (76.7%) |
| Total (Overall) | 204 (49.8%) | 206 (50.2%) |
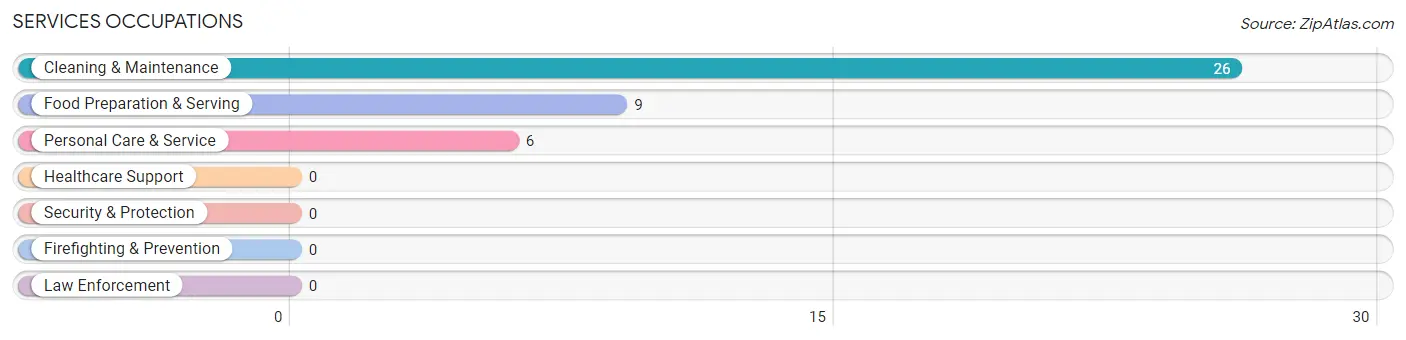
Services Occupations
The most common Services occupations in Roland are Cleaning & Maintenance (26 | 6.3%), Food Preparation & Serving (9 | 2.2%), and Personal Care & Service (6 | 1.5%).
Services Occupations by Sex
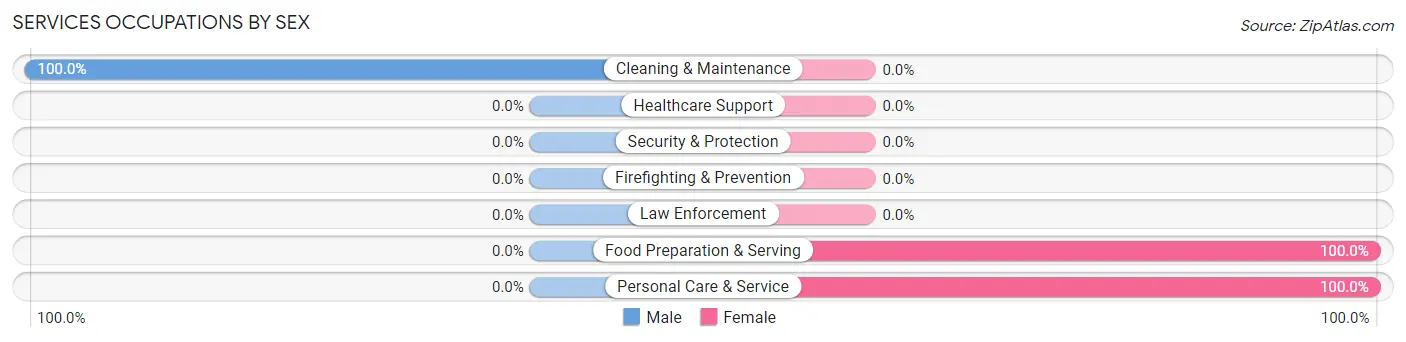
| Occupation | Male | Female |
| Healthcare Support | 0 (0.0%) | 0 (0.0%) |
| Security & Protection | 0 (0.0%) | 0 (0.0%) |
| Firefighting & Prevention | 0 (0.0%) | 0 (0.0%) |
| Law Enforcement | 0 (0.0%) | 0 (0.0%) |
| Food Preparation & Serving | 0 (0.0%) | 9 (100.0%) |
| Cleaning & Maintenance | 26 (100.0%) | 0 (0.0%) |
| Personal Care & Service | 0 (0.0%) | 6 (100.0%) |
| Total (Category) | 26 (63.4%) | 15 (36.6%) |
| Total (Overall) | 204 (49.8%) | 206 (50.2%) |
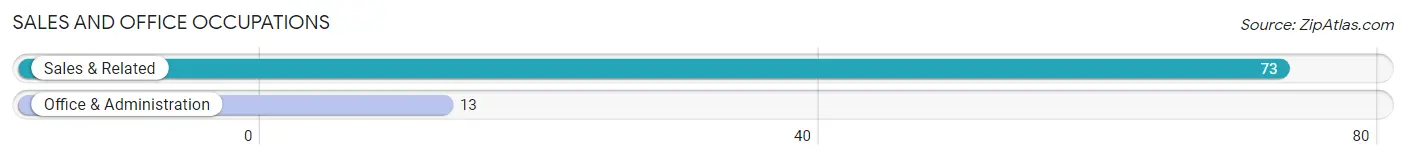
Sales and Office Occupations
The most common Sales and Office occupations in Roland are Sales & Related (73 | 17.8%), and Office & Administration (13 | 3.2%).
Sales and Office Occupations by Sex
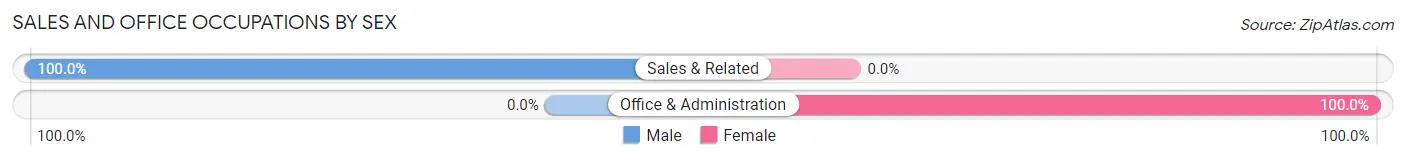
| Occupation | Male | Female |
| Sales & Related | 73 (100.0%) | 0 (0.0%) |
| Office & Administration | 0 (0.0%) | 13 (100.0%) |
| Total (Category) | 73 (84.9%) | 13 (15.1%) |
| Total (Overall) | 204 (49.8%) | 206 (50.2%) |
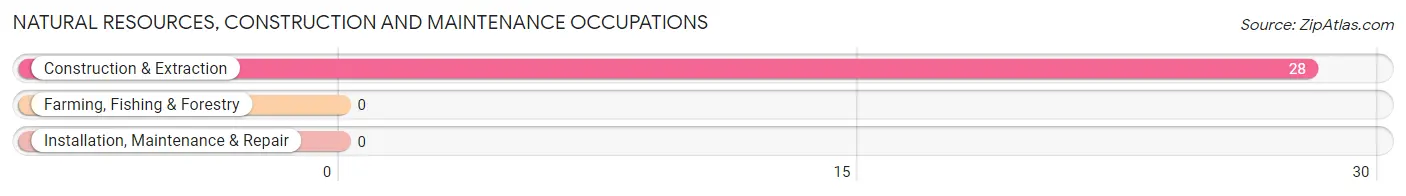
Natural Resources, Construction and Maintenance Occupations
The most common Natural Resources, Construction and Maintenance occupations in Roland are , and Construction & Extraction (28 | 6.8%).
Natural Resources, Construction and Maintenance Occupations by Sex
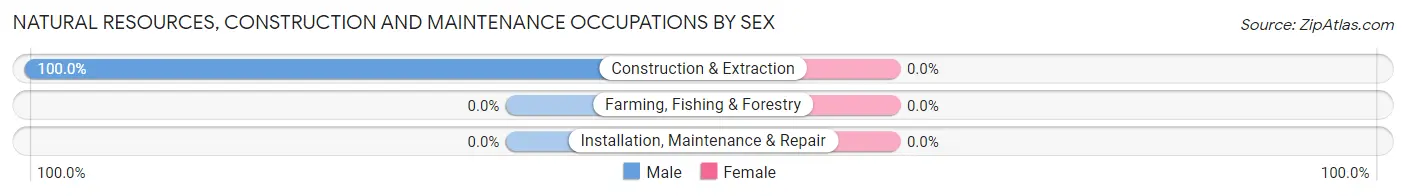
| Occupation | Male | Female |
| Farming, Fishing & Forestry | 0 (0.0%) | 0 (0.0%) |
| Construction & Extraction | 28 (100.0%) | 0 (0.0%) |
| Installation, Maintenance & Repair | 0 (0.0%) | 0 (0.0%) |
| Total (Category) | 28 (100.0%) | 0 (0.0%) |
| Total (Overall) | 204 (49.8%) | 206 (50.2%) |
Production, Transportation and Moving Occupations
The most common Production, Transportation and Moving occupations in Roland are , and Production (23 | 5.6%).
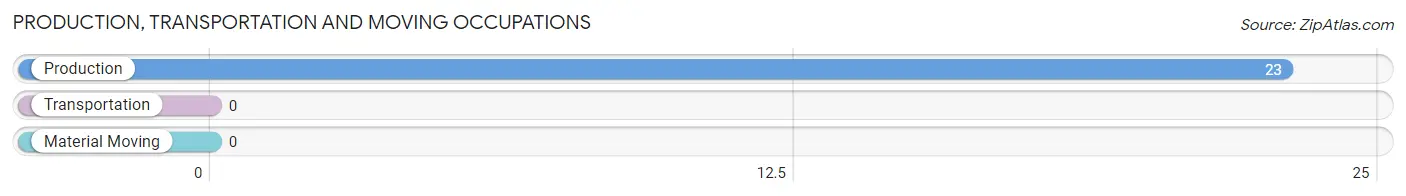
Production, Transportation and Moving Occupations by Sex
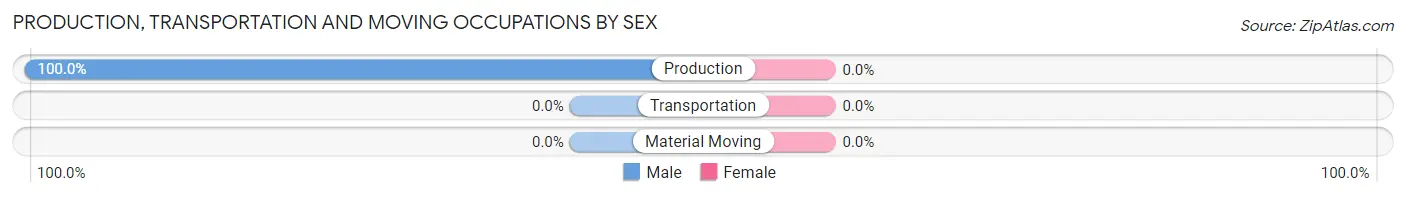
| Occupation | Male | Female |
| Production | 23 (100.0%) | 0 (0.0%) |
| Transportation | 0 (0.0%) | 0 (0.0%) |
| Material Moving | 0 (0.0%) | 0 (0.0%) |
| Total (Category) | 23 (100.0%) | 0 (0.0%) |
| Total (Overall) | 204 (49.8%) | 206 (50.2%) |
Employment Industries by Sex in Roland
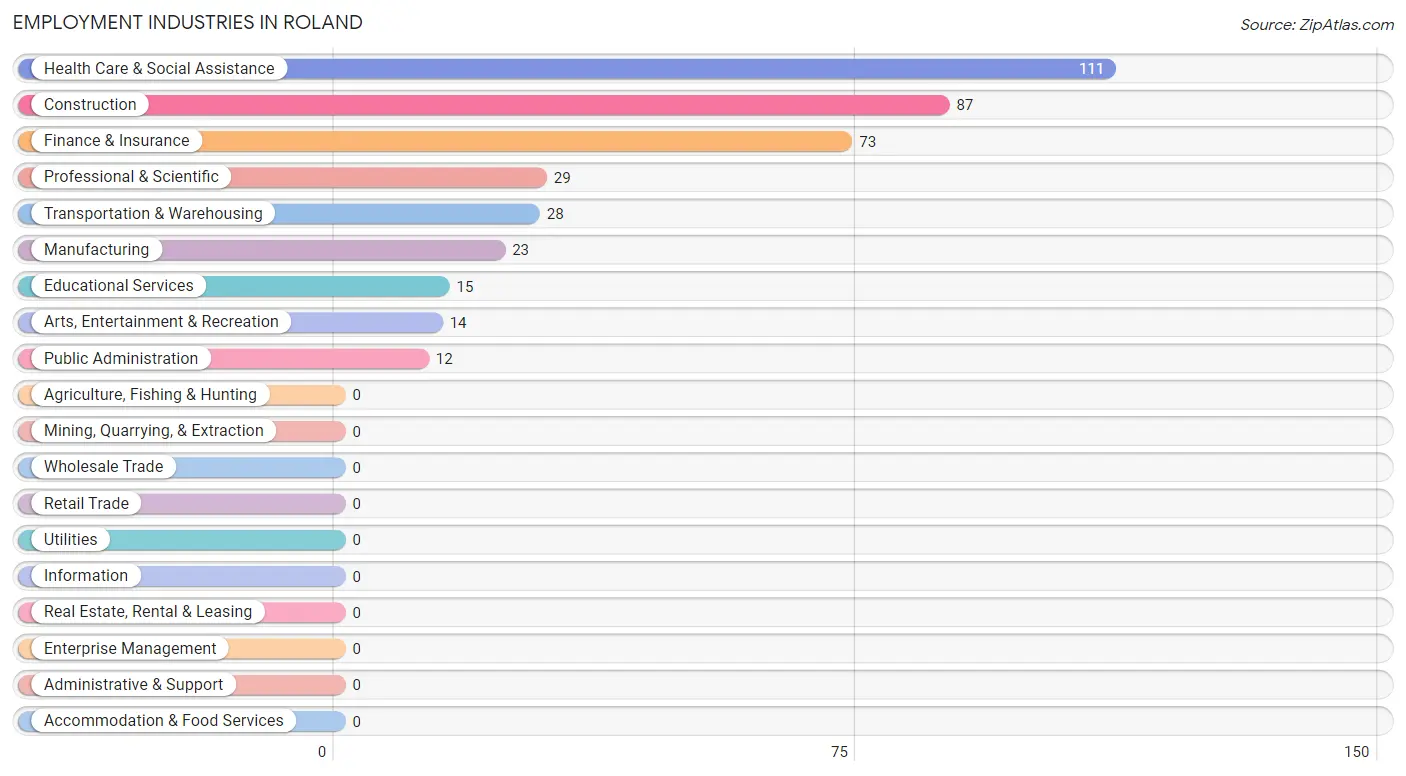
Employment Industries in Roland
The major employment industries in Roland include Health Care & Social Assistance (111 | 27.1%), Construction (87 | 21.2%), Finance & Insurance (73 | 17.8%), Professional & Scientific (29 | 7.1%), and Transportation & Warehousing (28 | 6.8%).
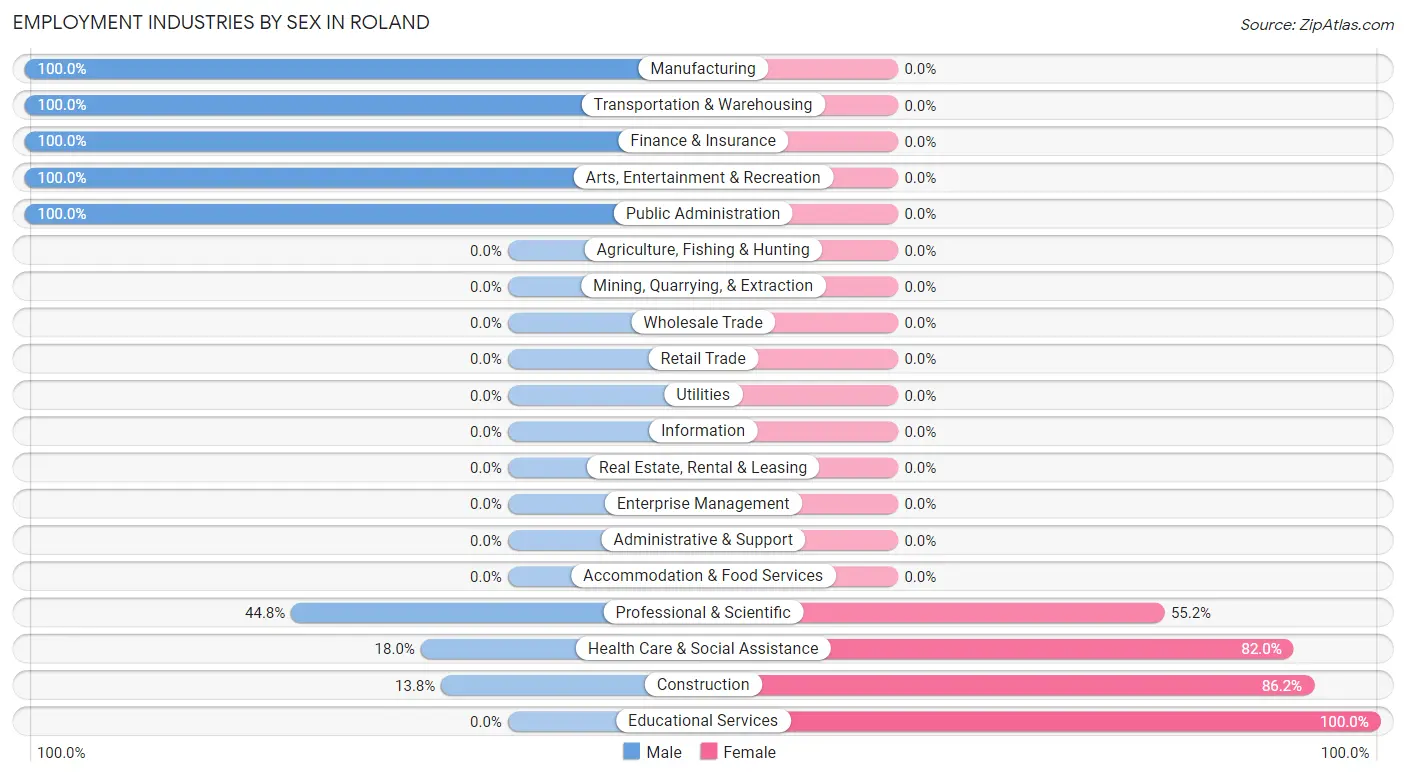
Employment Industries by Sex in Roland
The Roland industries that see more men than women are Manufacturing (100.0%), Transportation & Warehousing (100.0%), and Finance & Insurance (100.0%), whereas the industries that tend to have a higher number of women are Educational Services (100.0%), Construction (86.2%), and Health Care & Social Assistance (82.0%).
| Industry | Male | Female |
| Agriculture, Fishing & Hunting | 0 (0.0%) | 0 (0.0%) |
| Mining, Quarrying, & Extraction | 0 (0.0%) | 0 (0.0%) |
| Construction | 12 (13.8%) | 75 (86.2%) |
| Manufacturing | 23 (100.0%) | 0 (0.0%) |
| Wholesale Trade | 0 (0.0%) | 0 (0.0%) |
| Retail Trade | 0 (0.0%) | 0 (0.0%) |
| Transportation & Warehousing | 28 (100.0%) | 0 (0.0%) |
| Utilities | 0 (0.0%) | 0 (0.0%) |
| Information | 0 (0.0%) | 0 (0.0%) |
| Finance & Insurance | 73 (100.0%) | 0 (0.0%) |
| Real Estate, Rental & Leasing | 0 (0.0%) | 0 (0.0%) |
| Professional & Scientific | 13 (44.8%) | 16 (55.2%) |
| Enterprise Management | 0 (0.0%) | 0 (0.0%) |
| Administrative & Support | 0 (0.0%) | 0 (0.0%) |
| Educational Services | 0 (0.0%) | 15 (100.0%) |
| Health Care & Social Assistance | 20 (18.0%) | 91 (82.0%) |
| Arts, Entertainment & Recreation | 14 (100.0%) | 0 (0.0%) |
| Accommodation & Food Services | 0 (0.0%) | 0 (0.0%) |
| Public Administration | 12 (100.0%) | 0 (0.0%) |
| Total | 204 (49.8%) | 206 (50.2%) |
Education in Roland
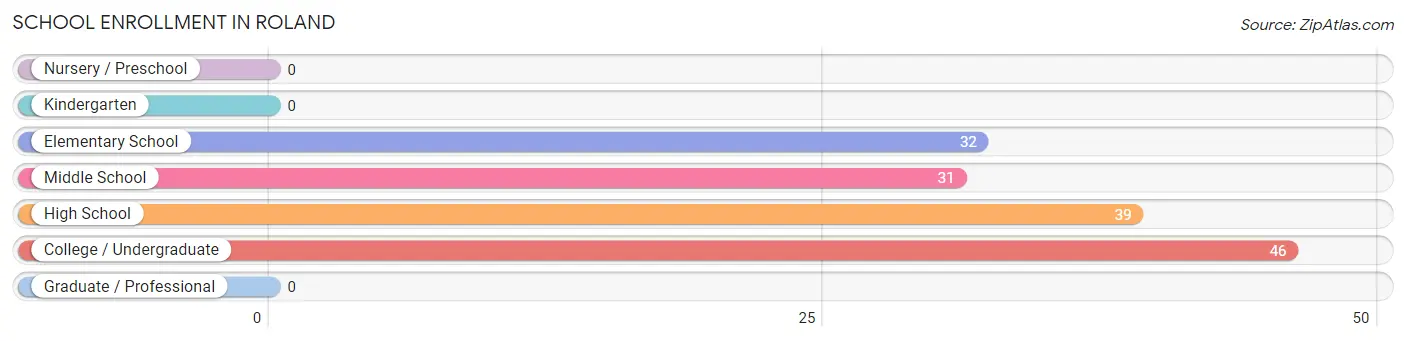
School Enrollment in Roland
The most common levels of schooling among the 148 students in Roland are college / undergraduate (46 | 31.1%), high school (39 | 26.4%), and elementary school (32 | 21.6%).
| School Level | # Students | % Students |
| Nursery / Preschool | 0 | 0.0% |
| Kindergarten | 0 | 0.0% |
| Elementary School | 32 | 21.6% |
| Middle School | 31 | 20.9% |
| High School | 39 | 26.4% |
| College / Undergraduate | 46 | 31.1% |
| Graduate / Professional | 0 | 0.0% |
| Total | 148 | 100.0% |
School Enrollment by Age by Funding Source in Roland
Out of a total of 148 students who are enrolled in schools in Roland, 76 (51.4%) attend a private institution, while the remaining 72 (48.6%) are enrolled in public schools. The age group of 10 to 14 year olds has the highest likelihood of being enrolled in private schools, with 31 (100.0% in the age bracket) enrolled. Conversely, the age group of 5 to 9 year old has the lowest likelihood of being enrolled in a private school, with 32 (100.0% in the age bracket) attending a public institution.
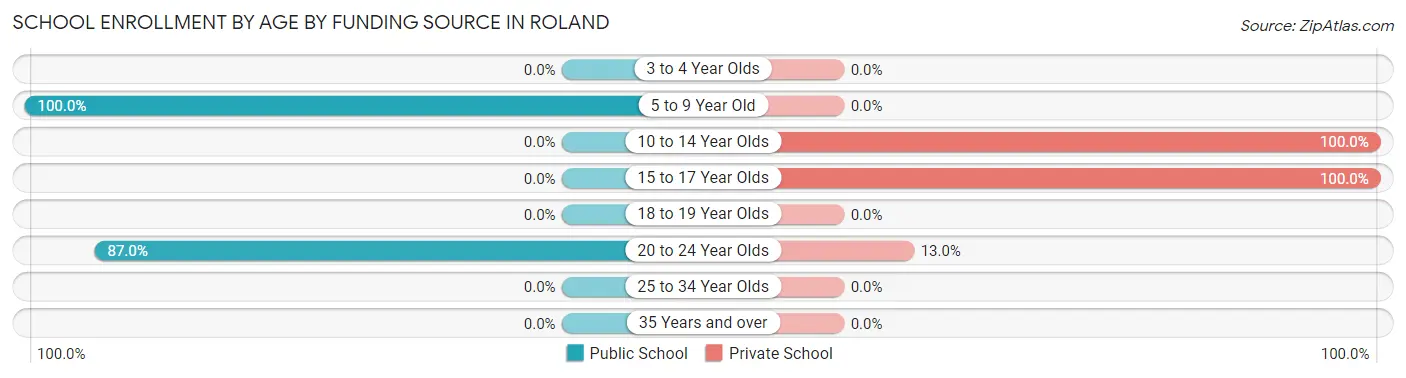
| Age Bracket | Public School | Private School |
| 3 to 4 Year Olds | 0 (0.0%) | 0 (0.0%) |
| 5 to 9 Year Old | 32 (100.0%) | 0 (0.0%) |
| 10 to 14 Year Olds | 0 (0.0%) | 31 (100.0%) |
| 15 to 17 Year Olds | 0 (0.0%) | 39 (100.0%) |
| 18 to 19 Year Olds | 0 (0.0%) | 0 (0.0%) |
| 20 to 24 Year Olds | 40 (87.0%) | 6 (13.0%) |
| 25 to 34 Year Olds | 0 (0.0%) | 0 (0.0%) |
| 35 Years and over | 0 (0.0%) | 0 (0.0%) |
| Total | 72 (48.6%) | 76 (51.4%) |
Educational Attainment by Field of Study in Roland
Science & technology (77 | 25.1%), bio, nature & agricultural (61 | 19.9%), engineering (52 | 16.9%), education (31 | 10.1%), and business (29 | 9.5%) are the most common fields of study among 307 individuals in Roland who have obtained a bachelor's degree or higher.
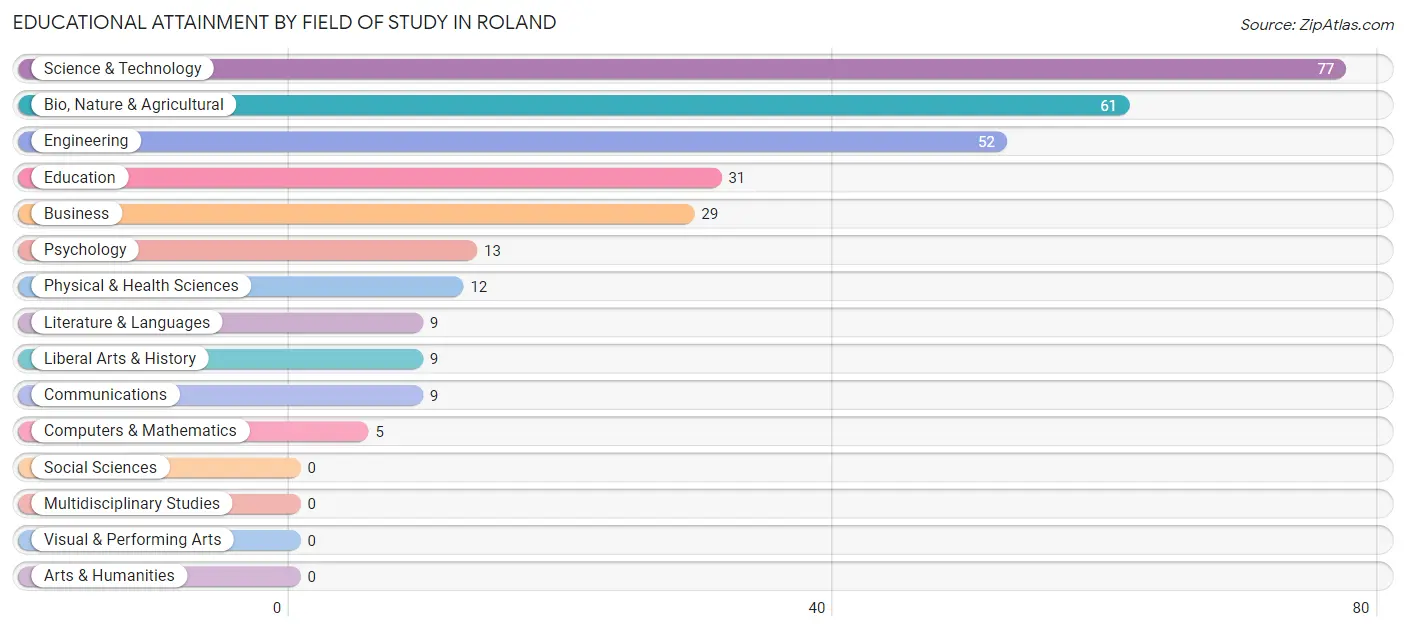
| Field of Study | # Graduates | % Graduates |
| Computers & Mathematics | 5 | 1.6% |
| Bio, Nature & Agricultural | 61 | 19.9% |
| Physical & Health Sciences | 12 | 3.9% |
| Psychology | 13 | 4.2% |
| Social Sciences | 0 | 0.0% |
| Engineering | 52 | 16.9% |
| Multidisciplinary Studies | 0 | 0.0% |
| Science & Technology | 77 | 25.1% |
| Business | 29 | 9.5% |
| Education | 31 | 10.1% |
| Literature & Languages | 9 | 2.9% |
| Liberal Arts & History | 9 | 2.9% |
| Visual & Performing Arts | 0 | 0.0% |
| Communications | 9 | 2.9% |
| Arts & Humanities | 0 | 0.0% |
| Total | 307 | 100.0% |
Transportation & Commute in Roland
Vehicle Availability by Sex in Roland
The most prevalent vehicle ownership categories in Roland are males with 4 vehicles (84, accounting for 41.2%) and females with 4 vehicles (75, making up 40.8%).
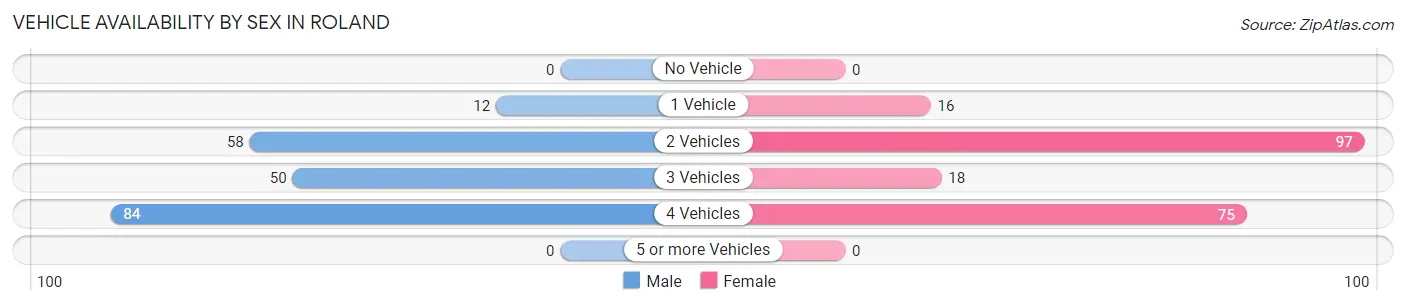
| Vehicles Available | Male | Female |
| No Vehicle | 0 (0.0%) | 0 (0.0%) |
| 1 Vehicle | 12 (5.9%) | 16 (7.8%) |
| 2 Vehicles | 58 (28.4%) | 97 (47.1%) |
| 3 Vehicles | 50 (24.5%) | 18 (8.7%) |
| 4 Vehicles | 84 (41.2%) | 75 (36.4%) |
| 5 or more Vehicles | 0 (0.0%) | 0 (0.0%) |
| Total | 204 (100.0%) | 206 (100.0%) |
Commute Time in Roland
The most frequently occuring commute durations in Roland are 45 to 59 minutes (91 commuters, 30.9%), 25 to 29 minutes (55 commuters, 18.7%), and 30 to 34 minutes (42 commuters, 14.3%).
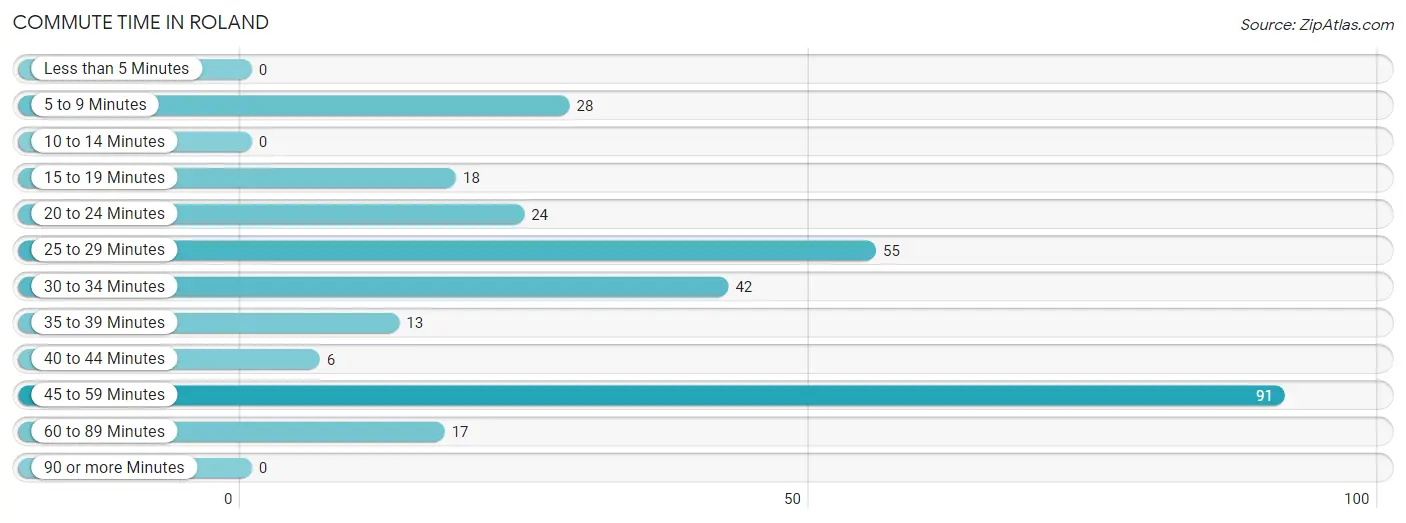
| Commute Time | # Commuters | % Commuters |
| Less than 5 Minutes | 0 | 0.0% |
| 5 to 9 Minutes | 28 | 9.5% |
| 10 to 14 Minutes | 0 | 0.0% |
| 15 to 19 Minutes | 18 | 6.1% |
| 20 to 24 Minutes | 24 | 8.2% |
| 25 to 29 Minutes | 55 | 18.7% |
| 30 to 34 Minutes | 42 | 14.3% |
| 35 to 39 Minutes | 13 | 4.4% |
| 40 to 44 Minutes | 6 | 2.0% |
| 45 to 59 Minutes | 91 | 30.9% |
| 60 to 89 Minutes | 17 | 5.8% |
| 90 or more Minutes | 0 | 0.0% |
Commute Time by Sex in Roland
The most common commute times in Roland are 25 to 29 minutes (55 commuters, 33.7%) for males and 45 to 59 minutes (85 commuters, 64.9%) for females.
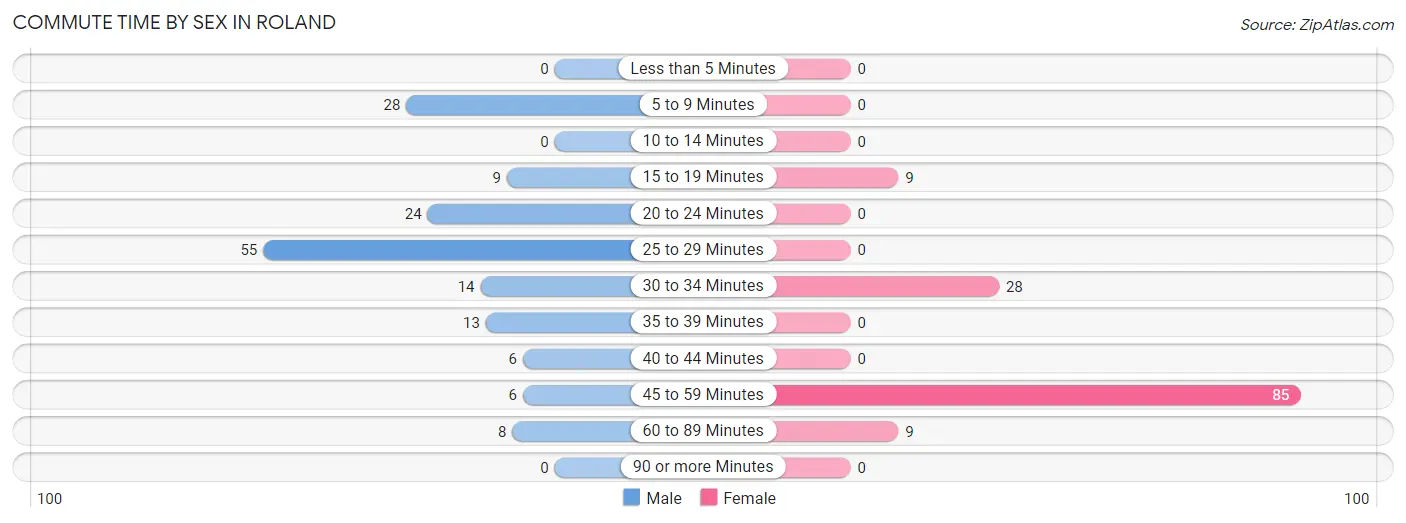
| Commute Time | Male | Female |
| Less than 5 Minutes | 0 (0.0%) | 0 (0.0%) |
| 5 to 9 Minutes | 28 (17.2%) | 0 (0.0%) |
| 10 to 14 Minutes | 0 (0.0%) | 0 (0.0%) |
| 15 to 19 Minutes | 9 (5.5%) | 9 (6.9%) |
| 20 to 24 Minutes | 24 (14.7%) | 0 (0.0%) |
| 25 to 29 Minutes | 55 (33.7%) | 0 (0.0%) |
| 30 to 34 Minutes | 14 (8.6%) | 28 (21.4%) |
| 35 to 39 Minutes | 13 (8.0%) | 0 (0.0%) |
| 40 to 44 Minutes | 6 (3.7%) | 0 (0.0%) |
| 45 to 59 Minutes | 6 (3.7%) | 85 (64.9%) |
| 60 to 89 Minutes | 8 (4.9%) | 9 (6.9%) |
| 90 or more Minutes | 0 (0.0%) | 0 (0.0%) |
Time of Departure to Work by Sex in Roland
The most frequent times of departure to work in Roland are 7:30 AM to 7:59 AM (55, 33.7%) for males and 7:00 AM to 7:29 AM (79, 60.3%) for females.
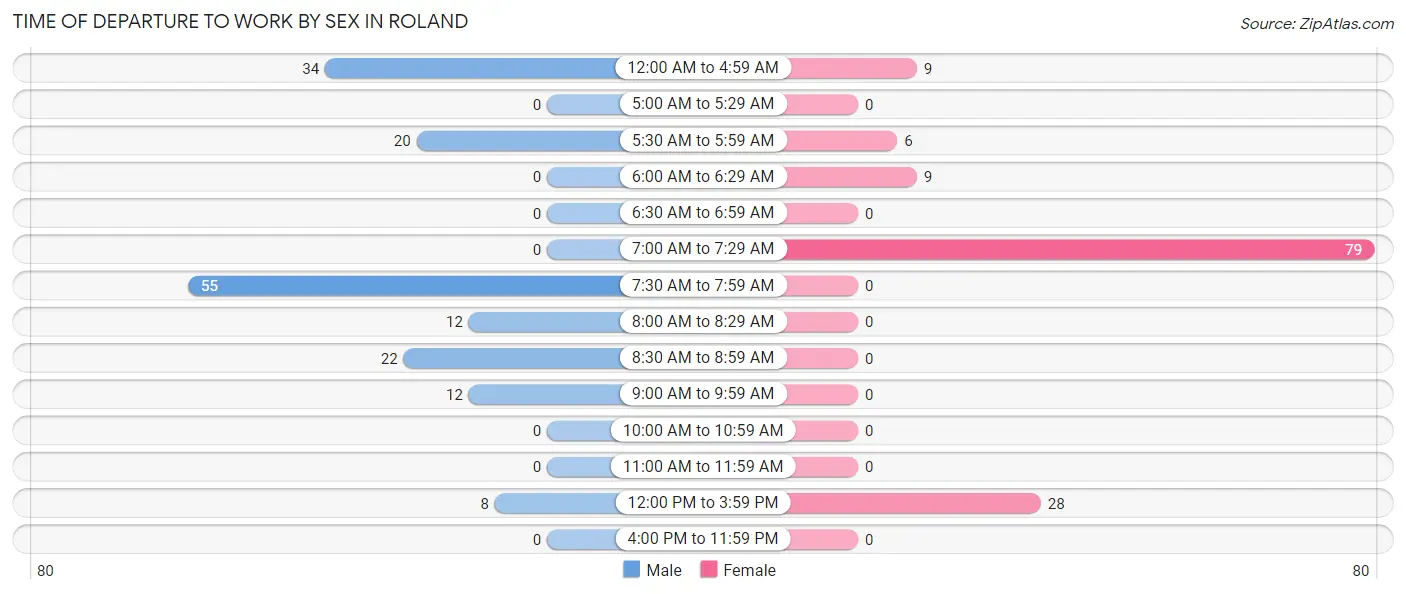
| Time of Departure | Male | Female |
| 12:00 AM to 4:59 AM | 34 (20.9%) | 9 (6.9%) |
| 5:00 AM to 5:29 AM | 0 (0.0%) | 0 (0.0%) |
| 5:30 AM to 5:59 AM | 20 (12.3%) | 6 (4.6%) |
| 6:00 AM to 6:29 AM | 0 (0.0%) | 9 (6.9%) |
| 6:30 AM to 6:59 AM | 0 (0.0%) | 0 (0.0%) |
| 7:00 AM to 7:29 AM | 0 (0.0%) | 79 (60.3%) |
| 7:30 AM to 7:59 AM | 55 (33.7%) | 0 (0.0%) |
| 8:00 AM to 8:29 AM | 12 (7.4%) | 0 (0.0%) |
| 8:30 AM to 8:59 AM | 22 (13.5%) | 0 (0.0%) |
| 9:00 AM to 9:59 AM | 12 (7.4%) | 0 (0.0%) |
| 10:00 AM to 10:59 AM | 0 (0.0%) | 0 (0.0%) |
| 11:00 AM to 11:59 AM | 0 (0.0%) | 0 (0.0%) |
| 12:00 PM to 3:59 PM | 8 (4.9%) | 28 (21.4%) |
| 4:00 PM to 11:59 PM | 0 (0.0%) | 0 (0.0%) |
| Total | 163 (100.0%) | 131 (100.0%) |
Housing Occupancy in Roland
Occupancy by Ownership in Roland
Of the total 387 dwellings in Roland, owner-occupied units account for 260 (67.2%), while renter-occupied units make up 127 (32.8%).
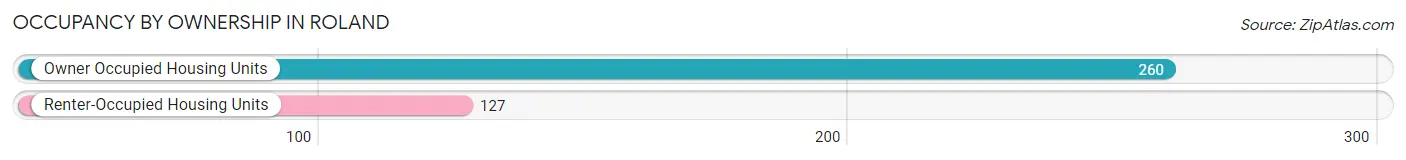
| Occupancy | # Housing Units | % Housing Units |
| Owner Occupied Housing Units | 260 | 67.2% |
| Renter-Occupied Housing Units | 127 | 32.8% |
| Total Occupied Housing Units | 387 | 100.0% |
Occupancy by Household Size in Roland
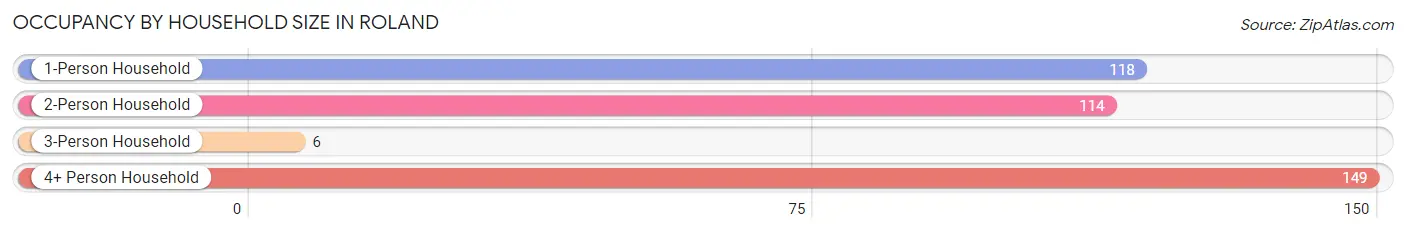
| Household Size | # Housing Units | % Housing Units |
| 1-Person Household | 118 | 30.5% |
| 2-Person Household | 114 | 29.5% |
| 3-Person Household | 6 | 1.5% |
| 4+ Person Household | 149 | 38.5% |
| Total Housing Units | 387 | 100.0% |
Occupancy by Ownership by Household Size in Roland
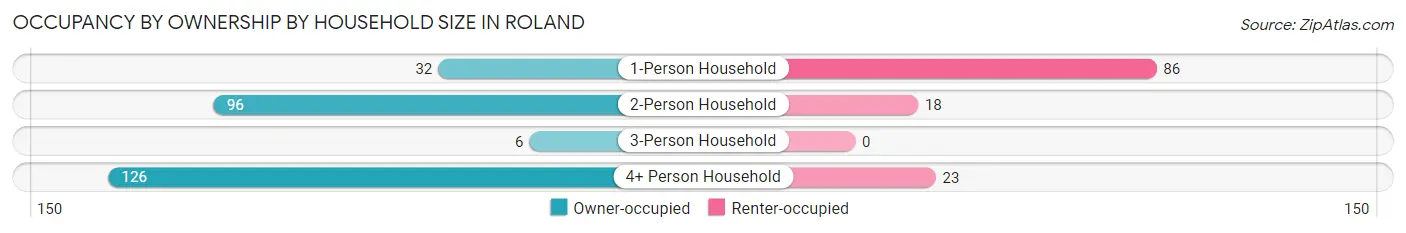
| Household Size | Owner-occupied | Renter-occupied |
| 1-Person Household | 32 (27.1%) | 86 (72.9%) |
| 2-Person Household | 96 (84.2%) | 18 (15.8%) |
| 3-Person Household | 6 (100.0%) | 0 (0.0%) |
| 4+ Person Household | 126 (84.6%) | 23 (15.4%) |
| Total Housing Units | 260 (67.2%) | 127 (32.8%) |
Occupancy by Educational Attainment in Roland
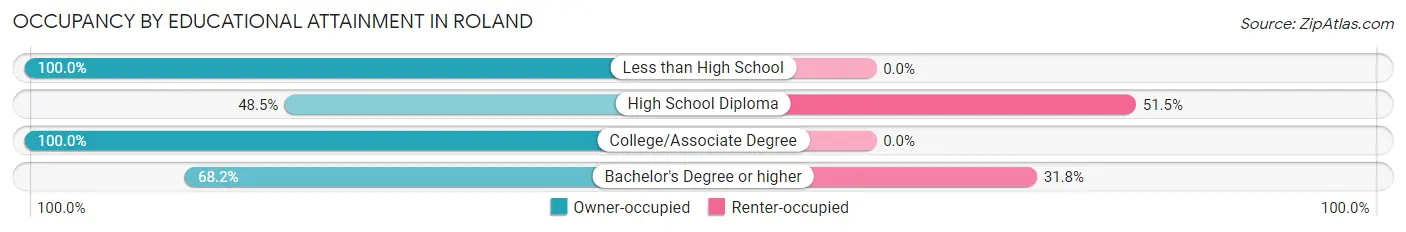
| Household Size | Owner-occupied | Renter-occupied |
| Less than High School | 10 (100.0%) | 0 (0.0%) |
| High School Diploma | 66 (48.5%) | 70 (51.5%) |
| College/Associate Degree | 62 (100.0%) | 0 (0.0%) |
| Bachelor's Degree or higher | 122 (68.2%) | 57 (31.8%) |
Occupancy by Age of Householder in Roland
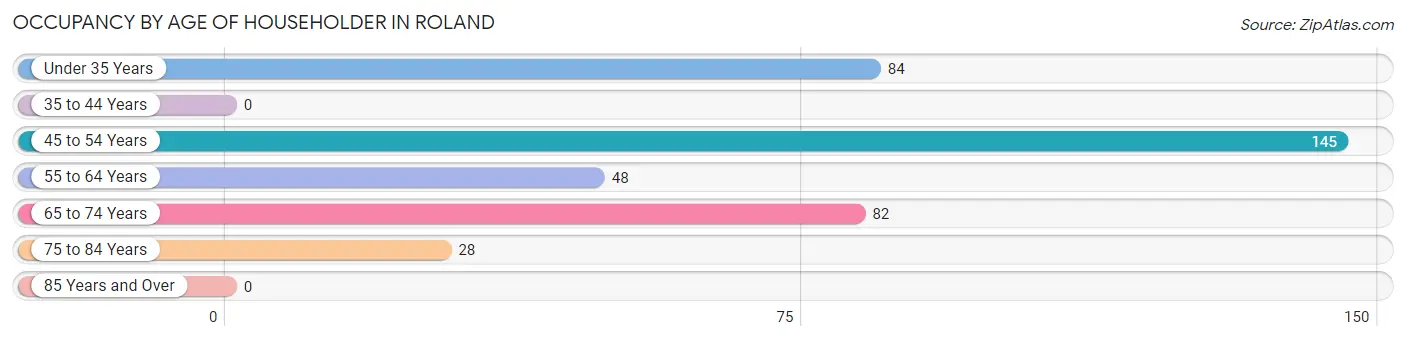
| Age Bracket | # Households | % Households |
| Under 35 Years | 84 | 21.7% |
| 35 to 44 Years | 0 | 0.0% |
| 45 to 54 Years | 145 | 37.5% |
| 55 to 64 Years | 48 | 12.4% |
| 65 to 74 Years | 82 | 21.2% |
| 75 to 84 Years | 28 | 7.2% |
| 85 Years and Over | 0 | 0.0% |
| Total | 387 | 100.0% |
Housing Finances in Roland
Median Income by Occupancy in Roland
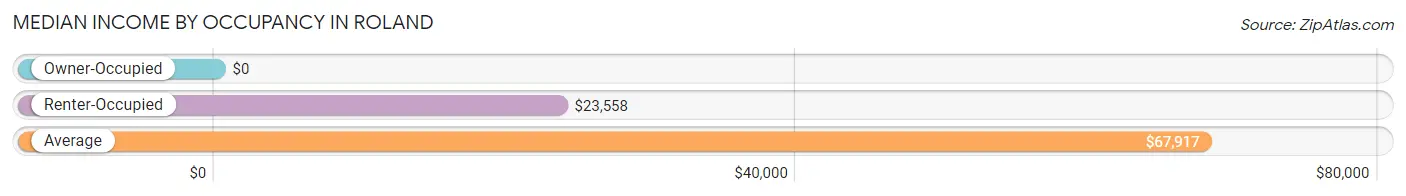
| Occupancy Type | # Households | Median Income |
| Owner-Occupied | 260 (67.2%) | $0 |
| Renter-Occupied | 127 (32.8%) | $23,558 |
| Average | 387 (100.0%) | $67,917 |
Occupancy by Householder Income Bracket in Roland
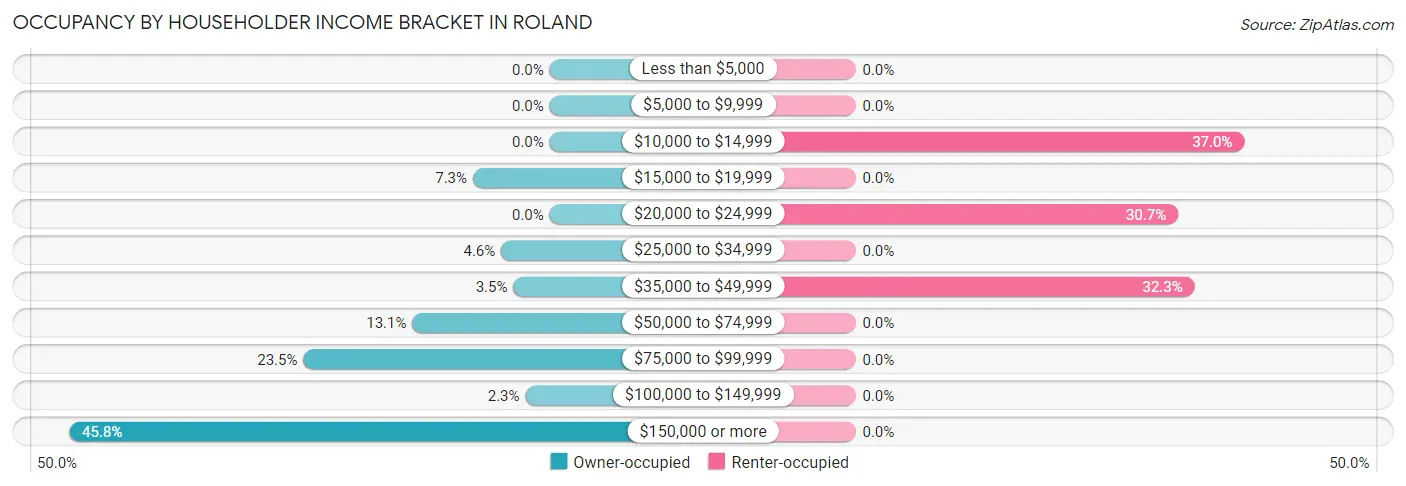
| Income Bracket | Owner-occupied | Renter-occupied |
| Less than $5,000 | 0 (0.0%) | 0 (0.0%) |
| $5,000 to $9,999 | 0 (0.0%) | 0 (0.0%) |
| $10,000 to $14,999 | 0 (0.0%) | 47 (37.0%) |
| $15,000 to $19,999 | 19 (7.3%) | 0 (0.0%) |
| $20,000 to $24,999 | 0 (0.0%) | 39 (30.7%) |
| $25,000 to $34,999 | 12 (4.6%) | 0 (0.0%) |
| $35,000 to $49,999 | 9 (3.5%) | 41 (32.3%) |
| $50,000 to $74,999 | 34 (13.1%) | 0 (0.0%) |
| $75,000 to $99,999 | 61 (23.5%) | 0 (0.0%) |
| $100,000 to $149,999 | 6 (2.3%) | 0 (0.0%) |
| $150,000 or more | 119 (45.8%) | 0 (0.0%) |
| Total | 260 (100.0%) | 127 (100.0%) |
Monthly Housing Cost Tiers in Roland
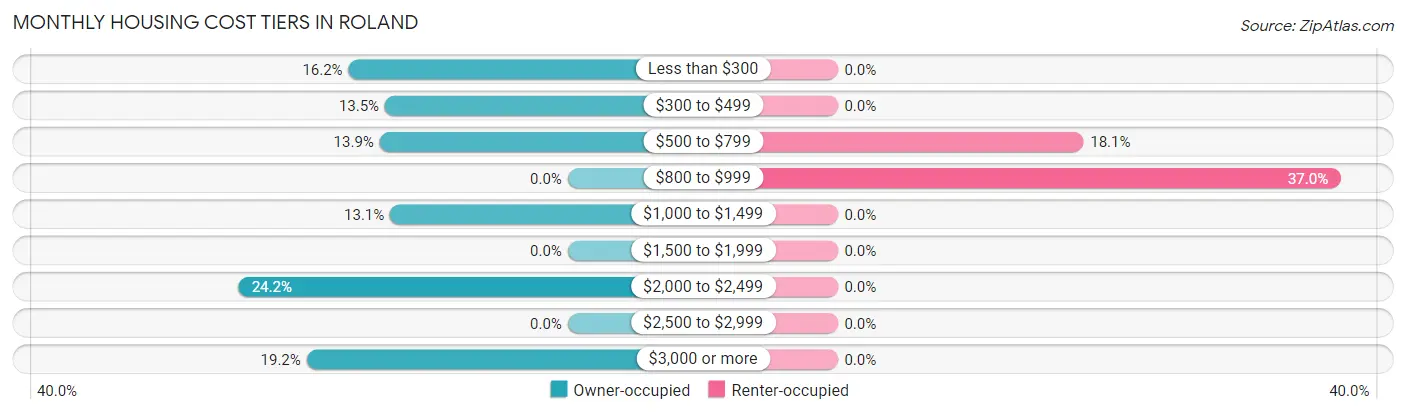
| Monthly Cost | Owner-occupied | Renter-occupied |
| Less than $300 | 42 (16.2%) | 0 (0.0%) |
| $300 to $499 | 35 (13.5%) | 0 (0.0%) |
| $500 to $799 | 36 (13.9%) | 23 (18.1%) |
| $800 to $999 | 0 (0.0%) | 47 (37.0%) |
| $1,000 to $1,499 | 34 (13.1%) | 0 (0.0%) |
| $1,500 to $1,999 | 0 (0.0%) | 0 (0.0%) |
| $2,000 to $2,499 | 63 (24.2%) | 0 (0.0%) |
| $2,500 to $2,999 | 0 (0.0%) | 0 (0.0%) |
| $3,000 or more | 50 (19.2%) | 0 (0.0%) |
| Total | 260 (100.0%) | 127 (100.0%) |
Physical Housing Characteristics in Roland
Housing Structures in Roland
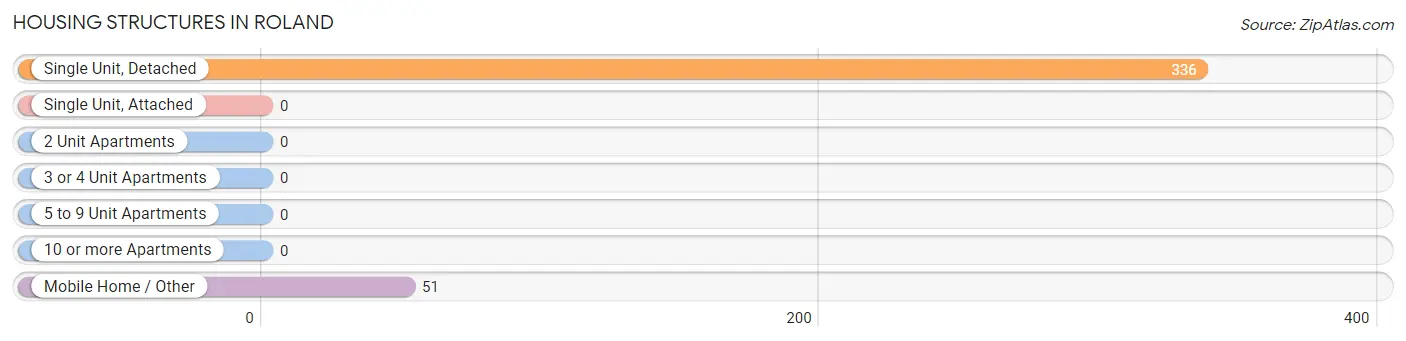
| Structure Type | # Housing Units | % Housing Units |
| Single Unit, Detached | 336 | 86.8% |
| Single Unit, Attached | 0 | 0.0% |
| 2 Unit Apartments | 0 | 0.0% |
| 3 or 4 Unit Apartments | 0 | 0.0% |
| 5 to 9 Unit Apartments | 0 | 0.0% |
| 10 or more Apartments | 0 | 0.0% |
| Mobile Home / Other | 51 | 13.2% |
| Total | 387 | 100.0% |
Housing Structures by Occupancy in Roland
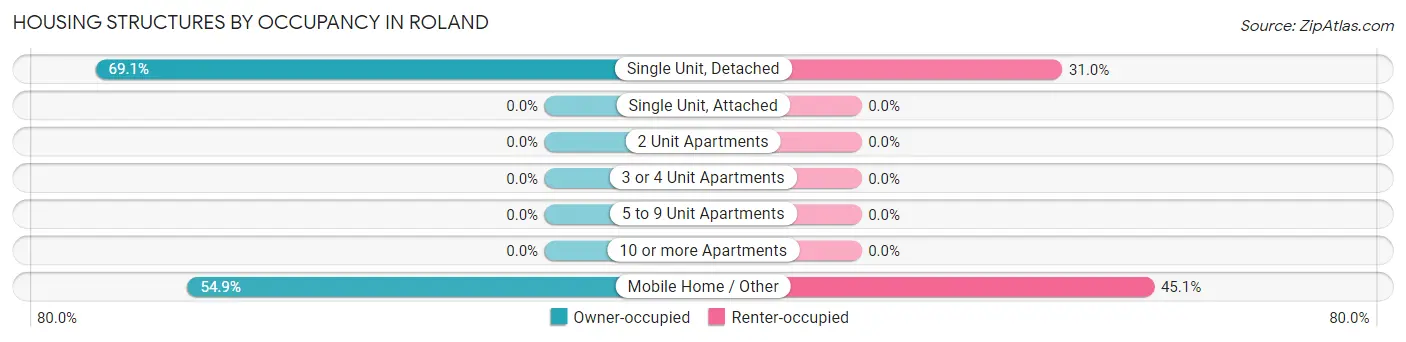
| Structure Type | Owner-occupied | Renter-occupied |
| Single Unit, Detached | 232 (69.1%) | 104 (30.9%) |
| Single Unit, Attached | 0 (0.0%) | 0 (0.0%) |
| 2 Unit Apartments | 0 (0.0%) | 0 (0.0%) |
| 3 or 4 Unit Apartments | 0 (0.0%) | 0 (0.0%) |
| 5 to 9 Unit Apartments | 0 (0.0%) | 0 (0.0%) |
| 10 or more Apartments | 0 (0.0%) | 0 (0.0%) |
| Mobile Home / Other | 28 (54.9%) | 23 (45.1%) |
| Total | 260 (67.2%) | 127 (32.8%) |
Housing Structures by Number of Rooms in Roland
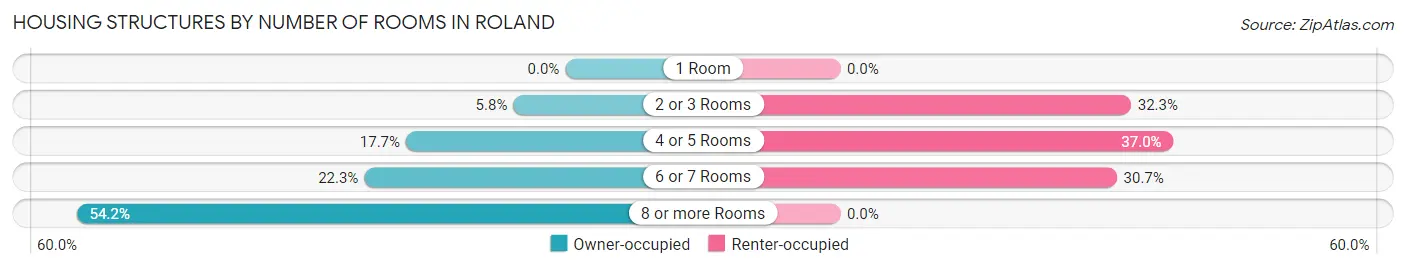
| Number of Rooms | Owner-occupied | Renter-occupied |
| 1 Room | 0 (0.0%) | 0 (0.0%) |
| 2 or 3 Rooms | 15 (5.8%) | 41 (32.3%) |
| 4 or 5 Rooms | 46 (17.7%) | 47 (37.0%) |
| 6 or 7 Rooms | 58 (22.3%) | 39 (30.7%) |
| 8 or more Rooms | 141 (54.2%) | 0 (0.0%) |
| Total | 260 (100.0%) | 127 (100.0%) |
Housing Structure by Heating Type in Roland
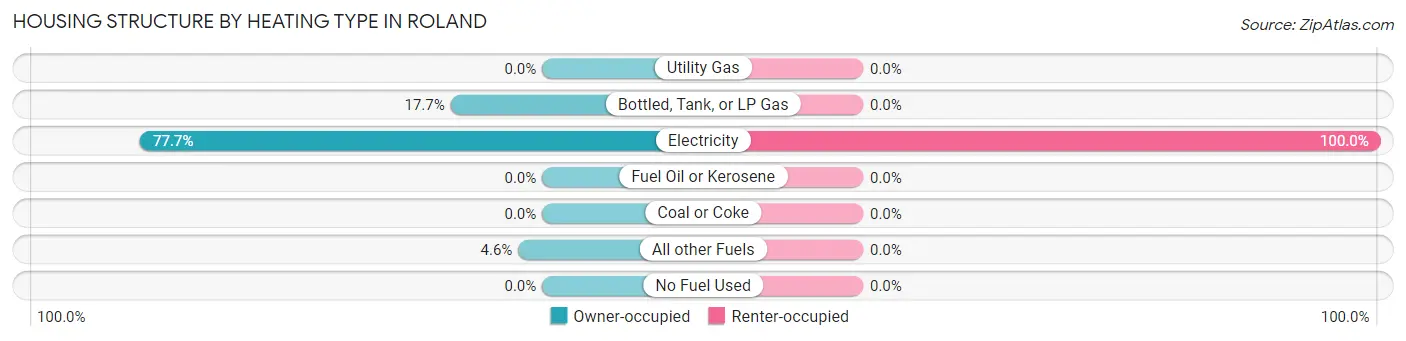
| Heating Type | Owner-occupied | Renter-occupied |
| Utility Gas | 0 (0.0%) | 0 (0.0%) |
| Bottled, Tank, or LP Gas | 46 (17.7%) | 0 (0.0%) |
| Electricity | 202 (77.7%) | 127 (100.0%) |
| Fuel Oil or Kerosene | 0 (0.0%) | 0 (0.0%) |
| Coal or Coke | 0 (0.0%) | 0 (0.0%) |
| All other Fuels | 12 (4.6%) | 0 (0.0%) |
| No Fuel Used | 0 (0.0%) | 0 (0.0%) |
| Total | 260 (100.0%) | 127 (100.0%) |
Household Vehicle Usage in Roland
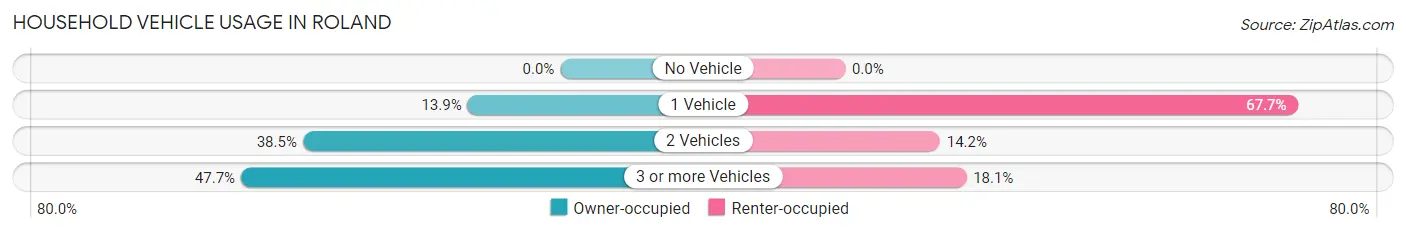
| Vehicles per Household | Owner-occupied | Renter-occupied |
| No Vehicle | 0 (0.0%) | 0 (0.0%) |
| 1 Vehicle | 36 (13.9%) | 86 (67.7%) |
| 2 Vehicles | 100 (38.5%) | 18 (14.2%) |
| 3 or more Vehicles | 124 (47.7%) | 23 (18.1%) |
| Total | 260 (100.0%) | 127 (100.0%) |
Real Estate & Mortgages in Roland
Real Estate and Mortgage Overview in Roland
| Characteristic | Without Mortgage | With Mortgage |
| Housing Units | 86 | 174 |
| Median Property Value | - | - |
| Median Household Income | $50,577 | $113 |
| Monthly Housing Costs | $301 | $50 |
| Real Estate Taxes | $393 | $27 |
Property Value by Mortgage Status in Roland
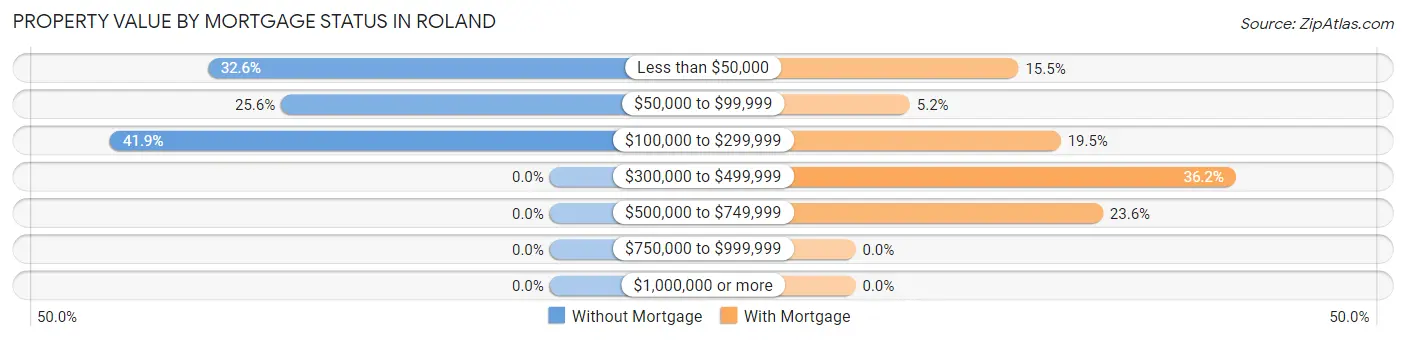
| Property Value | Without Mortgage | With Mortgage |
| Less than $50,000 | 28 (32.6%) | 27 (15.5%) |
| $50,000 to $99,999 | 22 (25.6%) | 9 (5.2%) |
| $100,000 to $299,999 | 36 (41.9%) | 34 (19.5%) |
| $300,000 to $499,999 | 0 (0.0%) | 63 (36.2%) |
| $500,000 to $749,999 | 0 (0.0%) | 41 (23.6%) |
| $750,000 to $999,999 | 0 (0.0%) | 0 (0.0%) |
| $1,000,000 or more | 0 (0.0%) | 0 (0.0%) |
| Total | 86 (100.0%) | 174 (100.0%) |
Household Income by Mortgage Status in Roland
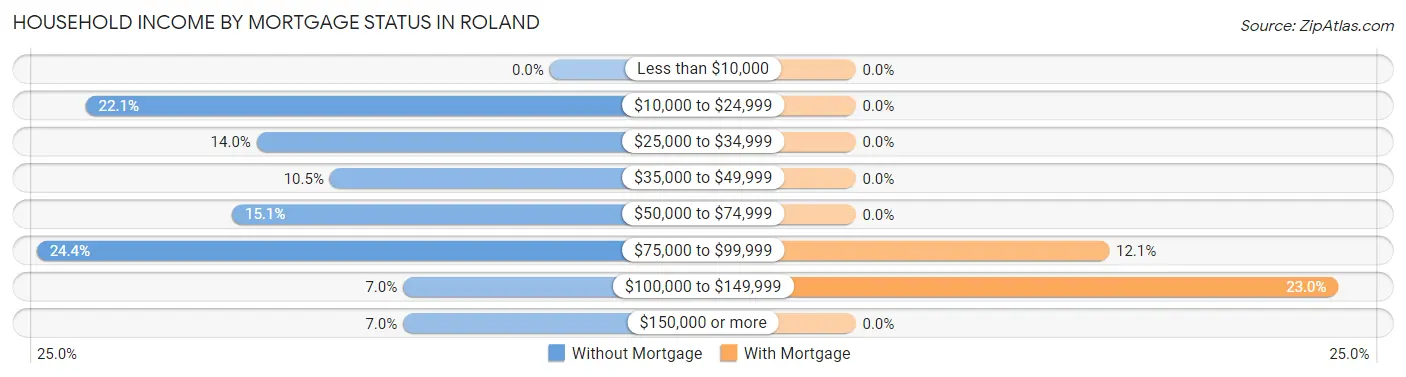
| Household Income | Without Mortgage | With Mortgage |
| Less than $10,000 | 0 (0.0%) | 0 (0.0%) |
| $10,000 to $24,999 | 19 (22.1%) | 0 (0.0%) |
| $25,000 to $34,999 | 12 (14.0%) | 0 (0.0%) |
| $35,000 to $49,999 | 9 (10.5%) | 0 (0.0%) |
| $50,000 to $74,999 | 13 (15.1%) | 0 (0.0%) |
| $75,000 to $99,999 | 21 (24.4%) | 21 (12.1%) |
| $100,000 to $149,999 | 6 (7.0%) | 40 (23.0%) |
| $150,000 or more | 6 (7.0%) | 0 (0.0%) |
| Total | 86 (100.0%) | 174 (100.0%) |
Property Value to Household Income Ratio in Roland
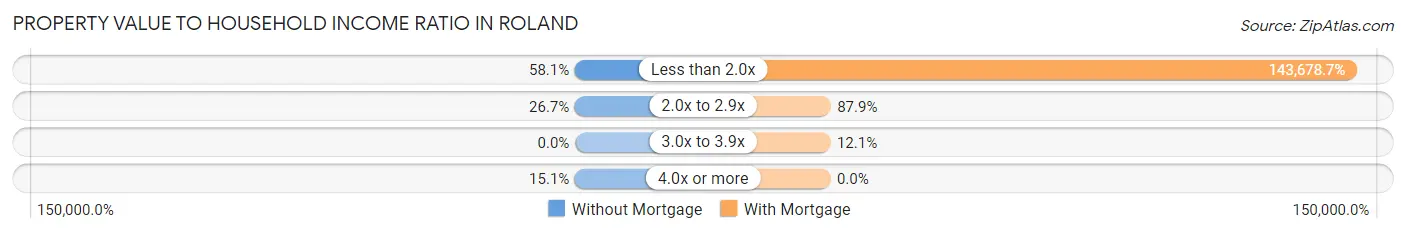
| Value-to-Income Ratio | Without Mortgage | With Mortgage |
| Less than 2.0x | 50 (58.1%) | 250,001 (143,678.7%) |
| 2.0x to 2.9x | 23 (26.7%) | 153 (87.9%) |
| 3.0x to 3.9x | 0 (0.0%) | 21 (12.1%) |
| 4.0x or more | 13 (15.1%) | 0 (0.0%) |
| Total | 86 (100.0%) | 174 (100.0%) |
Real Estate Taxes by Mortgage Status in Roland
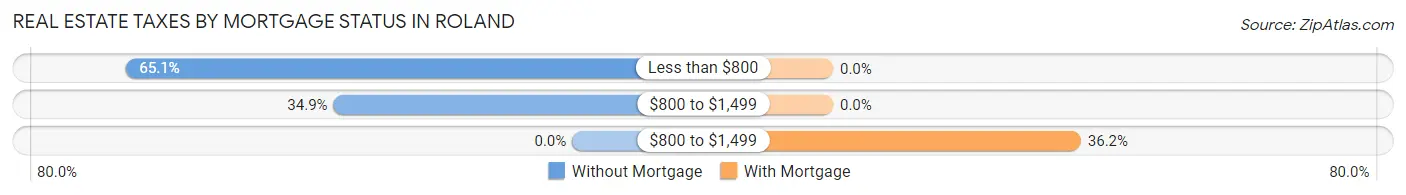
| Property Taxes | Without Mortgage | With Mortgage |
| Less than $800 | 56 (65.1%) | 0 (0.0%) |
| $800 to $1,499 | 30 (34.9%) | 0 (0.0%) |
| $800 to $1,499 | 0 (0.0%) | 63 (36.2%) |
| Total | 86 (100.0%) | 174 (100.0%) |
Health & Disability in Roland
Health Insurance Coverage by Age in Roland
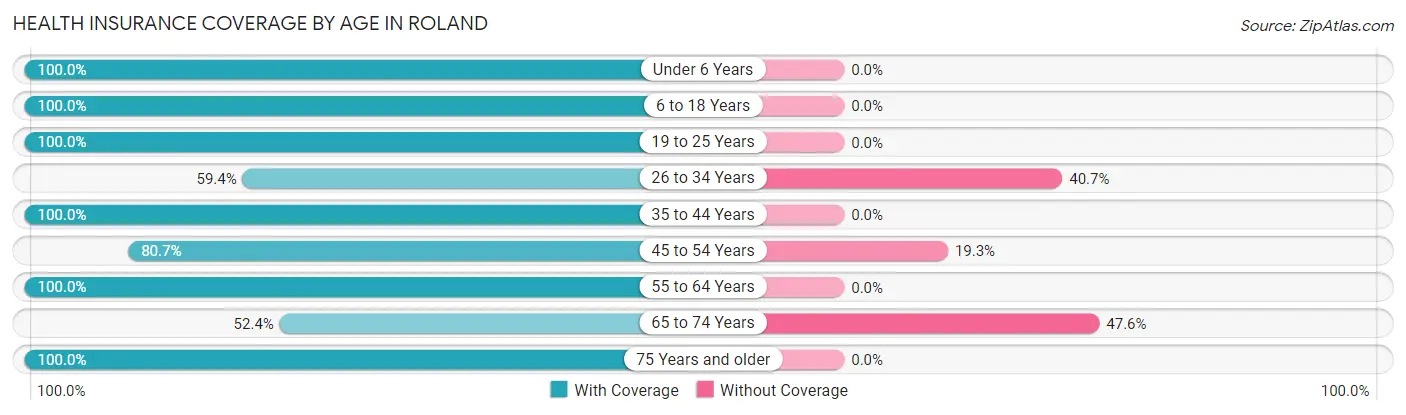
| Age Bracket | With Coverage | Without Coverage |
| Under 6 Years | 57 (100.0%) | 0 (0.0%) |
| 6 to 18 Years | 126 (100.0%) | 0 (0.0%) |
| 19 to 25 Years | 60 (100.0%) | 0 (0.0%) |
| 26 to 34 Years | 92 (59.4%) | 63 (40.6%) |
| 35 to 44 Years | 18 (100.0%) | 0 (0.0%) |
| 45 to 54 Years | 192 (80.7%) | 46 (19.3%) |
| 55 to 64 Years | 179 (100.0%) | 0 (0.0%) |
| 65 to 74 Years | 43 (52.4%) | 39 (47.6%) |
| 75 Years and older | 84 (100.0%) | 0 (0.0%) |
| Total | 851 (85.2%) | 148 (14.8%) |
Health Insurance Coverage by Citizenship Status in Roland
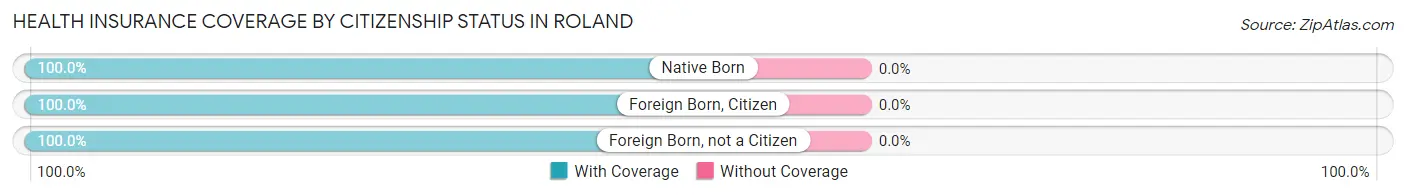
| Citizenship Status | With Coverage | Without Coverage |
| Native Born | 57 (100.0%) | 0 (0.0%) |
| Foreign Born, Citizen | 126 (100.0%) | 0 (0.0%) |
| Foreign Born, not a Citizen | 60 (100.0%) | 0 (0.0%) |
Health Insurance Coverage by Household Income in Roland
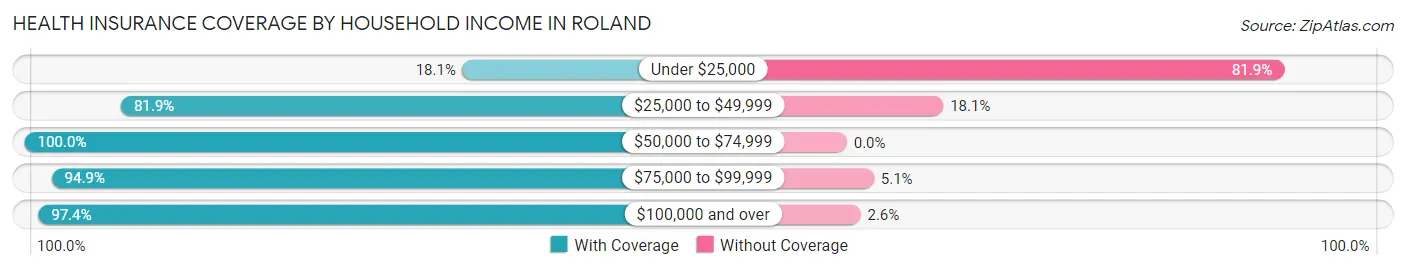
| Household Income | With Coverage | Without Coverage |
| Under $25,000 | 19 (18.1%) | 86 (81.9%) |
| $25,000 to $49,999 | 177 (81.9%) | 39 (18.1%) |
| $50,000 to $74,999 | 52 (100.0%) | 0 (0.0%) |
| $75,000 to $99,999 | 262 (94.9%) | 14 (5.1%) |
| $100,000 and over | 341 (97.4%) | 9 (2.6%) |
Public vs Private Health Insurance Coverage by Age in Roland
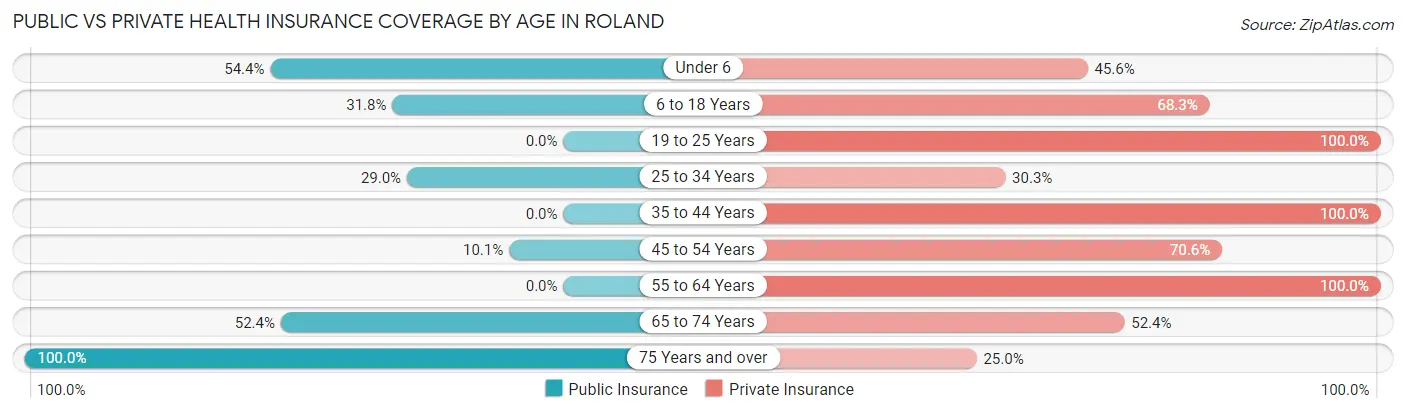
| Age Bracket | Public Insurance | Private Insurance |
| Under 6 | 31 (54.4%) | 26 (45.6%) |
| 6 to 18 Years | 40 (31.8%) | 86 (68.2%) |
| 19 to 25 Years | 0 (0.0%) | 60 (100.0%) |
| 25 to 34 Years | 45 (29.0%) | 47 (30.3%) |
| 35 to 44 Years | 0 (0.0%) | 18 (100.0%) |
| 45 to 54 Years | 24 (10.1%) | 168 (70.6%) |
| 55 to 64 Years | 0 (0.0%) | 179 (100.0%) |
| 65 to 74 Years | 43 (52.4%) | 43 (52.4%) |
| 75 Years and over | 84 (100.0%) | 21 (25.0%) |
| Total | 267 (26.7%) | 648 (64.9%) |
Disability Status by Sex by Age in Roland
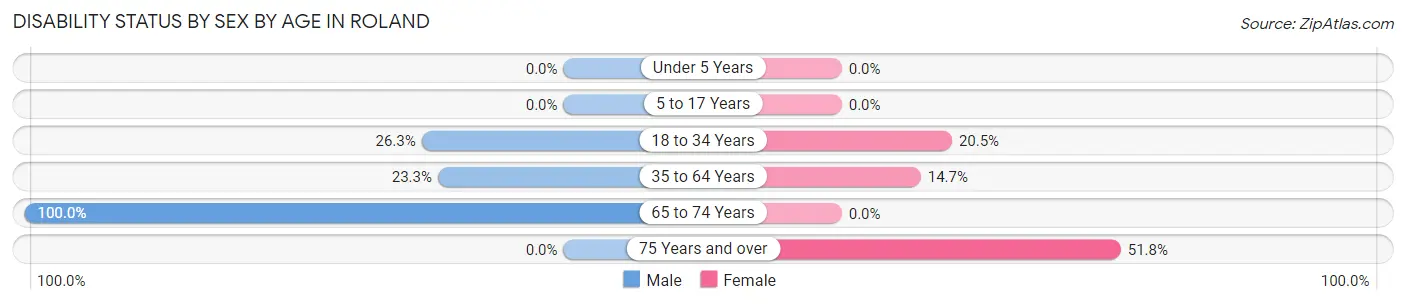
| Age Bracket | Male | Female |
| Under 5 Years | 0 (0.0%) | 0 (0.0%) |
| 5 to 17 Years | 0 (0.0%) | 0 (0.0%) |
| 18 to 34 Years | 45 (26.3%) | 9 (20.4%) |
| 35 to 64 Years | 41 (23.3%) | 38 (14.7%) |
| 65 to 74 Years | 58 (100.0%) | 0 (0.0%) |
| 75 Years and over | 0 (0.0%) | 29 (51.8%) |
Disability Class by Sex by Age in Roland
Disability Class: Hearing Difficulty
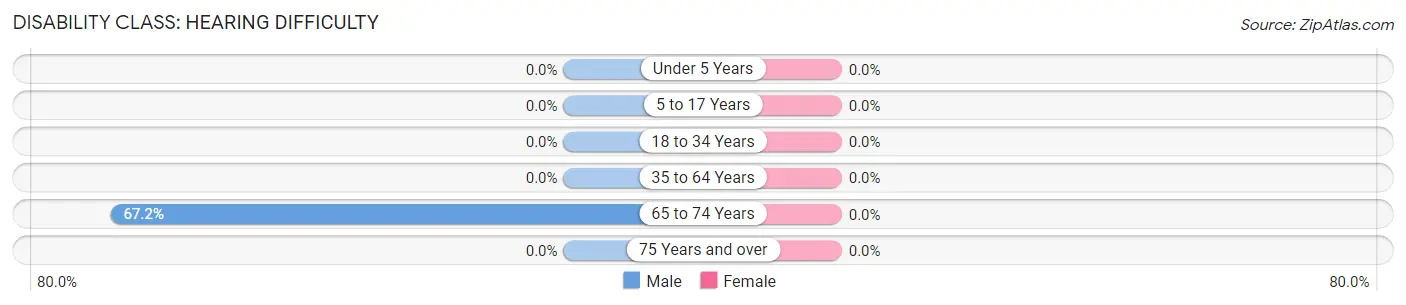
| Age Bracket | Male | Female |
| Under 5 Years | 0 (0.0%) | 0 (0.0%) |
| 5 to 17 Years | 0 (0.0%) | 0 (0.0%) |
| 18 to 34 Years | 0 (0.0%) | 0 (0.0%) |
| 35 to 64 Years | 0 (0.0%) | 0 (0.0%) |
| 65 to 74 Years | 39 (67.2%) | 0 (0.0%) |
| 75 Years and over | 0 (0.0%) | 0 (0.0%) |
Disability Class: Vision Difficulty
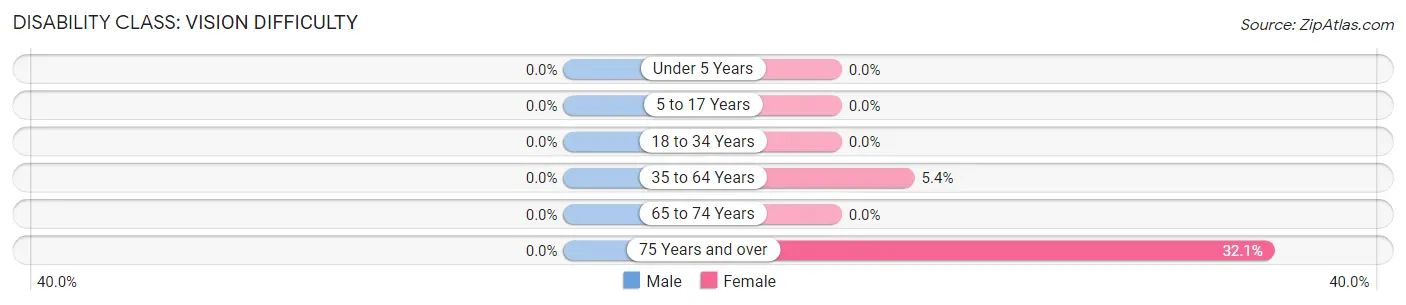
| Age Bracket | Male | Female |
| Under 5 Years | 0 (0.0%) | 0 (0.0%) |
| 5 to 17 Years | 0 (0.0%) | 0 (0.0%) |
| 18 to 34 Years | 0 (0.0%) | 0 (0.0%) |
| 35 to 64 Years | 0 (0.0%) | 14 (5.4%) |
| 65 to 74 Years | 0 (0.0%) | 0 (0.0%) |
| 75 Years and over | 0 (0.0%) | 18 (32.1%) |
Disability Class: Cognitive Difficulty
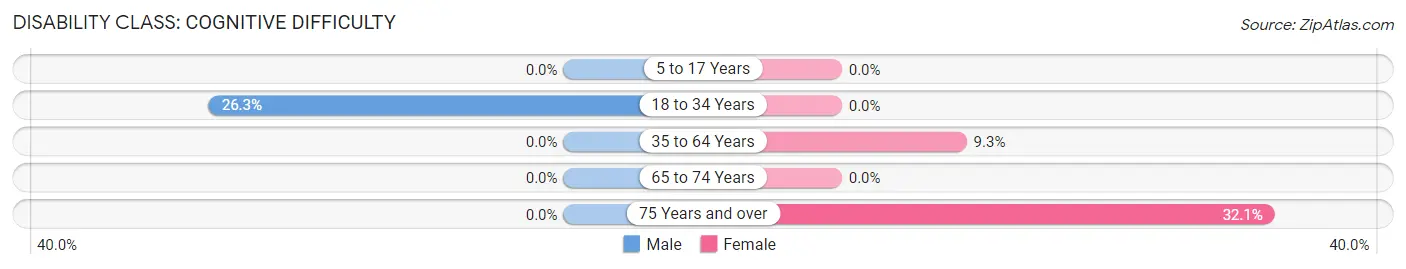
| Age Bracket | Male | Female |
| 5 to 17 Years | 0 (0.0%) | 0 (0.0%) |
| 18 to 34 Years | 45 (26.3%) | 0 (0.0%) |
| 35 to 64 Years | 0 (0.0%) | 24 (9.3%) |
| 65 to 74 Years | 0 (0.0%) | 0 (0.0%) |
| 75 Years and over | 0 (0.0%) | 18 (32.1%) |
Disability Class: Ambulatory Difficulty
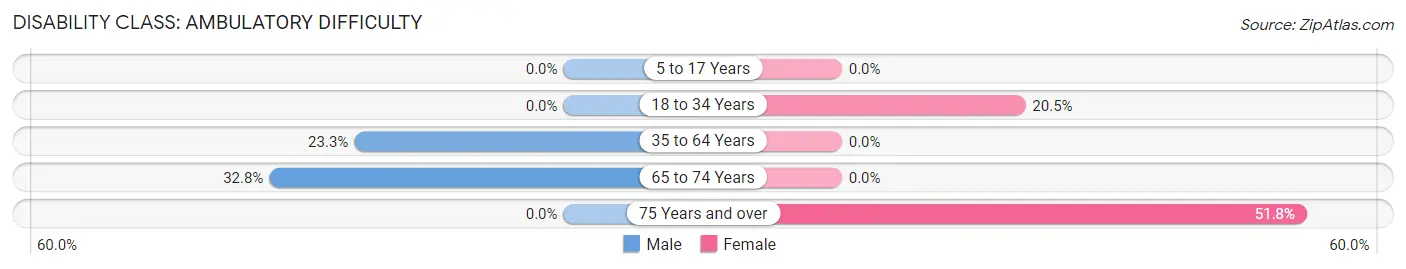
| Age Bracket | Male | Female |
| 5 to 17 Years | 0 (0.0%) | 0 (0.0%) |
| 18 to 34 Years | 0 (0.0%) | 9 (20.4%) |
| 35 to 64 Years | 41 (23.3%) | 0 (0.0%) |
| 65 to 74 Years | 19 (32.8%) | 0 (0.0%) |
| 75 Years and over | 0 (0.0%) | 29 (51.8%) |
Disability Class: Self-Care Difficulty
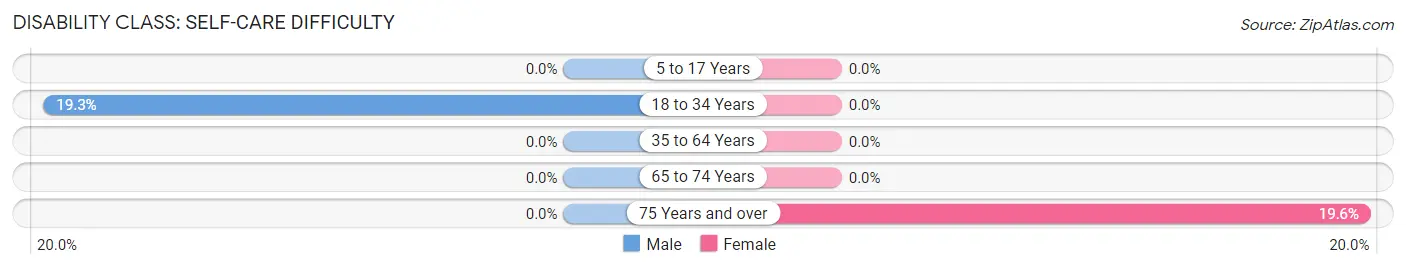
| Age Bracket | Male | Female |
| 5 to 17 Years | 0 (0.0%) | 0 (0.0%) |
| 18 to 34 Years | 33 (19.3%) | 0 (0.0%) |
| 35 to 64 Years | 0 (0.0%) | 0 (0.0%) |
| 65 to 74 Years | 0 (0.0%) | 0 (0.0%) |
| 75 Years and over | 0 (0.0%) | 11 (19.6%) |
Technology Access in Roland
Computing Device Access in Roland
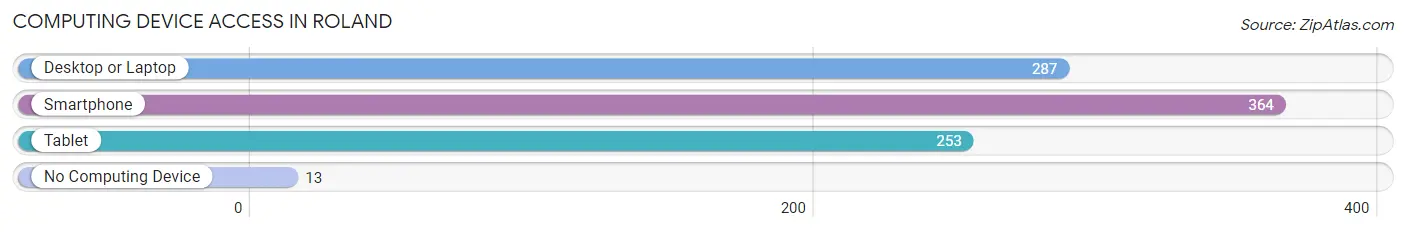
| Device Type | # Households | % Households |
| Desktop or Laptop | 287 | 74.2% |
| Smartphone | 364 | 94.1% |
| Tablet | 253 | 65.4% |
| No Computing Device | 13 | 3.4% |
| Total | 387 | 100.0% |
Internet Access in Roland
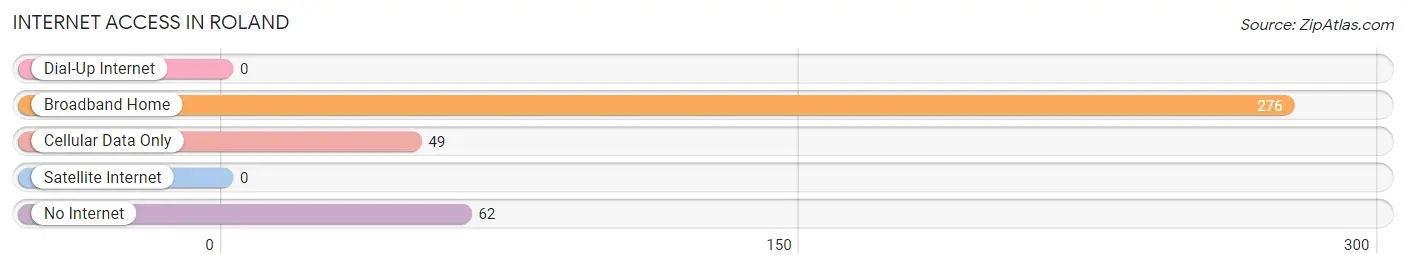
| Internet Type | # Households | % Households |
| Dial-Up Internet | 0 | 0.0% |
| Broadband Home | 276 | 71.3% |
| Cellular Data Only | 49 | 12.7% |
| Satellite Internet | 0 | 0.0% |
| No Internet | 62 | 16.0% |
| Total | 387 | 100.0% |
Roland Summary
Roland is a city located in the northwest corner of Arkansas in the United States. It is part of the Fort Smith metropolitan area and is located in the Arkansas River Valley. The city was founded in 1881 and has a population of approximately 4,000 people.
Geography
Roland is located in the northwest corner of Arkansas in the United States. It is part of the Fort Smith metropolitan area and is located in the Arkansas River Valley. The city is situated on the Arkansas River and is surrounded by the Ozark Mountains. The city has a total area of 4.2 square miles, all of which is land.
History
Roland was founded in 1881 by a group of settlers from Missouri. The city was named after a local Native American chief, Chief Roland. The city was incorporated in 1883 and was a thriving agricultural community. The city was also home to a number of businesses, including a cotton gin, a grist mill, and a sawmill.
In the early 1900s, the city experienced a period of growth and development. The city was home to a number of businesses, including a bank, a hotel, a newspaper, and a movie theater. The city also had a number of churches and schools.
In the 1950s, the city experienced a period of decline as many of the businesses and industries closed. The city was also affected by the construction of Interstate 40, which bypassed the city.
Economy
Roland’s economy is largely based on agriculture and tourism. The city is home to a number of farms and ranches, which produce a variety of crops, including corn, soybeans, and wheat. The city is also home to a number of tourist attractions, including the Ozark National Forest, the Arkansas River, and the Ozark Mountains.
The city is also home to a number of businesses, including a number of restaurants, retail stores, and service providers. The city is also home to a number of manufacturing companies, including a furniture manufacturer and a plastics manufacturer.
Demographics
Roland has a population of approximately 4,000 people. The city has a median age of 38.7 years and a median household income of $41,945. The city is predominantly white, with approximately 87.3% of the population identifying as white. The city also has a small Hispanic population, with approximately 5.3% of the population identifying as Hispanic or Latino.
Conclusion
Roland is a city located in the northwest corner of Arkansas in the United States. It is part of the Fort Smith metropolitan area and is located in the Arkansas River Valley. The city was founded in 1881 and has a population of approximately 4,000 people. The city’s economy is largely based on agriculture and tourism, and the city is home to a number of businesses, including a number of restaurants, retail stores, and service providers. The city is predominantly white, with approximately 87.3% of the population identifying as white.
Common Questions
What is Per Capita Income in Roland?
Per Capita income in Roland is $57,086.
What is the Median Household income in Roland?
Median Household Income in Roland is $67,917.
What is Income or Wage Gap in Roland?
Income or Wage Gap in Roland is 59.9%.
Women in Roland earn 40.1 cents for every dollar earned by a man.
What is Inequality or Gini Index in Roland?
Inequality or Gini Index in Roland is 0.53.
What is the Total Population of Roland?
Total Population of Roland is 999.
What is the Total Male Population of Roland?
Total Male Population of Roland is 545.
What is the Total Female Population of Roland?
Total Female Population of Roland is 454.
What is the Ratio of Males per 100 Females in Roland?
There are 120.04 Males per 100 Females in Roland.
What is the Ratio of Females per 100 Males in Roland?
There are 83.30 Females per 100 Males in Roland.
What is the Median Population Age in Roland?
Median Population Age in Roland is 47.4 Years.
What is the Average Family Size in Roland
Average Family Size in Roland is 3.3 People.
What is the Average Household Size in Roland
Average Household Size in Roland is 2.6 People.
How Large is the Labor Force in Roland?
There are 429 People in the Labor Forcein in Roland.
What is the Percentage of People in the Labor Force in Roland?
52.6% of People are in the Labor Force in Roland.
What is the Unemployment Rate in Roland?
Unemployment Rate in Roland is 4.4%.