Pollard, AR Map & Demographics
Pollard Map
Pollard Overview
$26,071
PER CAPITA INCOME
$55,000
AVG FAMILY INCOME
$43,036
AVG HOUSEHOLD INCOME
45.4%
WAGE / INCOME GAP [ % ]
54.6¢/ $1
WAGE / INCOME GAP [ $ ]
0.37
INEQUALITY / GINI INDEX
198
TOTAL POPULATION
100
MALE POPULATION
98
FEMALE POPULATION
102.04
MALES / 100 FEMALES
98.00
FEMALES / 100 MALES
52.2
MEDIAN AGE
2.9
AVG FAMILY SIZE
2.2
AVG HOUSEHOLD SIZE
104
LABOR FORCE [ PEOPLE ]
59.8%
PERCENT IN LABOR FORCE
15.4%
UNEMPLOYMENT RATE
Pollard Zip Codes
Pollard Area Codes
Income in Pollard
Income Overview in Pollard
Per Capita Income in Pollard is $26,071, while median incomes of families and households are $55,000 and $43,036 respectively.
| Characteristic | Number | Measure |
| Per Capita Income | 198 | $26,071 |
| Median Family Income | 54 | $55,000 |
| Mean Family Income | 54 | $69,907 |
| Median Household Income | 89 | $43,036 |
| Mean Household Income | 89 | $56,663 |
| Income Deficit | 54 | $0 |
| Wage / Income Gap (%) | 198 | 45.43% |
| Wage / Income Gap ($) | 198 | 54.57¢ per $1 |
| Gini / Inequality Index | 198 | 0.37 |
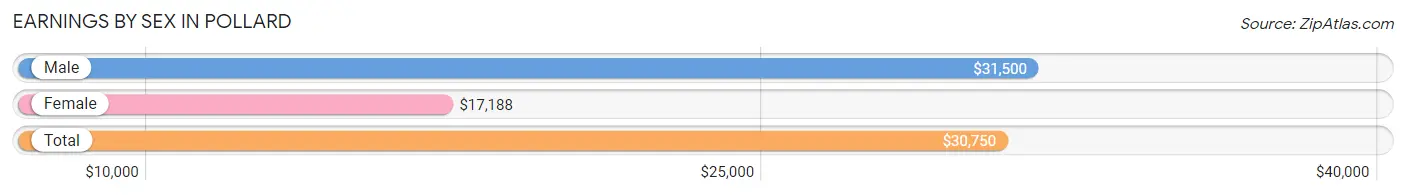
Earnings by Sex in Pollard
Average Earnings in Pollard are $30,750, $31,500 for men and $17,188 for women, a difference of 45.4%.
| Sex | Number | Average Earnings |
| Male | 70 (68.0%) | $31,500 |
| Female | 33 (32.0%) | $17,188 |
| Total | 103 (100.0%) | $30,750 |
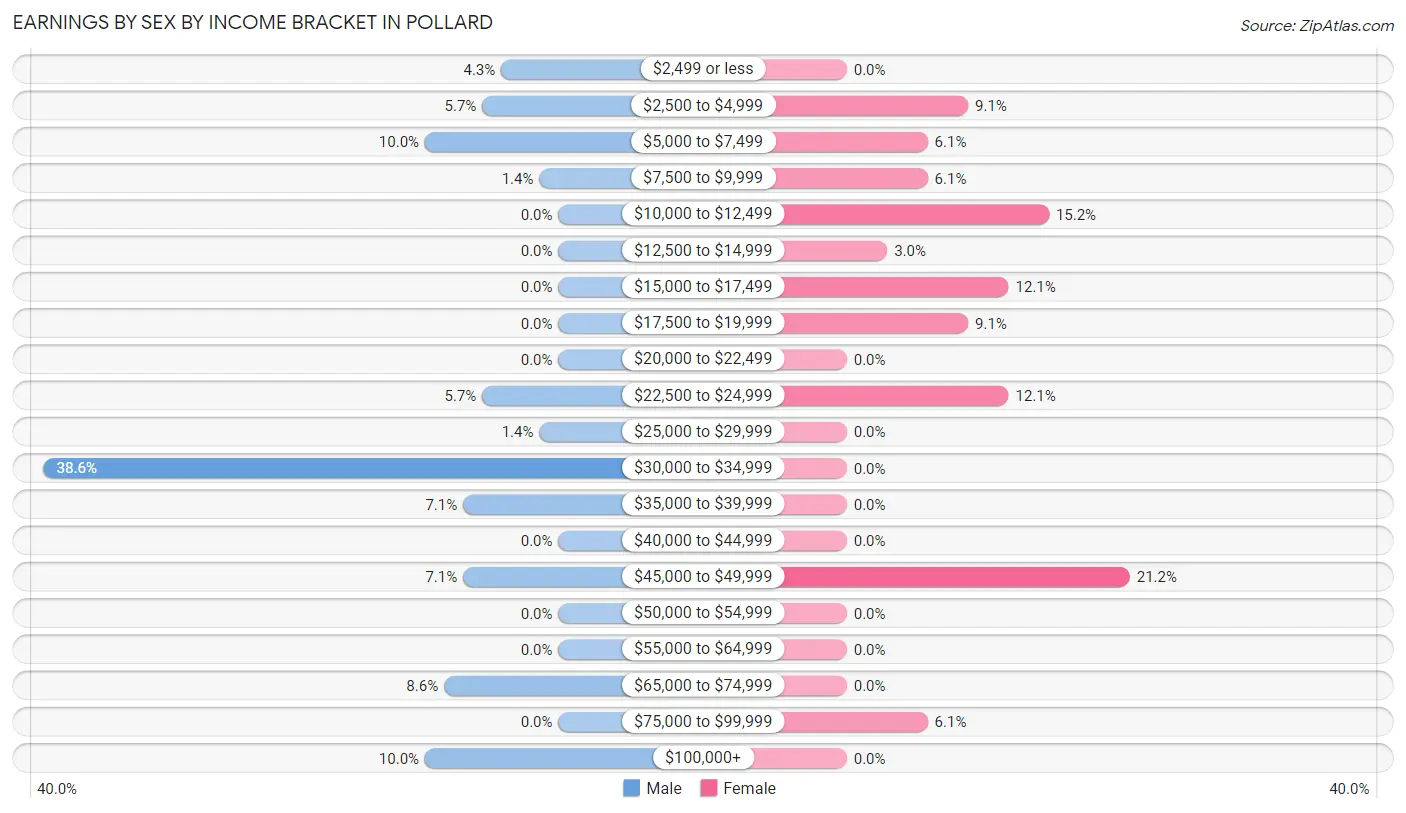
Earnings by Sex by Income Bracket in Pollard
The most common earnings brackets in Pollard are $30,000 to $34,999 for men (27 | 38.6%) and $45,000 to $49,999 for women (7 | 21.2%).
| Income | Male | Female |
| $2,499 or less | 3 (4.3%) | 0 (0.0%) |
| $2,500 to $4,999 | 4 (5.7%) | 3 (9.1%) |
| $5,000 to $7,499 | 7 (10.0%) | 2 (6.1%) |
| $7,500 to $9,999 | 1 (1.4%) | 2 (6.1%) |
| $10,000 to $12,499 | 0 (0.0%) | 5 (15.1%) |
| $12,500 to $14,999 | 0 (0.0%) | 1 (3.0%) |
| $15,000 to $17,499 | 0 (0.0%) | 4 (12.1%) |
| $17,500 to $19,999 | 0 (0.0%) | 3 (9.1%) |
| $20,000 to $22,499 | 0 (0.0%) | 0 (0.0%) |
| $22,500 to $24,999 | 4 (5.7%) | 4 (12.1%) |
| $25,000 to $29,999 | 1 (1.4%) | 0 (0.0%) |
| $30,000 to $34,999 | 27 (38.6%) | 0 (0.0%) |
| $35,000 to $39,999 | 5 (7.1%) | 0 (0.0%) |
| $40,000 to $44,999 | 0 (0.0%) | 0 (0.0%) |
| $45,000 to $49,999 | 5 (7.1%) | 7 (21.2%) |
| $50,000 to $54,999 | 0 (0.0%) | 0 (0.0%) |
| $55,000 to $64,999 | 0 (0.0%) | 0 (0.0%) |
| $65,000 to $74,999 | 6 (8.6%) | 0 (0.0%) |
| $75,000 to $99,999 | 0 (0.0%) | 2 (6.1%) |
| $100,000+ | 7 (10.0%) | 0 (0.0%) |
| Total | 70 (100.0%) | 33 (100.0%) |
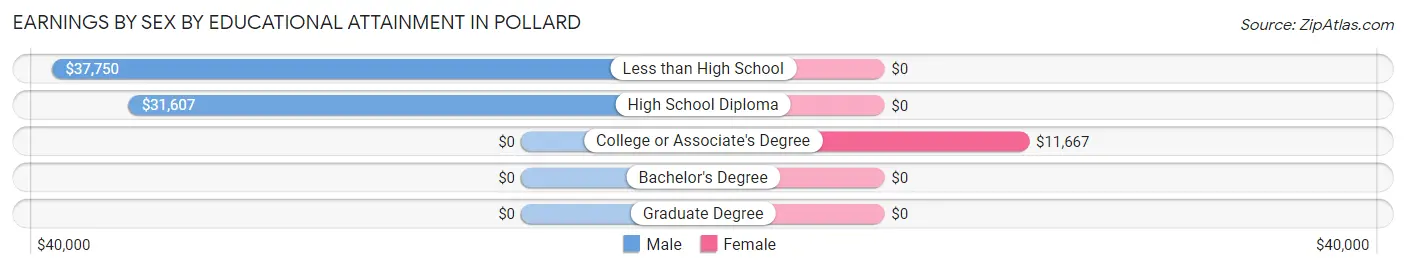
Earnings by Sex by Educational Attainment in Pollard
Average earnings in Pollard are $31,800 for men and $16,250 for women, a difference of 48.9%. Men with an educational attainment of less than high school enjoy the highest average annual earnings of $37,750, while those with high school diploma education earn the least with $31,607. Women with an educational attainment of college or associate's degree earn the most with the average annual earnings of $11,667, while those with college or associate's degree education have the smallest earnings of $11,667.
| Educational Attainment | Male Income | Female Income |
| Less than High School | $37,750 | $0 |
| High School Diploma | $31,607 | $0 |
| College or Associate's Degree | - | - |
| Bachelor's Degree | - | - |
| Graduate Degree | - | - |
| Total | $31,800 | $16,250 |
Family Income in Pollard
Family Income Brackets in Pollard
According to the Pollard family income data, there are 12 families falling into the $100,000 to $149,999 income range, which is the most common income bracket and makes up 22.2% of all families.
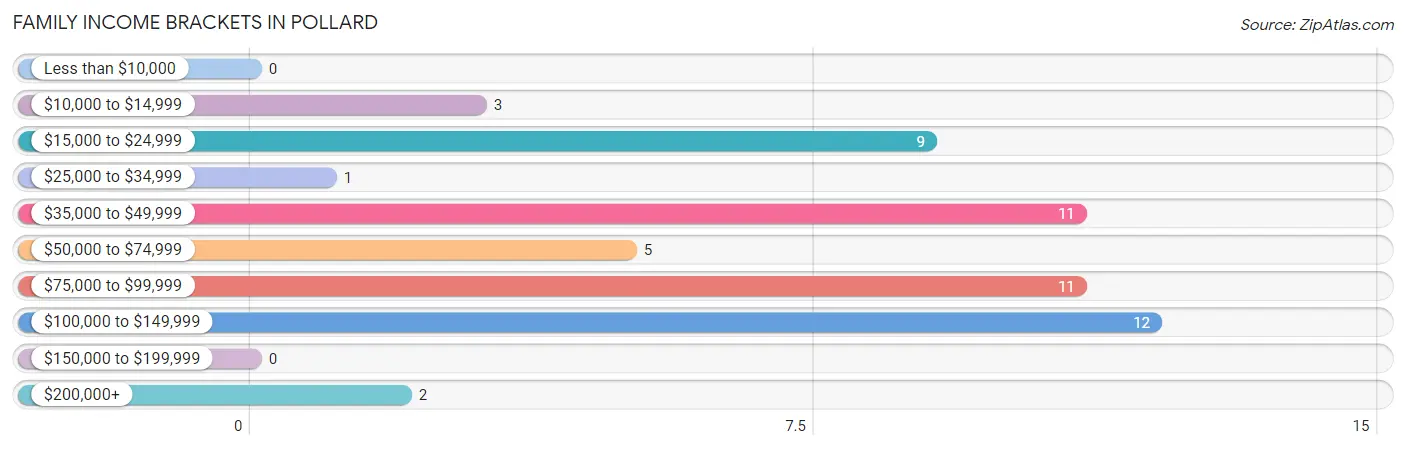
| Income Bracket | # Families | % Families |
| Less than $10,000 | 0 | 0.0% |
| $10,000 to $14,999 | 3 | 5.6% |
| $15,000 to $24,999 | 9 | 16.7% |
| $25,000 to $34,999 | 1 | 1.9% |
| $35,000 to $49,999 | 11 | 20.4% |
| $50,000 to $74,999 | 5 | 9.3% |
| $75,000 to $99,999 | 11 | 20.4% |
| $100,000 to $149,999 | 12 | 22.2% |
| $150,000 to $199,999 | 0 | 0.0% |
| $200,000+ | 2 | 3.7% |
Family Income by Famaliy Size in Pollard
3-person families (11 | 20.4%) account for the highest median family income in Pollard with $97,188 per family, while 3-person families (11 | 20.4%) have the highest median income of $32,396 per family member.
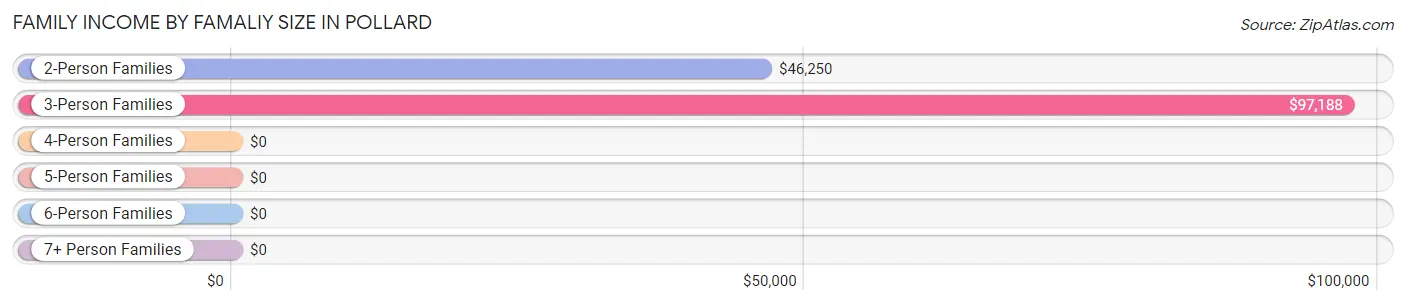
| Income Bracket | # Families | Median Income |
| 2-Person Families | 33 (61.1%) | $46,250 |
| 3-Person Families | 11 (20.4%) | $97,188 |
| 4-Person Families | 7 (13.0%) | $0 |
| 5-Person Families | 3 (5.6%) | $0 |
| 6-Person Families | 0 (0.0%) | $0 |
| 7+ Person Families | 0 (0.0%) | $0 |
| Total | 54 (100.0%) | $55,000 |
Family Income by Number of Earners in Pollard
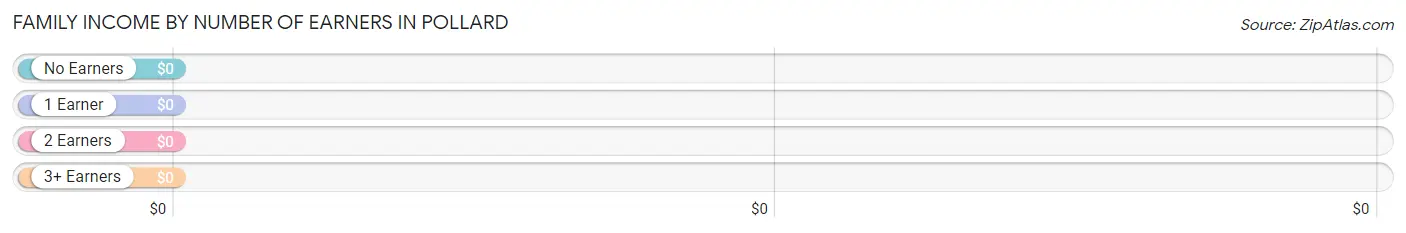
| Number of Earners | # Families | Median Income |
| No Earners | 8 (14.8%) | $0 |
| 1 Earner | 27 (50.0%) | $0 |
| 2 Earners | 13 (24.1%) | $0 |
| 3+ Earners | 6 (11.1%) | $0 |
| Total | 54 (100.0%) | $55,000 |
Household Income in Pollard
Household Income Brackets in Pollard
With 31 households falling in the category, the $35,000 to $49,999 income range is the most frequent in Pollard, accounting for 34.8% of all households.
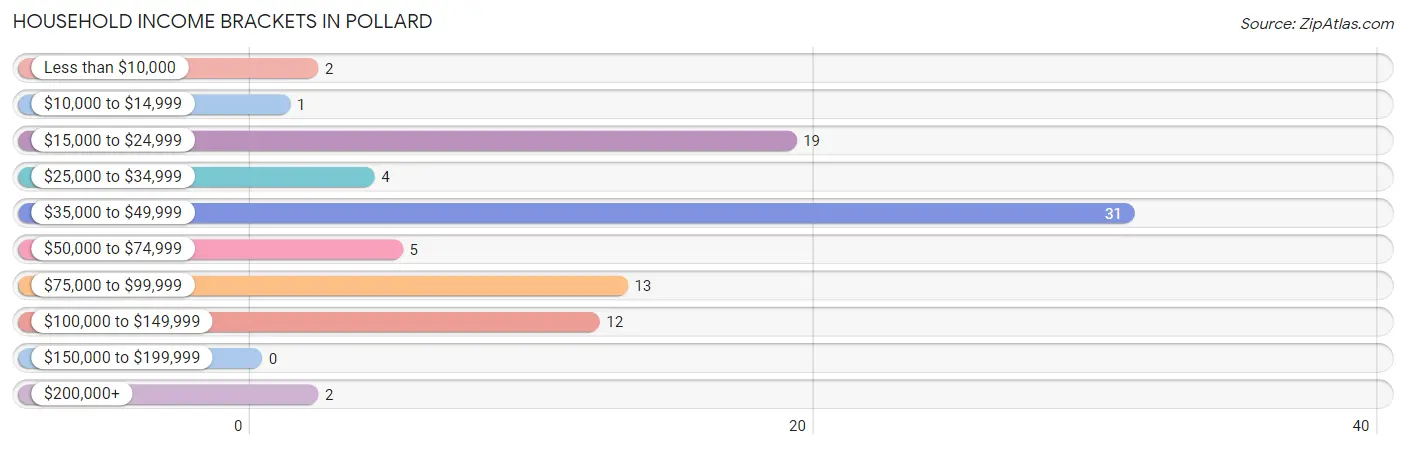
| Income Bracket | # Households | % Households |
| Less than $10,000 | 2 | 2.2% |
| $10,000 to $14,999 | 1 | 1.1% |
| $15,000 to $24,999 | 19 | 21.3% |
| $25,000 to $34,999 | 4 | 4.5% |
| $35,000 to $49,999 | 31 | 34.8% |
| $50,000 to $74,999 | 5 | 5.6% |
| $75,000 to $99,999 | 13 | 14.6% |
| $100,000 to $149,999 | 12 | 13.5% |
| $150,000 to $199,999 | 0 | 0.0% |
| $200,000+ | 2 | 2.2% |
Household Income by Householder Age in Pollard
The median household income in Pollard is $43,036, with the highest median household income of $46,250 found in the 65+ years age bracket for the primary householder. A total of 30 households (33.7%) fall into this category.
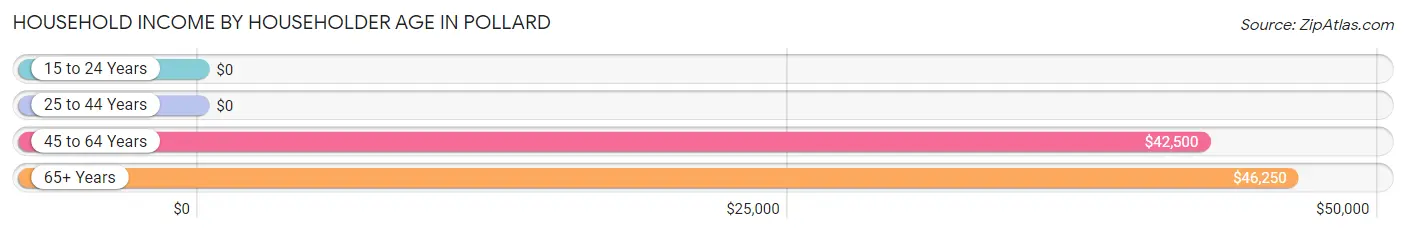
| Income Bracket | # Households | Median Income |
| 15 to 24 Years | 0 (0.0%) | $0 |
| 25 to 44 Years | 23 (25.8%) | $0 |
| 45 to 64 Years | 36 (40.5%) | $42,500 |
| 65+ Years | 30 (33.7%) | $46,250 |
| Total | 89 (100.0%) | $43,036 |
Poverty in Pollard
Income Below Poverty by Sex and Age in Pollard
With 8.0% poverty level for males and 25.8% for females among the residents of Pollard, 55 to 64 year old males and 6 to 11 year old females are the most vulnerable to poverty, with 6 males (40.0%) and 1 females (100.0%) in their respective age groups living below the poverty level.
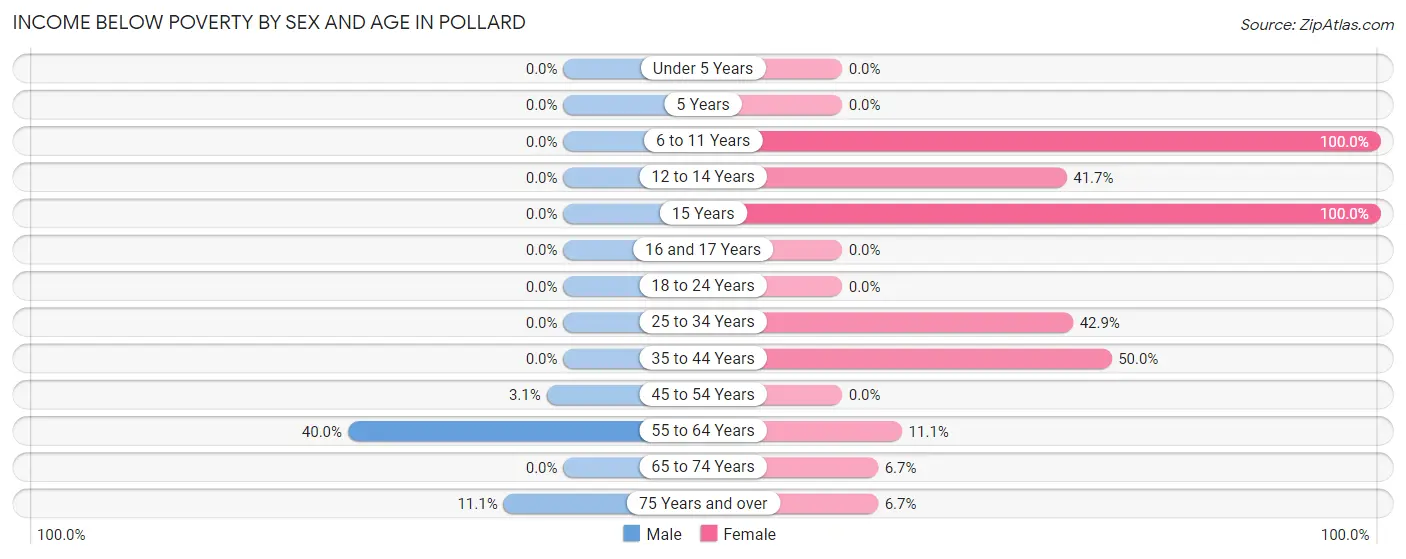
| Age Bracket | Male | Female |
| Under 5 Years | 0 (0.0%) | 0 (0.0%) |
| 5 Years | 0 (0.0%) | 0 (0.0%) |
| 6 to 11 Years | 0 (0.0%) | 1 (100.0%) |
| 12 to 14 Years | 0 (0.0%) | 5 (41.7%) |
| 15 Years | 0 (0.0%) | 8 (100.0%) |
| 16 and 17 Years | 0 (0.0%) | 0 (0.0%) |
| 18 to 24 Years | 0 (0.0%) | 0 (0.0%) |
| 25 to 34 Years | 0 (0.0%) | 3 (42.9%) |
| 35 to 44 Years | 0 (0.0%) | 5 (50.0%) |
| 45 to 54 Years | 1 (3.1%) | 0 (0.0%) |
| 55 to 64 Years | 6 (40.0%) | 1 (11.1%) |
| 65 to 74 Years | 0 (0.0%) | 1 (6.7%) |
| 75 Years and over | 1 (11.1%) | 1 (6.7%) |
| Total | 8 (8.0%) | 25 (25.8%) |
Income Above Poverty by Sex and Age in Pollard
According to the poverty statistics in Pollard, males aged 12 to 14 years and females aged 18 to 24 years are the age groups that are most secure financially, with 100.0% of males and 100.0% of females in these age groups living above the poverty line.
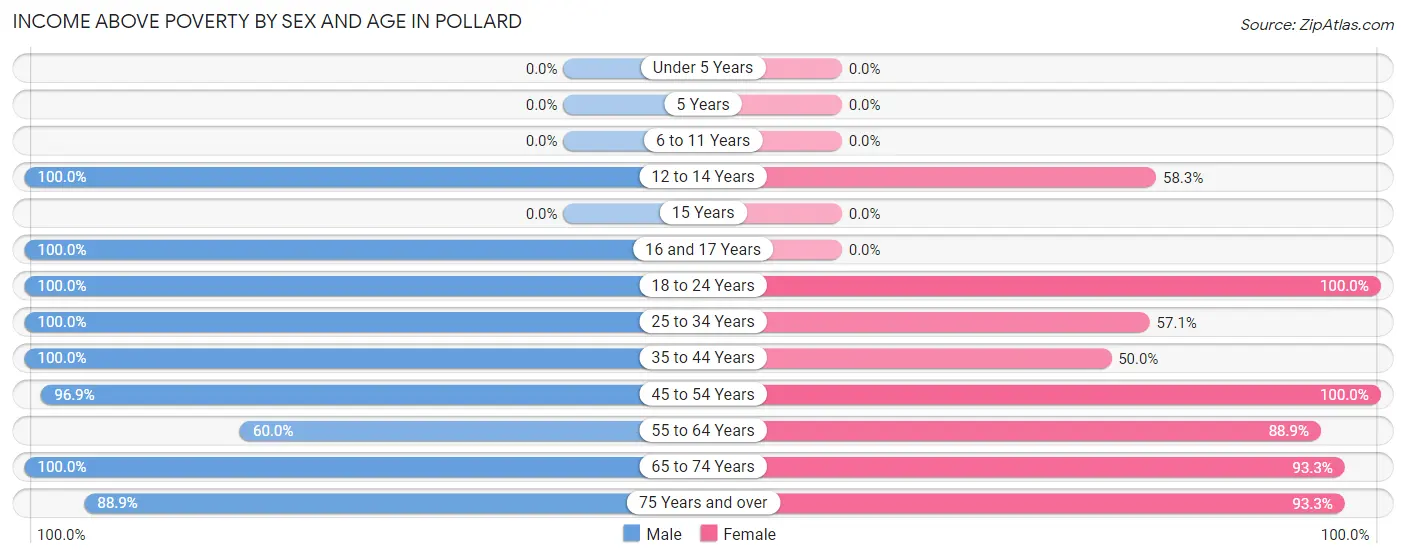
| Age Bracket | Male | Female |
| Under 5 Years | 0 (0.0%) | 0 (0.0%) |
| 5 Years | 0 (0.0%) | 0 (0.0%) |
| 6 to 11 Years | 0 (0.0%) | 0 (0.0%) |
| 12 to 14 Years | 2 (100.0%) | 7 (58.3%) |
| 15 Years | 0 (0.0%) | 0 (0.0%) |
| 16 and 17 Years | 3 (100.0%) | 0 (0.0%) |
| 18 to 24 Years | 6 (100.0%) | 9 (100.0%) |
| 25 to 34 Years | 6 (100.0%) | 4 (57.1%) |
| 35 to 44 Years | 13 (100.0%) | 5 (50.0%) |
| 45 to 54 Years | 31 (96.9%) | 11 (100.0%) |
| 55 to 64 Years | 9 (60.0%) | 8 (88.9%) |
| 65 to 74 Years | 14 (100.0%) | 14 (93.3%) |
| 75 Years and over | 8 (88.9%) | 14 (93.3%) |
| Total | 92 (92.0%) | 72 (74.2%) |
Income Below Poverty Among Married-Couple Families in Pollard
The poverty statistics for married-couple families in Pollard show that 11.1% or 5 of the total 45 families live below the poverty line. Families with 1 or 2 children have the highest poverty rate of 38.5%, comprising of 5 families. On the other hand, families with no children have the lowest poverty rate of 0.0%, which includes 0 families.
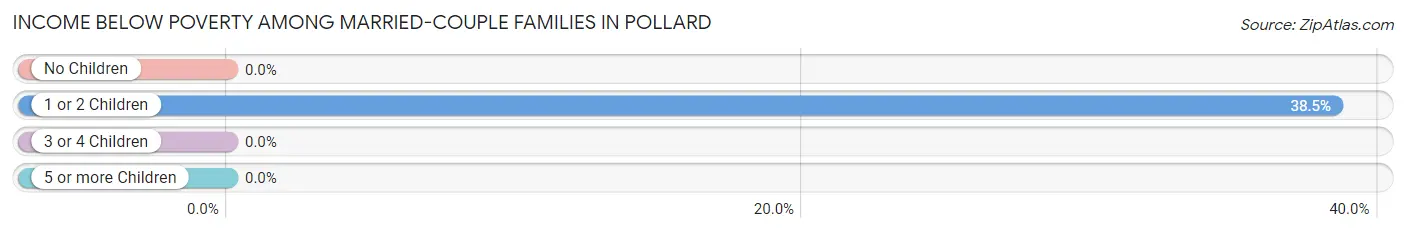
| Children | Above Poverty | Below Poverty |
| No Children | 32 (100.0%) | 0 (0.0%) |
| 1 or 2 Children | 8 (61.5%) | 5 (38.5%) |
| 3 or 4 Children | 0 (0.0%) | 0 (0.0%) |
| 5 or more Children | 0 (0.0%) | 0 (0.0%) |
| Total | 40 (88.9%) | 5 (11.1%) |
Income Below Poverty Among Single-Parent Households in Pollard
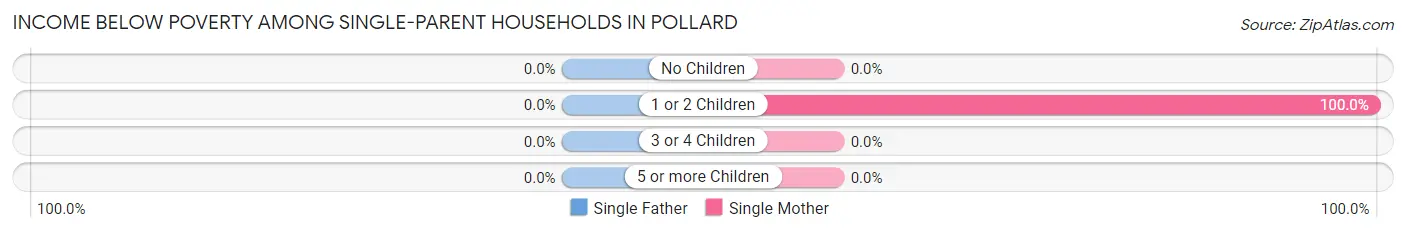
| Children | Single Father | Single Mother |
| No Children | 0 (0.0%) | 0 (0.0%) |
| 1 or 2 Children | 0 (0.0%) | 3 (100.0%) |
| 3 or 4 Children | 0 (0.0%) | 0 (0.0%) |
| 5 or more Children | 0 (0.0%) | 0 (0.0%) |
| Total | 0 (0.0%) | 3 (75.0%) |
Income Below Poverty Among Married-Couple vs Single-Parent Households in Pollard
The poverty data for Pollard shows that 5 of the married-couple family households (11.1%) and 3 of the single-parent households (33.3%) are living below the poverty level. Within the married-couple family households, those with 1 or 2 children have the highest poverty rate, with 5 households (38.5%) falling below the poverty line. Among the single-parent households, those with 1 or 2 children have the highest poverty rate, with 3 household (100.0%) living below poverty.
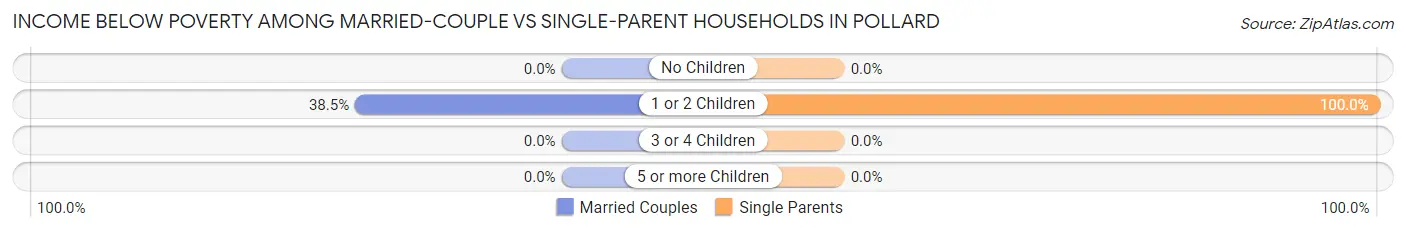
| Children | Married-Couple Families | Single-Parent Households |
| No Children | 0 (0.0%) | 0 (0.0%) |
| 1 or 2 Children | 5 (38.5%) | 3 (100.0%) |
| 3 or 4 Children | 0 (0.0%) | 0 (0.0%) |
| 5 or more Children | 0 (0.0%) | 0 (0.0%) |
| Total | 5 (11.1%) | 3 (33.3%) |
Race in Pollard
The most populous races in Pollard are White / Caucasian (194 | 98.0%), and Two or more Races (4 | 2.0%).
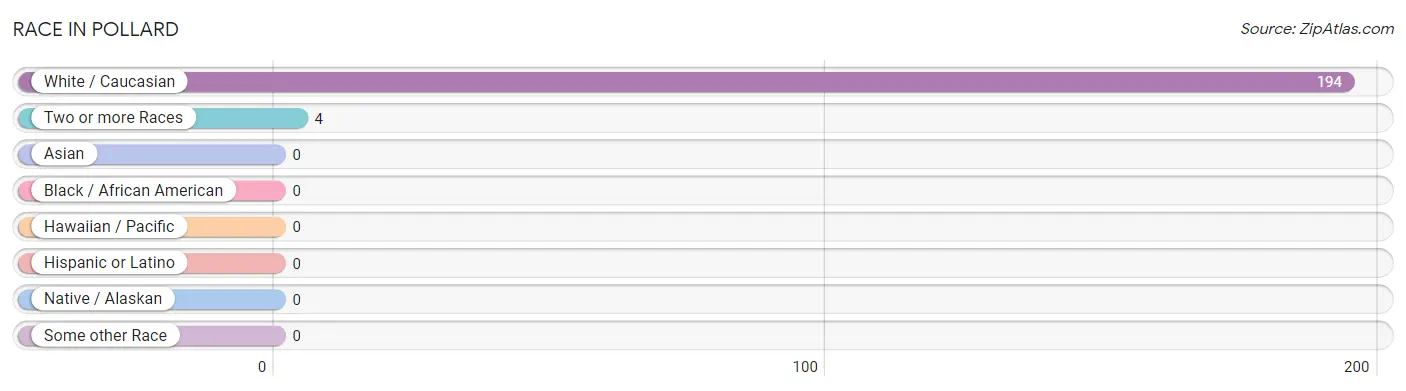
| Race | # Population | % Population |
| Asian | 0 | 0.0% |
| Black / African American | 0 | 0.0% |
| Hawaiian / Pacific | 0 | 0.0% |
| Hispanic or Latino | 0 | 0.0% |
| Native / Alaskan | 0 | 0.0% |
| White / Caucasian | 194 | 98.0% |
| Two or more Races | 4 | 2.0% |
| Some other Race | 0 | 0.0% |
| Total | 198 | 100.0% |
Ancestry in Pollard
The most populous ancestries reported in Pollard are German (30 | 15.1%), American (22 | 11.1%), Irish (10 | 5.1%), English (9 | 4.5%), and French (8 | 4.0%), together accounting for 39.9% of all Pollard residents.
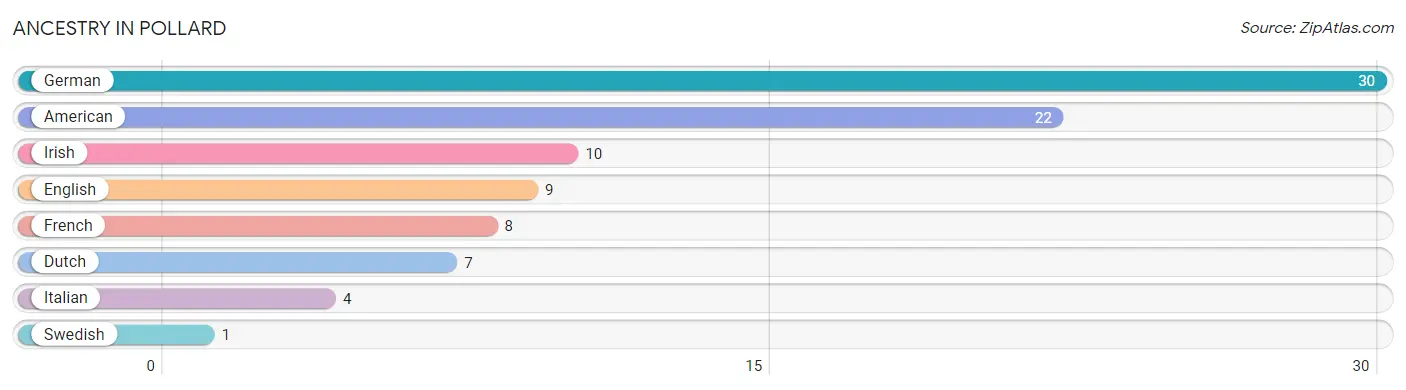
| Ancestry | # Population | % Population |
| American | 22 | 11.1% |
| Dutch | 7 | 3.5% |
| English | 9 | 4.5% |
| French | 8 | 4.0% |
| German | 30 | 15.1% |
| Irish | 10 | 5.1% |
| Italian | 4 | 2.0% |
| Swedish | 1 | 0.5% | View All 8 Rows |
Immigrants in Pollard

| Immigration Origin | # Population | % Population | View All 0 Rows |
Sex and Age in Pollard
Sex and Age in Pollard
The most populous age groups in Pollard are 50 to 54 Years (30 | 30.0%) for men and 75 to 79 Years (14 | 14.3%) for women.
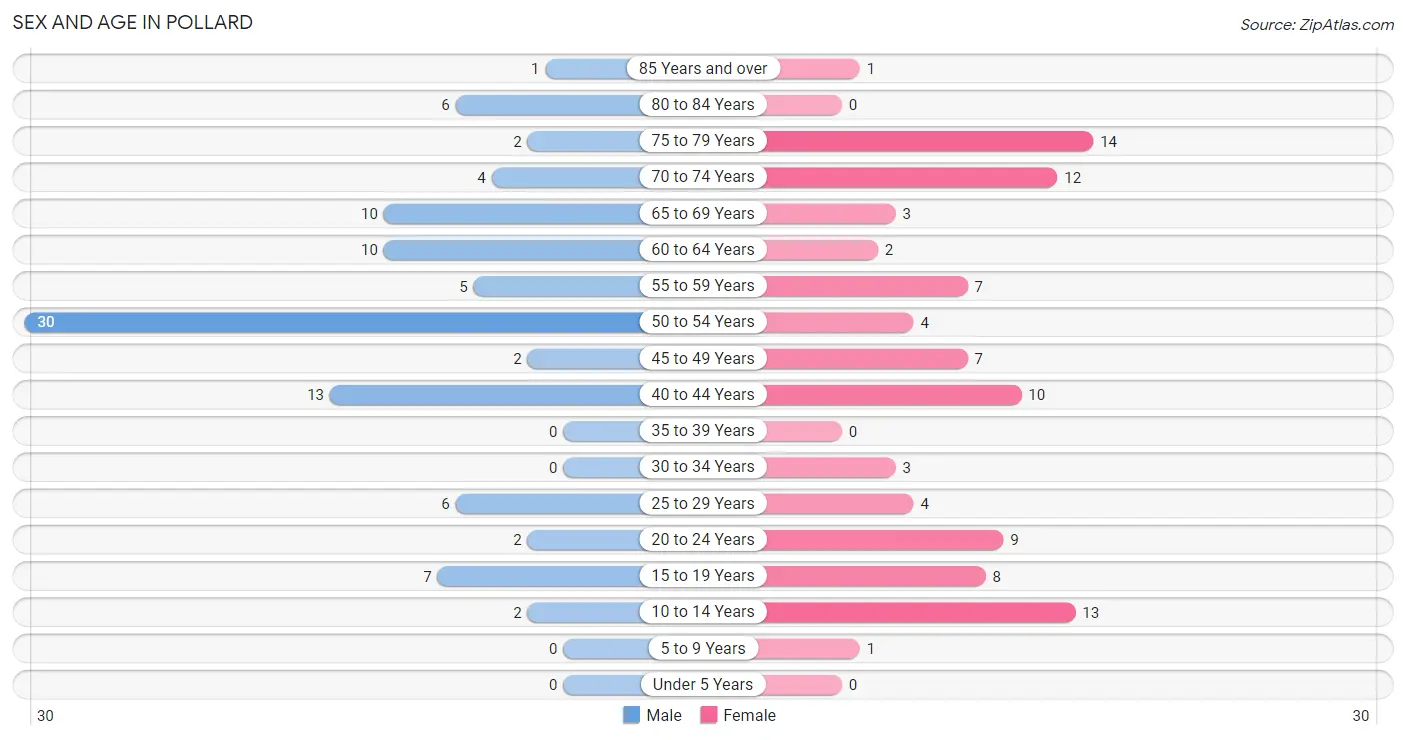
| Age Bracket | Male | Female |
| Under 5 Years | 0 (0.0%) | 0 (0.0%) |
| 5 to 9 Years | 0 (0.0%) | 1 (1.0%) |
| 10 to 14 Years | 2 (2.0%) | 13 (13.3%) |
| 15 to 19 Years | 7 (7.0%) | 8 (8.2%) |
| 20 to 24 Years | 2 (2.0%) | 9 (9.2%) |
| 25 to 29 Years | 6 (6.0%) | 4 (4.1%) |
| 30 to 34 Years | 0 (0.0%) | 3 (3.1%) |
| 35 to 39 Years | 0 (0.0%) | 0 (0.0%) |
| 40 to 44 Years | 13 (13.0%) | 10 (10.2%) |
| 45 to 49 Years | 2 (2.0%) | 7 (7.1%) |
| 50 to 54 Years | 30 (30.0%) | 4 (4.1%) |
| 55 to 59 Years | 5 (5.0%) | 7 (7.1%) |
| 60 to 64 Years | 10 (10.0%) | 2 (2.0%) |
| 65 to 69 Years | 10 (10.0%) | 3 (3.1%) |
| 70 to 74 Years | 4 (4.0%) | 12 (12.2%) |
| 75 to 79 Years | 2 (2.0%) | 14 (14.3%) |
| 80 to 84 Years | 6 (6.0%) | 0 (0.0%) |
| 85 Years and over | 1 (1.0%) | 1 (1.0%) |
| Total | 100 (100.0%) | 98 (100.0%) |
Families and Households in Pollard
Median Family Size in Pollard
The median family size in Pollard is 2.91 persons per family, with married-couple families (45 | 83.3%) accounting for the largest median family size of 3.09 persons per family. On the other hand, single female/mother families (4 | 7.4%) represent the smallest median family size with 1.50 persons per family.
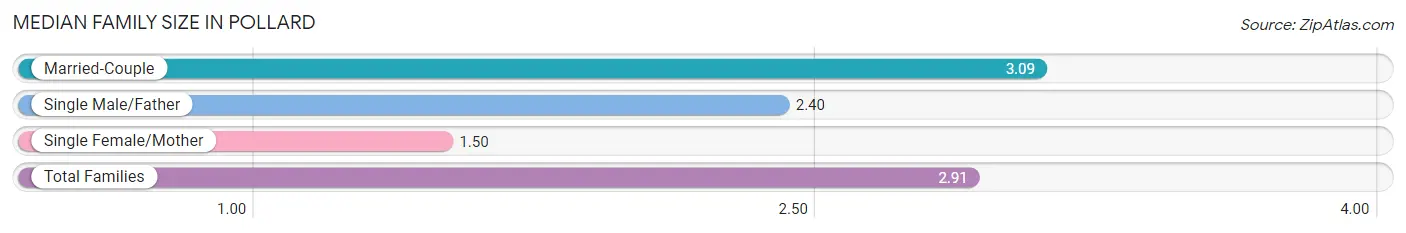
| Family Type | # Families | Family Size |
| Married-Couple | 45 (83.3%) | 3.09 |
| Single Male/Father | 5 (9.3%) | 2.40 |
| Single Female/Mother | 4 (7.4%) | 1.50 |
| Total Families | 54 (100.0%) | 2.91 |
Median Household Size in Pollard
The median household size in Pollard is 2.22 persons per household, with married-couple households (45 | 50.6%) accounting for the largest median household size of 3.11 persons per household. non-family households (35 | 39.3%) represent the smallest median household size with 1.09 persons per household.
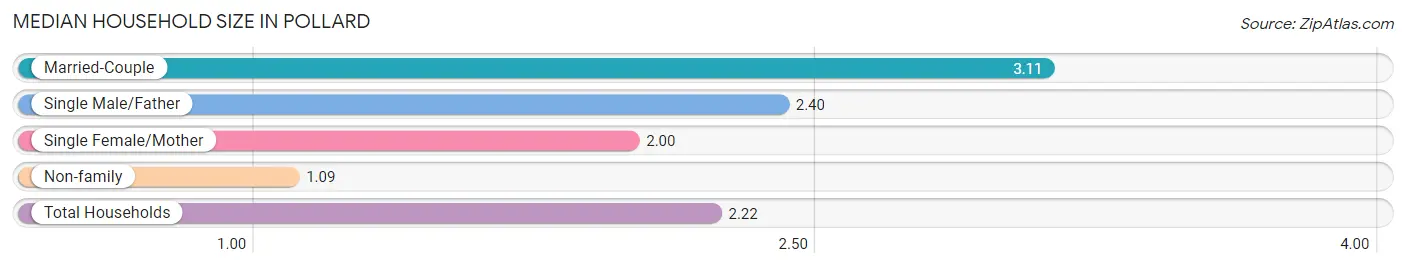
| Household Type | # Households | Household Size |
| Married-Couple | 45 (50.6%) | 3.11 |
| Single Male/Father | 5 (5.6%) | 2.40 |
| Single Female/Mother | 4 (4.5%) | 2.00 |
| Non-family | 35 (39.3%) | 1.09 |
| Total Households | 89 (100.0%) | 2.22 |
Household Size by Marriage Status in Pollard
Out of a total of 89 households in Pollard, 54 (60.7%) are family households, while 35 (39.3%) are nonfamily households. The most numerous type of family households are 2-person households, comprising 29, and the most common type of nonfamily households are 1-person households, comprising 33.
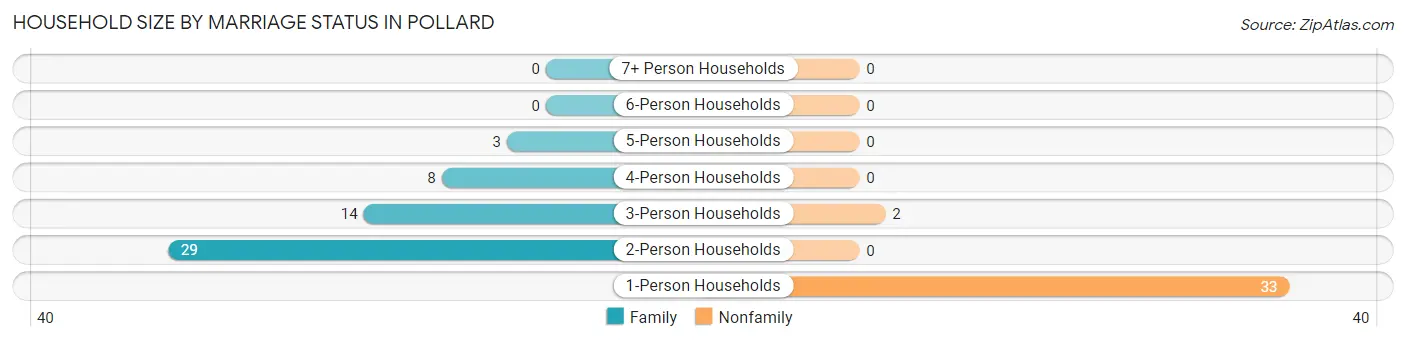
| Household Size | Family Households | Nonfamily Households |
| 1-Person Households | - | 33 (37.1%) |
| 2-Person Households | 29 (32.6%) | 0 (0.0%) |
| 3-Person Households | 14 (15.7%) | 2 (2.2%) |
| 4-Person Households | 8 (9.0%) | 0 (0.0%) |
| 5-Person Households | 3 (3.4%) | 0 (0.0%) |
| 6-Person Households | 0 (0.0%) | 0 (0.0%) |
| 7+ Person Households | 0 (0.0%) | 0 (0.0%) |
| Total | 54 (60.7%) | 35 (39.3%) |
Female Fertility in Pollard
Fertility by Age in Pollard
| Age Bracket | Women with Births | Births / 1,000 Women |
| 15 to 19 years | 0 (0.0%) | 0.0 |
| 20 to 34 years | 0 (0.0%) | 0.0 |
| 35 to 50 years | 0 (0.0%) | 0.0 |
| Total | 0 (0.0%) | 0.0 |
Fertility by Age by Marriage Status in Pollard
| Age Bracket | Married | Unmarried |
| 15 to 19 years | 0 (0.0%) | 0 (0.0%) |
| 20 to 34 years | 0 (0.0%) | 0 (0.0%) |
| 35 to 50 years | 0 (0.0%) | 0 (0.0%) |
| Total | 0 (0.0%) | 0 (0.0%) |
Fertility by Education in Pollard
| Educational Attainment | Women with Births | Births / 1,000 Women |
| Less than High School | 0 (0.0%) | 0.0 |
| High School Diploma | 0 (0.0%) | 0.0 |
| College or Associate's Degree | 0 (0.0%) | 0.0 |
| Bachelor's Degree | 0 (0.0%) | 0.0 |
| Graduate Degree | 0 (0.0%) | 0.0 |
| Total | 0 (0.0%) | 0.0 |
Fertility by Education by Marriage Status in Pollard
| Educational Attainment | Married | Unmarried |
| Less than High School | 0 (0.0%) | 0 (0.0%) |
| High School Diploma | 0 (0.0%) | 0 (0.0%) |
| College or Associate's Degree | 0 (0.0%) | 0 (0.0%) |
| Bachelor's Degree | 0 (0.0%) | 0 (0.0%) |
| Graduate Degree | 0 (0.0%) | 0 (0.0%) |
| Total | 0 (0.0%) | 0 (0.0%) |
Employment Characteristics in Pollard
Employment by Class of Employer in Pollard
Among the 88 employed individuals in Pollard, private company employees (43 | 48.9%), self-employed (not incorporated) (16 | 18.2%), and federal government employees (9 | 10.2%) make up the most common classes of employment.
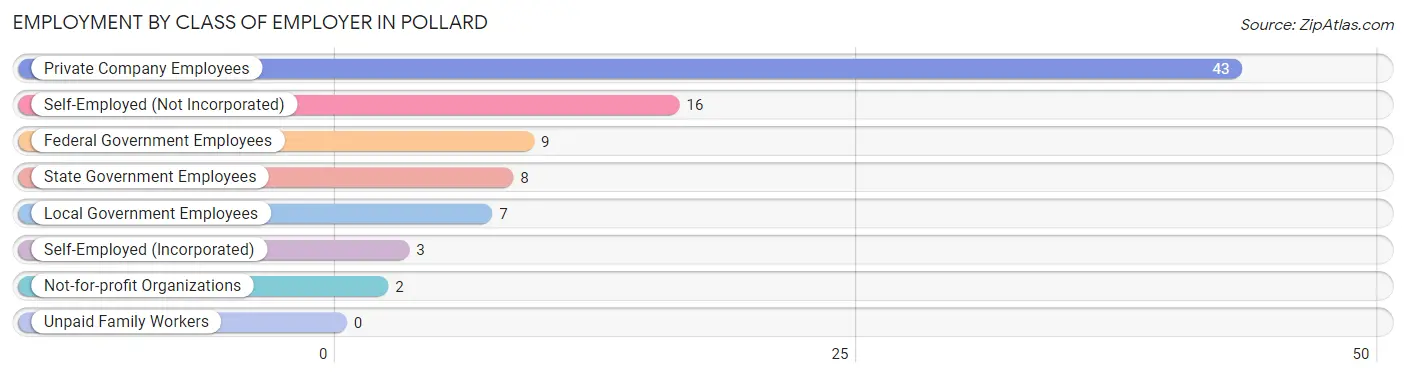
| Employer Class | # Employees | % Employees |
| Private Company Employees | 43 | 48.9% |
| Self-Employed (Incorporated) | 3 | 3.4% |
| Self-Employed (Not Incorporated) | 16 | 18.2% |
| Not-for-profit Organizations | 2 | 2.3% |
| Local Government Employees | 7 | 8.0% |
| State Government Employees | 8 | 9.1% |
| Federal Government Employees | 9 | 10.2% |
| Unpaid Family Workers | 0 | 0.0% |
| Total | 88 | 100.0% |
Employment Status by Age in Pollard
According to the labor force statistics for Pollard, out of the total population over 16 years of age (174), 59.8% or 104 individuals are in the labor force, with 15.4% or 16 of them unemployed. The age group with the highest labor force participation rate is 20 to 24 years, with 100.0% or 11 individuals in the labor force. Within the labor force, the 35 to 44 years age range has the highest percentage of unemployed individuals, with 60.0% or 9 of them being unemployed.
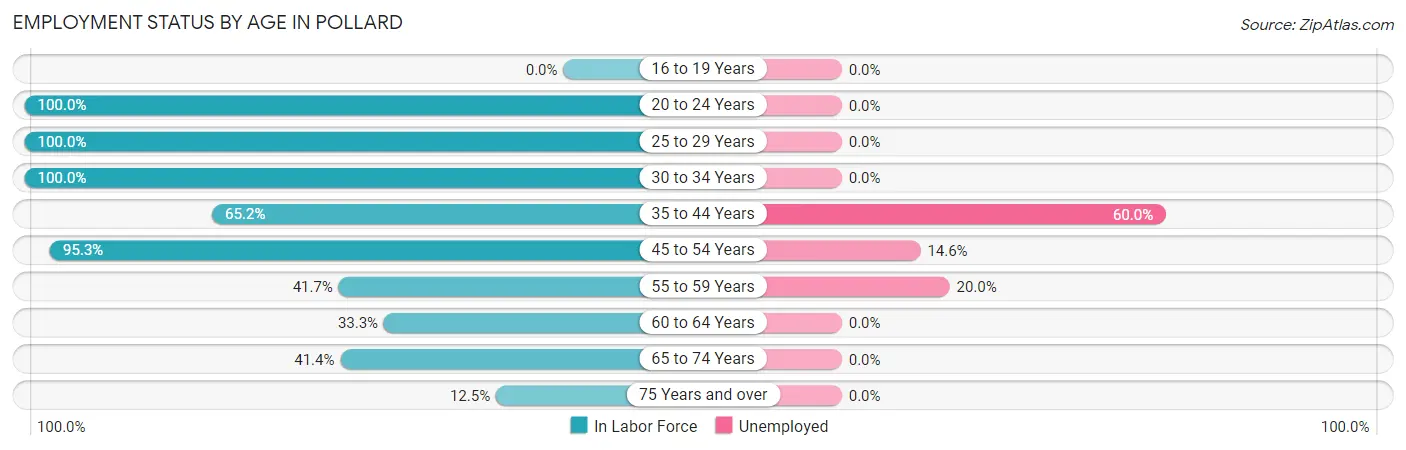
| Age Bracket | In Labor Force | Unemployed |
| 16 to 19 Years | 0 (0.0%) | 0 (0.0%) |
| 20 to 24 Years | 11 (100.0%) | 0 (0.0%) |
| 25 to 29 Years | 10 (100.0%) | 0 (0.0%) |
| 30 to 34 Years | 3 (100.0%) | 0 (0.0%) |
| 35 to 44 Years | 15 (65.2%) | 9 (60.0%) |
| 45 to 54 Years | 41 (95.3%) | 6 (14.6%) |
| 55 to 59 Years | 5 (41.7%) | 1 (20.0%) |
| 60 to 64 Years | 4 (33.3%) | 0 (0.0%) |
| 65 to 74 Years | 12 (41.4%) | 0 (0.0%) |
| 75 Years and over | 3 (12.5%) | 0 (0.0%) |
| Total | 104 (59.8%) | 16 (15.4%) |
Employment Status by Educational Attainment in Pollard
According to labor force statistics for Pollard, 75.7% of individuals (78) out of the total population between 25 and 64 years of age (103) are in the labor force, with 20.5% or 16 of them being unemployed. The group with the highest labor force participation rate are those with the educational attainment of less than high school, with 100.0% or 11 individuals in the labor force. Within the labor force, individuals with less than high school education have the highest percentage of unemployment, with 45.5% or 5 of them being unemployed.
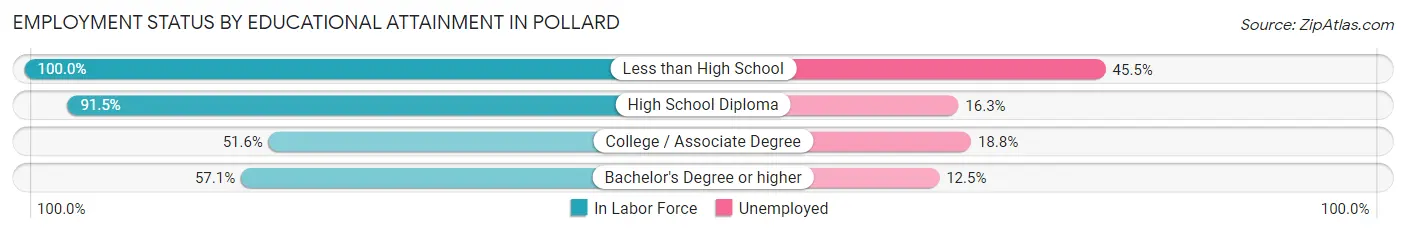
| Educational Attainment | In Labor Force | Unemployed |
| Less than High School | 11 (100.0%) | 5 (45.5%) |
| High School Diploma | 43 (91.5%) | 8 (16.3%) |
| College / Associate Degree | 16 (51.6%) | 6 (18.8%) |
| Bachelor's Degree or higher | 8 (57.1%) | 2 (12.5%) |
| Total | 78 (75.7%) | 21 (20.5%) |
Employment Occupations by Sex in Pollard
Management, Business, Science and Arts Occupations
The most common Management, Business, Science and Arts occupations in Pollard are Community & Social Service (10 | 11.4%), Education Instruction & Library (10 | 11.4%), Health Diagnosing & Treating (4 | 4.5%), and Business & Financial (2 | 2.3%).
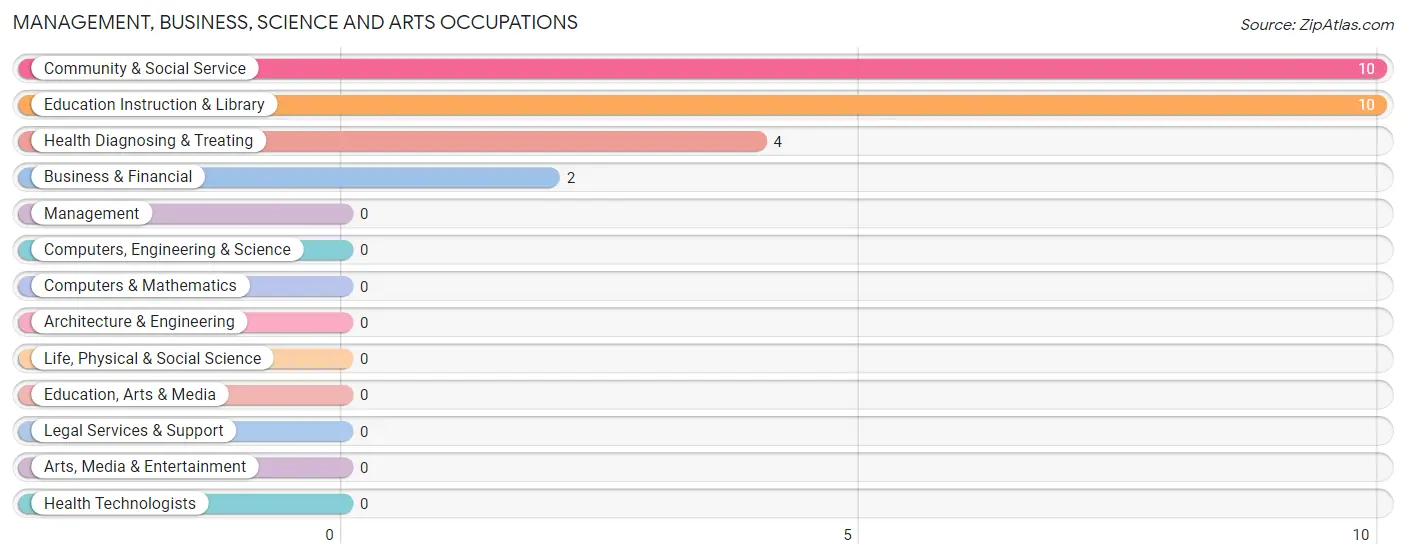
Management, Business, Science and Arts Occupations by Sex
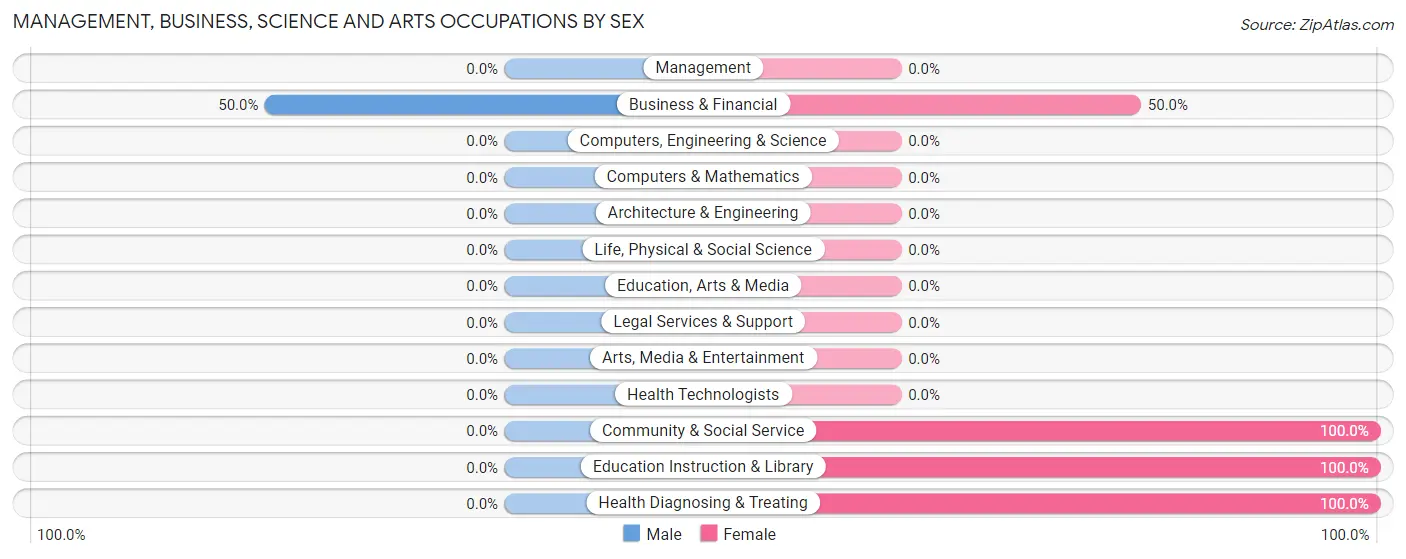
| Occupation | Male | Female |
| Management | 0 (0.0%) | 0 (0.0%) |
| Business & Financial | 1 (50.0%) | 1 (50.0%) |
| Computers, Engineering & Science | 0 (0.0%) | 0 (0.0%) |
| Computers & Mathematics | 0 (0.0%) | 0 (0.0%) |
| Architecture & Engineering | 0 (0.0%) | 0 (0.0%) |
| Life, Physical & Social Science | 0 (0.0%) | 0 (0.0%) |
| Community & Social Service | 0 (0.0%) | 10 (100.0%) |
| Education, Arts & Media | 0 (0.0%) | 0 (0.0%) |
| Legal Services & Support | 0 (0.0%) | 0 (0.0%) |
| Education Instruction & Library | 0 (0.0%) | 10 (100.0%) |
| Arts, Media & Entertainment | 0 (0.0%) | 0 (0.0%) |
| Health Diagnosing & Treating | 0 (0.0%) | 4 (100.0%) |
| Health Technologists | 0 (0.0%) | 0 (0.0%) |
| Total (Category) | 1 (6.2%) | 15 (93.8%) |
| Total (Overall) | 58 (65.9%) | 30 (34.1%) |
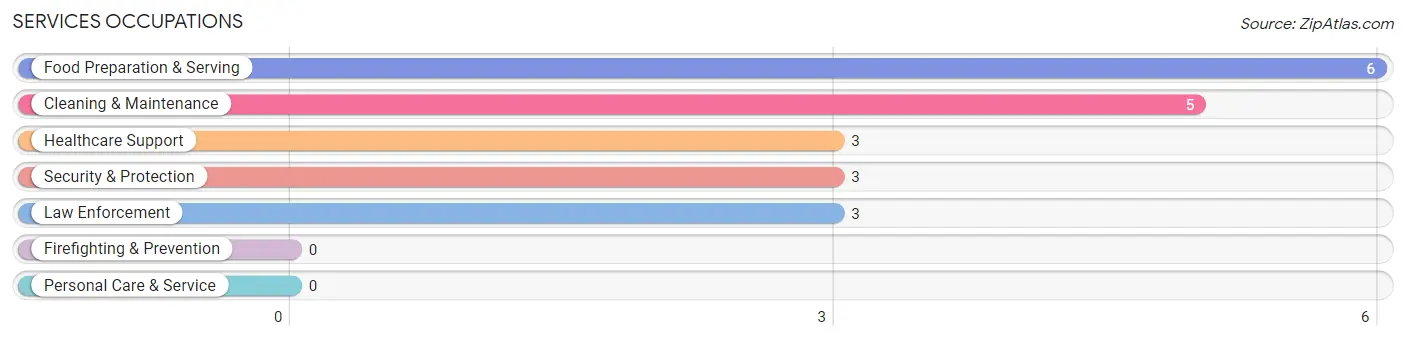
Services Occupations
The most common Services occupations in Pollard are Food Preparation & Serving (6 | 6.8%), Cleaning & Maintenance (5 | 5.7%), Healthcare Support (3 | 3.4%), Security & Protection (3 | 3.4%), and Law Enforcement (3 | 3.4%).
Services Occupations by Sex
Within the Services occupations in Pollard, the most male-oriented occupations are Security & Protection (100.0%), Law Enforcement (100.0%), and Cleaning & Maintenance (100.0%), while the most female-oriented occupations are Healthcare Support (100.0%), and Food Preparation & Serving (83.3%).
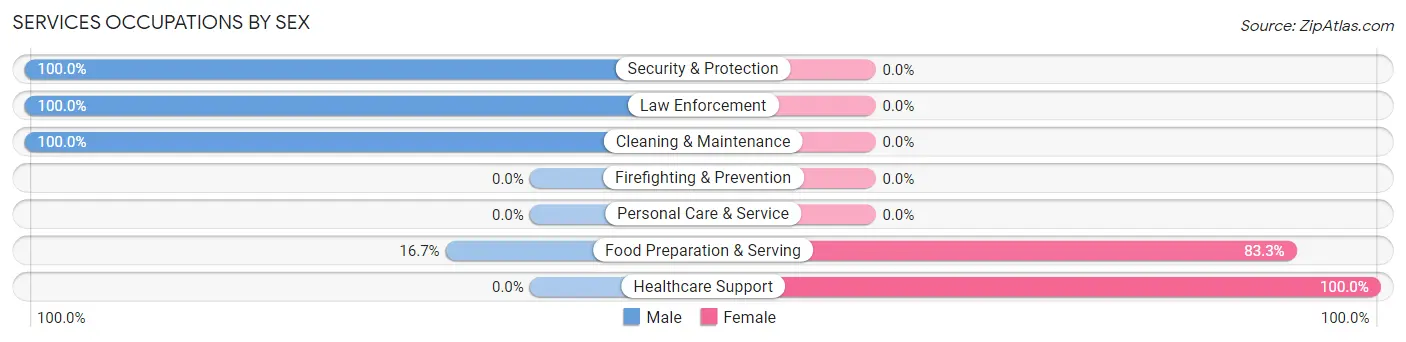
| Occupation | Male | Female |
| Healthcare Support | 0 (0.0%) | 3 (100.0%) |
| Security & Protection | 3 (100.0%) | 0 (0.0%) |
| Firefighting & Prevention | 0 (0.0%) | 0 (0.0%) |
| Law Enforcement | 3 (100.0%) | 0 (0.0%) |
| Food Preparation & Serving | 1 (16.7%) | 5 (83.3%) |
| Cleaning & Maintenance | 5 (100.0%) | 0 (0.0%) |
| Personal Care & Service | 0 (0.0%) | 0 (0.0%) |
| Total (Category) | 9 (52.9%) | 8 (47.1%) |
| Total (Overall) | 58 (65.9%) | 30 (34.1%) |
Sales and Office Occupations
The most common Sales and Office occupations in Pollard are Office & Administration (9 | 10.2%), and Sales & Related (7 | 8.0%).
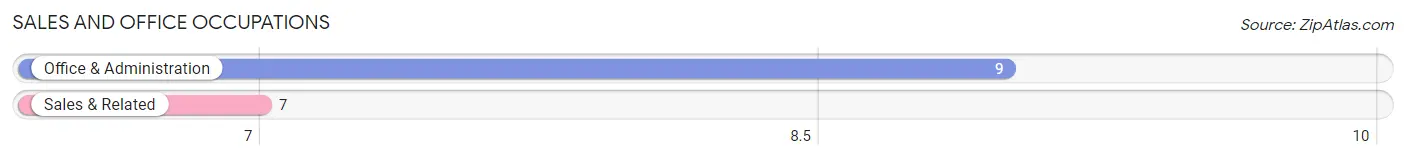
Sales and Office Occupations by Sex
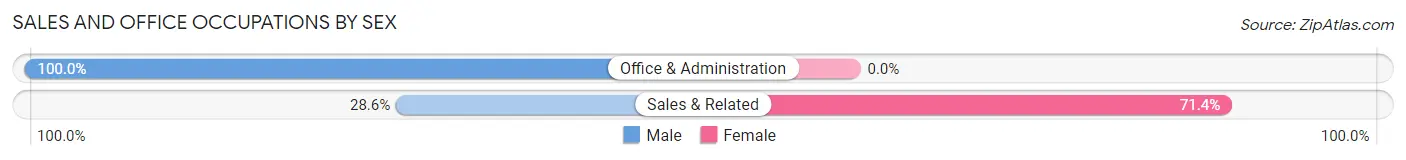
| Occupation | Male | Female |
| Sales & Related | 2 (28.6%) | 5 (71.4%) |
| Office & Administration | 9 (100.0%) | 0 (0.0%) |
| Total (Category) | 11 (68.8%) | 5 (31.2%) |
| Total (Overall) | 58 (65.9%) | 30 (34.1%) |
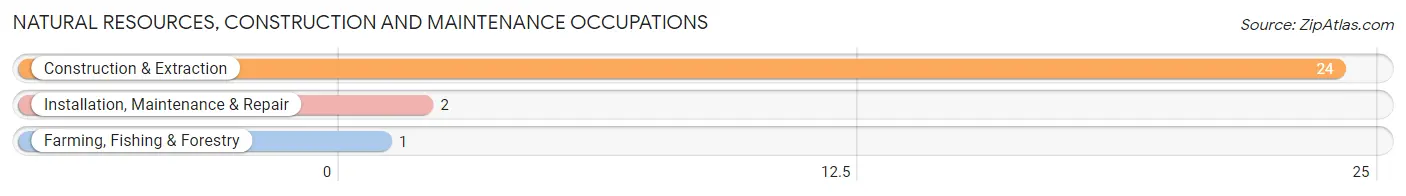
Natural Resources, Construction and Maintenance Occupations
The most common Natural Resources, Construction and Maintenance occupations in Pollard are Construction & Extraction (24 | 27.3%), Installation, Maintenance & Repair (2 | 2.3%), and Farming, Fishing & Forestry (1 | 1.1%).
Natural Resources, Construction and Maintenance Occupations by Sex
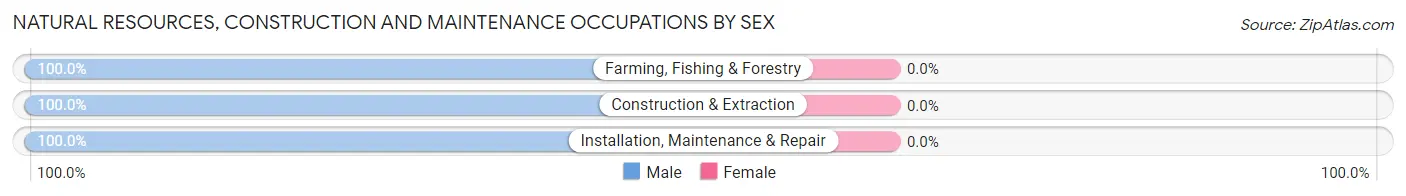
| Occupation | Male | Female |
| Farming, Fishing & Forestry | 1 (100.0%) | 0 (0.0%) |
| Construction & Extraction | 24 (100.0%) | 0 (0.0%) |
| Installation, Maintenance & Repair | 2 (100.0%) | 0 (0.0%) |
| Total (Category) | 27 (100.0%) | 0 (0.0%) |
| Total (Overall) | 58 (65.9%) | 30 (34.1%) |
Production, Transportation and Moving Occupations
The most common Production, Transportation and Moving occupations in Pollard are Production (7 | 8.0%), and Transportation (5 | 5.7%).
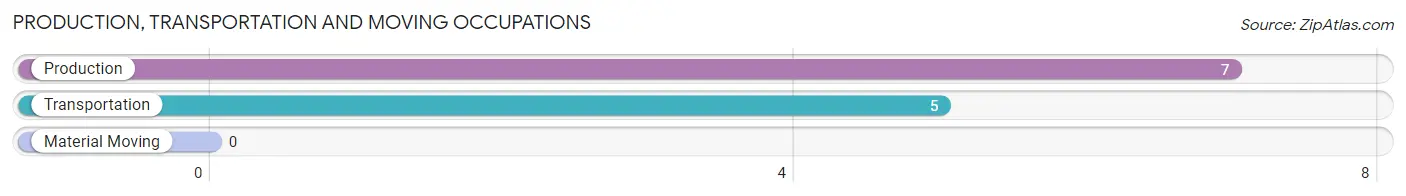
Production, Transportation and Moving Occupations by Sex
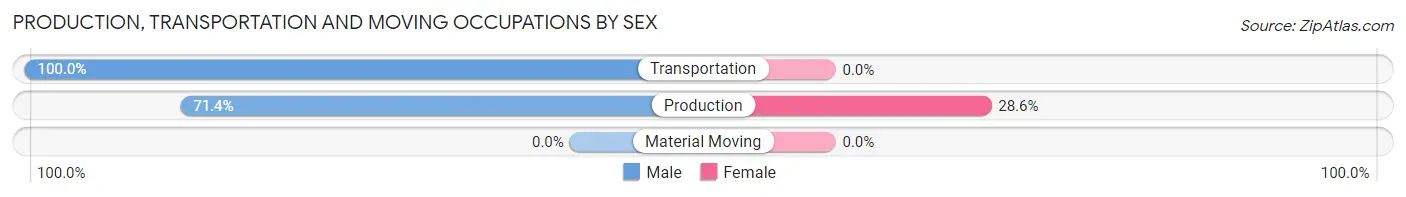
| Occupation | Male | Female |
| Production | 5 (71.4%) | 2 (28.6%) |
| Transportation | 5 (100.0%) | 0 (0.0%) |
| Material Moving | 0 (0.0%) | 0 (0.0%) |
| Total (Category) | 10 (83.3%) | 2 (16.7%) |
| Total (Overall) | 58 (65.9%) | 30 (34.1%) |
Employment Industries by Sex in Pollard
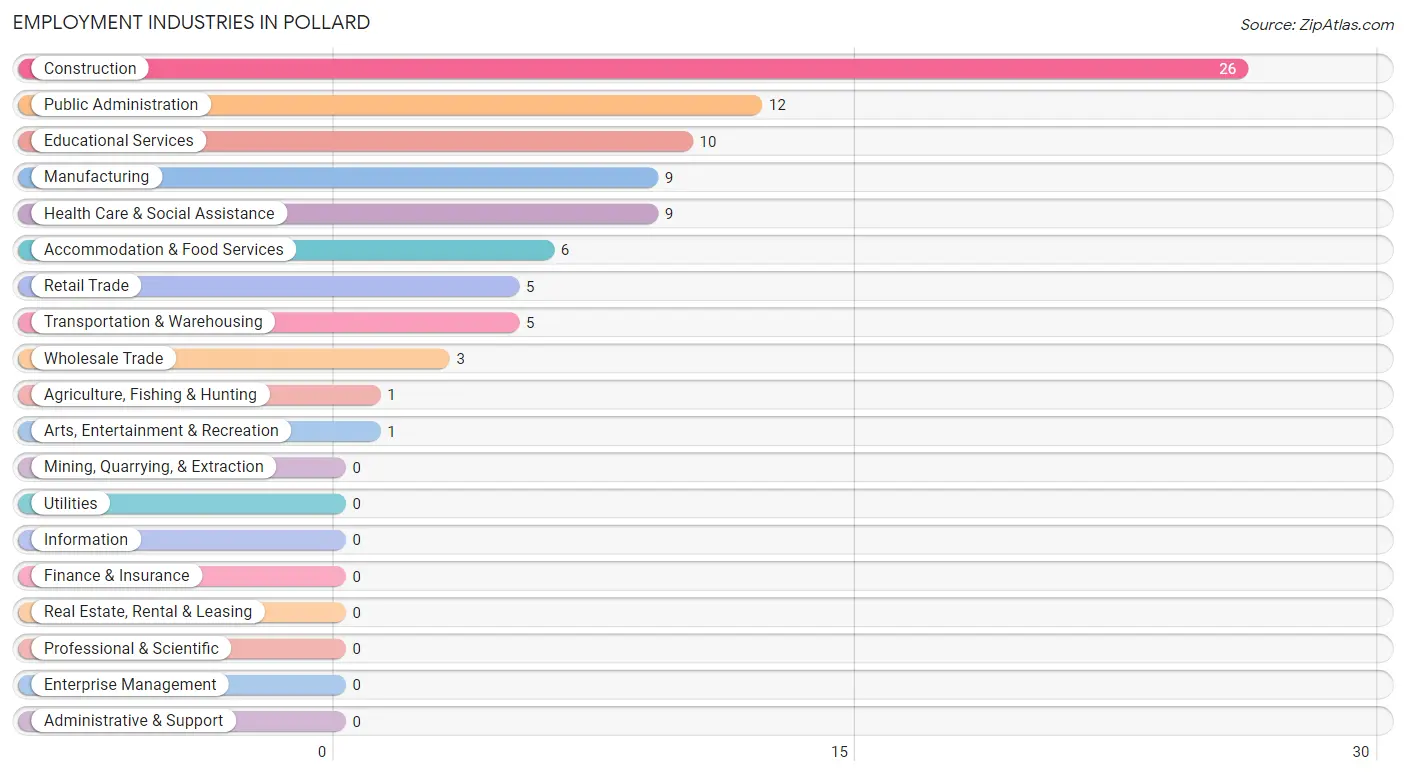
Employment Industries in Pollard
The major employment industries in Pollard include Construction (26 | 29.5%), Public Administration (12 | 13.6%), Educational Services (10 | 11.4%), Manufacturing (9 | 10.2%), and Health Care & Social Assistance (9 | 10.2%).
Employment Industries by Sex in Pollard
The Pollard industries that see more men than women are Agriculture, Fishing & Hunting (100.0%), Construction (100.0%), and Wholesale Trade (100.0%), whereas the industries that tend to have a higher number of women are Retail Trade (100.0%), Educational Services (100.0%), and Arts, Entertainment & Recreation (100.0%).
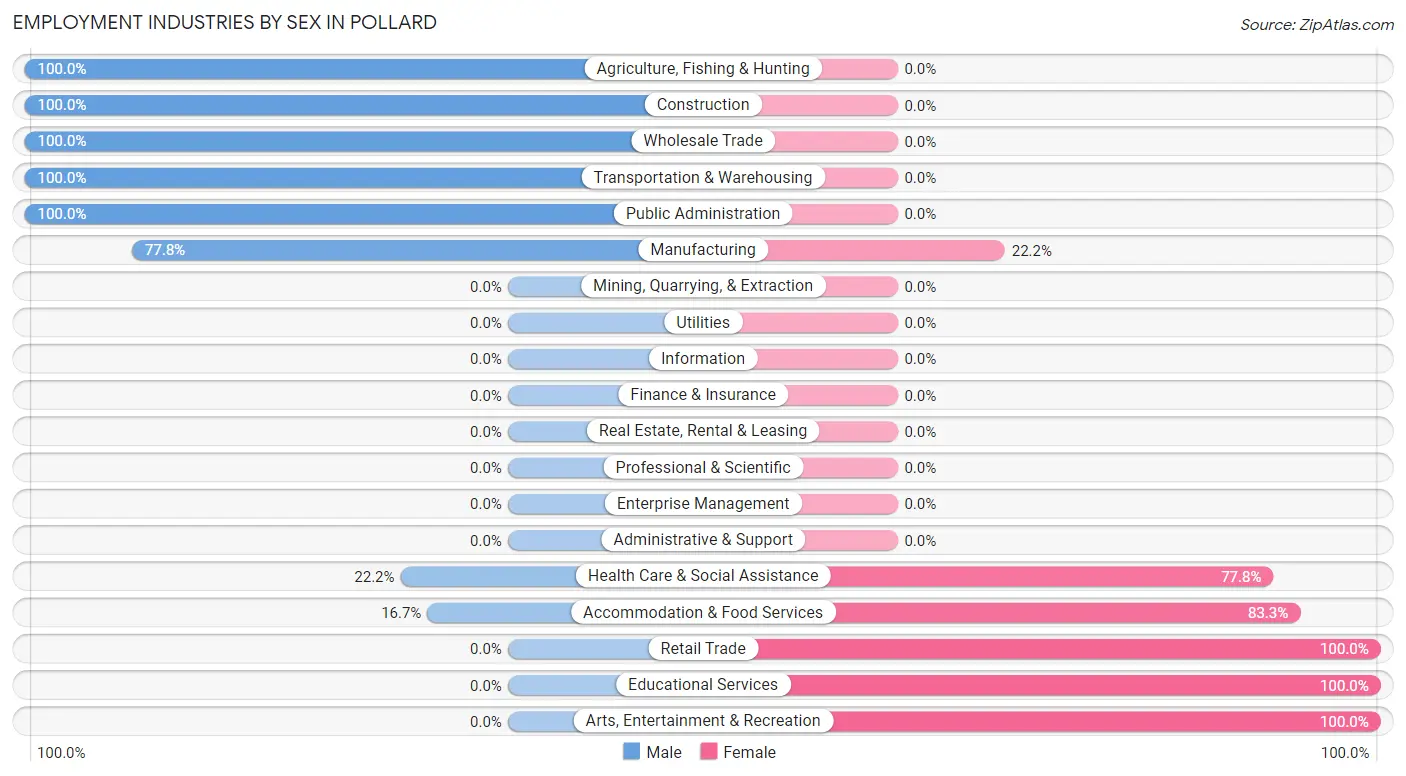
| Industry | Male | Female |
| Agriculture, Fishing & Hunting | 1 (100.0%) | 0 (0.0%) |
| Mining, Quarrying, & Extraction | 0 (0.0%) | 0 (0.0%) |
| Construction | 26 (100.0%) | 0 (0.0%) |
| Manufacturing | 7 (77.8%) | 2 (22.2%) |
| Wholesale Trade | 3 (100.0%) | 0 (0.0%) |
| Retail Trade | 0 (0.0%) | 5 (100.0%) |
| Transportation & Warehousing | 5 (100.0%) | 0 (0.0%) |
| Utilities | 0 (0.0%) | 0 (0.0%) |
| Information | 0 (0.0%) | 0 (0.0%) |
| Finance & Insurance | 0 (0.0%) | 0 (0.0%) |
| Real Estate, Rental & Leasing | 0 (0.0%) | 0 (0.0%) |
| Professional & Scientific | 0 (0.0%) | 0 (0.0%) |
| Enterprise Management | 0 (0.0%) | 0 (0.0%) |
| Administrative & Support | 0 (0.0%) | 0 (0.0%) |
| Educational Services | 0 (0.0%) | 10 (100.0%) |
| Health Care & Social Assistance | 2 (22.2%) | 7 (77.8%) |
| Arts, Entertainment & Recreation | 0 (0.0%) | 1 (100.0%) |
| Accommodation & Food Services | 1 (16.7%) | 5 (83.3%) |
| Public Administration | 12 (100.0%) | 0 (0.0%) |
| Total | 58 (65.9%) | 30 (34.1%) |
Education in Pollard
School Enrollment in Pollard
The most common levels of schooling among the 32 students in Pollard are high school (17 | 53.1%), middle school (12 | 37.5%), and college / undergraduate (2 | 6.2%).
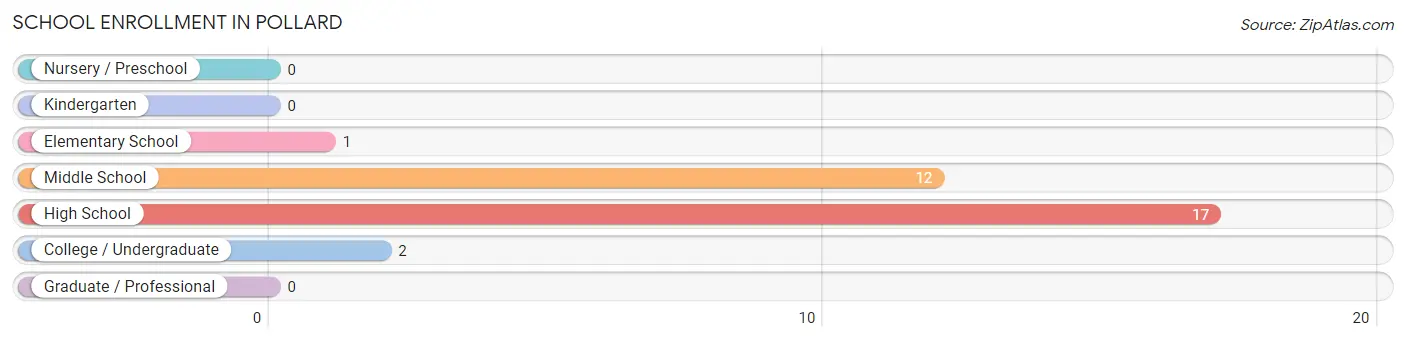
| School Level | # Students | % Students |
| Nursery / Preschool | 0 | 0.0% |
| Kindergarten | 0 | 0.0% |
| Elementary School | 1 | 3.1% |
| Middle School | 12 | 37.5% |
| High School | 17 | 53.1% |
| College / Undergraduate | 2 | 6.2% |
| Graduate / Professional | 0 | 0.0% |
| Total | 32 | 100.0% |
School Enrollment by Age by Funding Source in Pollard
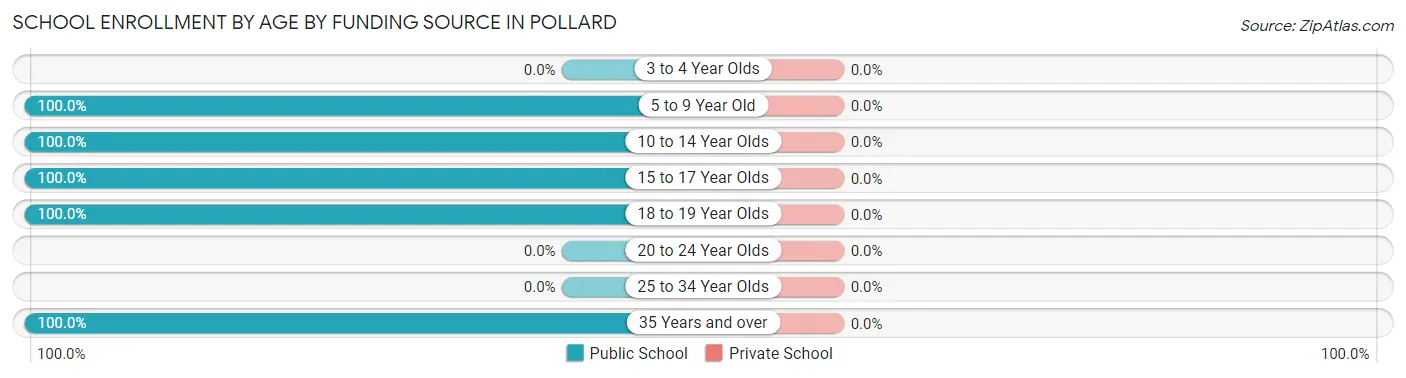
| Age Bracket | Public School | Private School |
| 3 to 4 Year Olds | 0 (0.0%) | 0 (0.0%) |
| 5 to 9 Year Old | 1 (100.0%) | 0 (0.0%) |
| 10 to 14 Year Olds | 14 (100.0%) | 0 (0.0%) |
| 15 to 17 Year Olds | 11 (100.0%) | 0 (0.0%) |
| 18 to 19 Year Olds | 4 (100.0%) | 0 (0.0%) |
| 20 to 24 Year Olds | 0 (0.0%) | 0 (0.0%) |
| 25 to 34 Year Olds | 0 (0.0%) | 0 (0.0%) |
| 35 Years and over | 2 (100.0%) | 0 (0.0%) |
| Total | 32 (100.0%) | 0 (0.0%) |
Educational Attainment by Field of Study in Pollard
Computers & mathematics (6 | 37.5%), science & technology (3 | 18.8%), bio, nature & agricultural (2 | 12.5%), communications (2 | 12.5%), and psychology (1 | 6.2%) are the most common fields of study among 16 individuals in Pollard who have obtained a bachelor's degree or higher.
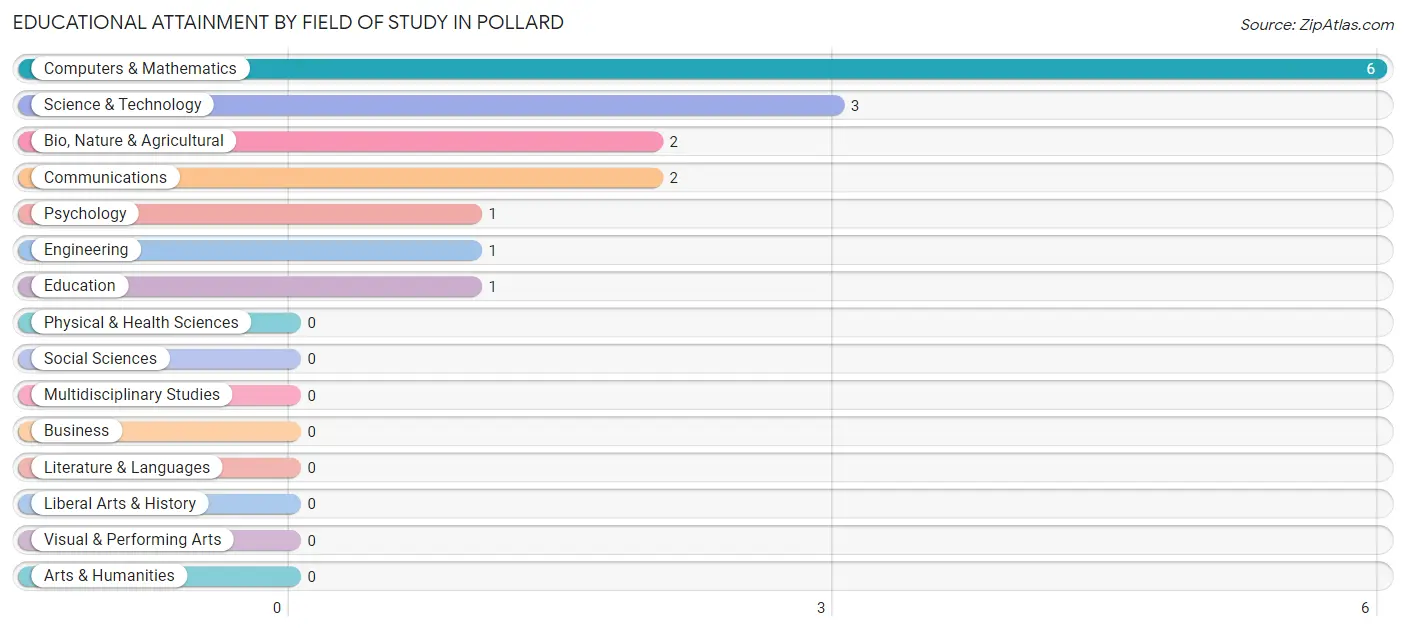
| Field of Study | # Graduates | % Graduates |
| Computers & Mathematics | 6 | 37.5% |
| Bio, Nature & Agricultural | 2 | 12.5% |
| Physical & Health Sciences | 0 | 0.0% |
| Psychology | 1 | 6.2% |
| Social Sciences | 0 | 0.0% |
| Engineering | 1 | 6.2% |
| Multidisciplinary Studies | 0 | 0.0% |
| Science & Technology | 3 | 18.8% |
| Business | 0 | 0.0% |
| Education | 1 | 6.2% |
| Literature & Languages | 0 | 0.0% |
| Liberal Arts & History | 0 | 0.0% |
| Visual & Performing Arts | 0 | 0.0% |
| Communications | 2 | 12.5% |
| Arts & Humanities | 0 | 0.0% |
| Total | 16 | 100.0% |
Transportation & Commute in Pollard
Vehicle Availability by Sex in Pollard
The most prevalent vehicle ownership categories in Pollard are males with 2 vehicles (29, accounting for 50.0%) and females with 2 vehicles (13, making up 96.7%).
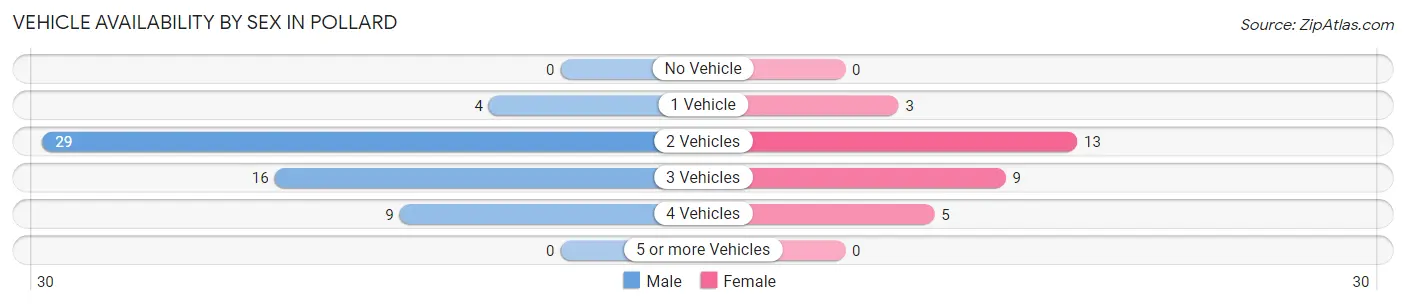
| Vehicles Available | Male | Female |
| No Vehicle | 0 (0.0%) | 0 (0.0%) |
| 1 Vehicle | 4 (6.9%) | 3 (10.0%) |
| 2 Vehicles | 29 (50.0%) | 13 (43.3%) |
| 3 Vehicles | 16 (27.6%) | 9 (30.0%) |
| 4 Vehicles | 9 (15.5%) | 5 (16.7%) |
| 5 or more Vehicles | 0 (0.0%) | 0 (0.0%) |
| Total | 58 (100.0%) | 30 (100.0%) |
Commute Time in Pollard
The most frequently occuring commute durations in Pollard are 30 to 34 minutes (24 commuters, 27.3%), 60 to 89 minutes (16 commuters, 18.2%), and 10 to 14 minutes (12 commuters, 13.6%).
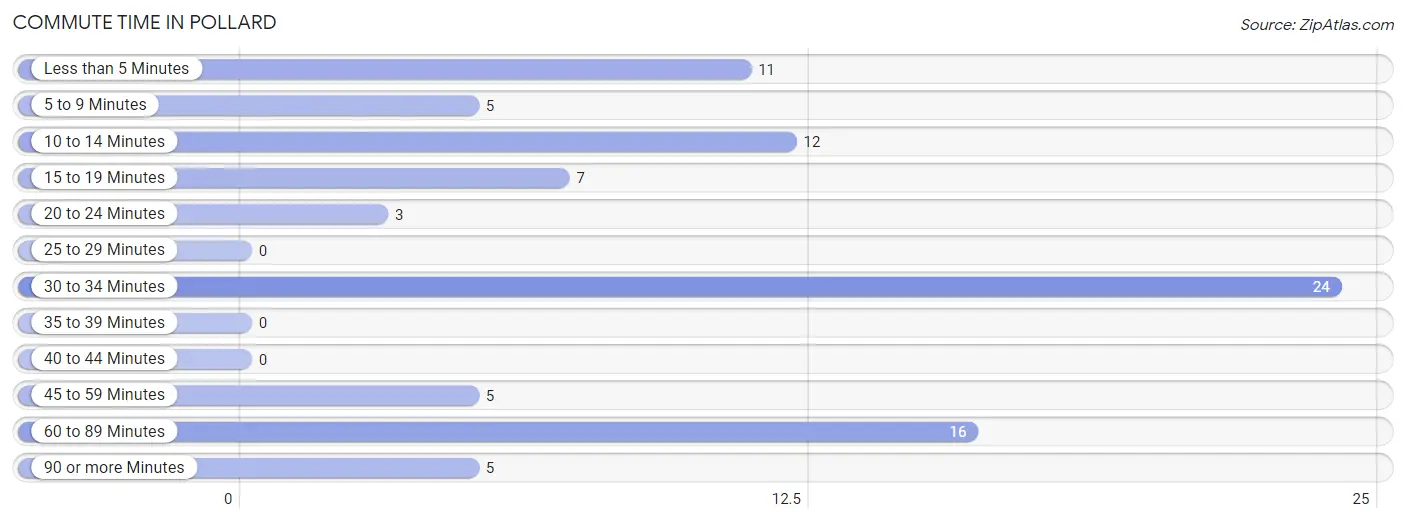
| Commute Time | # Commuters | % Commuters |
| Less than 5 Minutes | 11 | 12.5% |
| 5 to 9 Minutes | 5 | 5.7% |
| 10 to 14 Minutes | 12 | 13.6% |
| 15 to 19 Minutes | 7 | 8.0% |
| 20 to 24 Minutes | 3 | 3.4% |
| 25 to 29 Minutes | 0 | 0.0% |
| 30 to 34 Minutes | 24 | 27.3% |
| 35 to 39 Minutes | 0 | 0.0% |
| 40 to 44 Minutes | 0 | 0.0% |
| 45 to 59 Minutes | 5 | 5.7% |
| 60 to 89 Minutes | 16 | 18.2% |
| 90 or more Minutes | 5 | 5.7% |
Commute Time by Sex in Pollard
The most common commute times in Pollard are 60 to 89 minutes (16 commuters, 27.6%) for males and 30 to 34 minutes (10 commuters, 33.3%) for females.
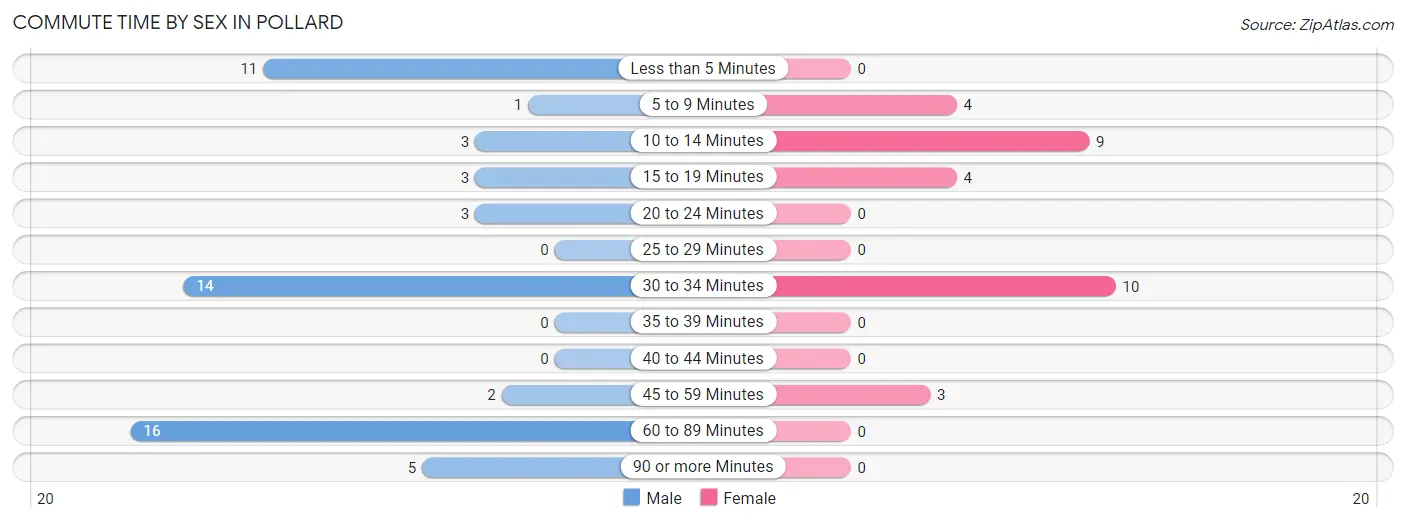
| Commute Time | Male | Female |
| Less than 5 Minutes | 11 (19.0%) | 0 (0.0%) |
| 5 to 9 Minutes | 1 (1.7%) | 4 (13.3%) |
| 10 to 14 Minutes | 3 (5.2%) | 9 (30.0%) |
| 15 to 19 Minutes | 3 (5.2%) | 4 (13.3%) |
| 20 to 24 Minutes | 3 (5.2%) | 0 (0.0%) |
| 25 to 29 Minutes | 0 (0.0%) | 0 (0.0%) |
| 30 to 34 Minutes | 14 (24.1%) | 10 (33.3%) |
| 35 to 39 Minutes | 0 (0.0%) | 0 (0.0%) |
| 40 to 44 Minutes | 0 (0.0%) | 0 (0.0%) |
| 45 to 59 Minutes | 2 (3.5%) | 3 (10.0%) |
| 60 to 89 Minutes | 16 (27.6%) | 0 (0.0%) |
| 90 or more Minutes | 5 (8.6%) | 0 (0.0%) |
Time of Departure to Work by Sex in Pollard
The most frequent times of departure to work in Pollard are 5:30 AM to 5:59 AM (20, 34.5%) for males and 9:00 AM to 9:59 AM (8, 26.7%) for females.
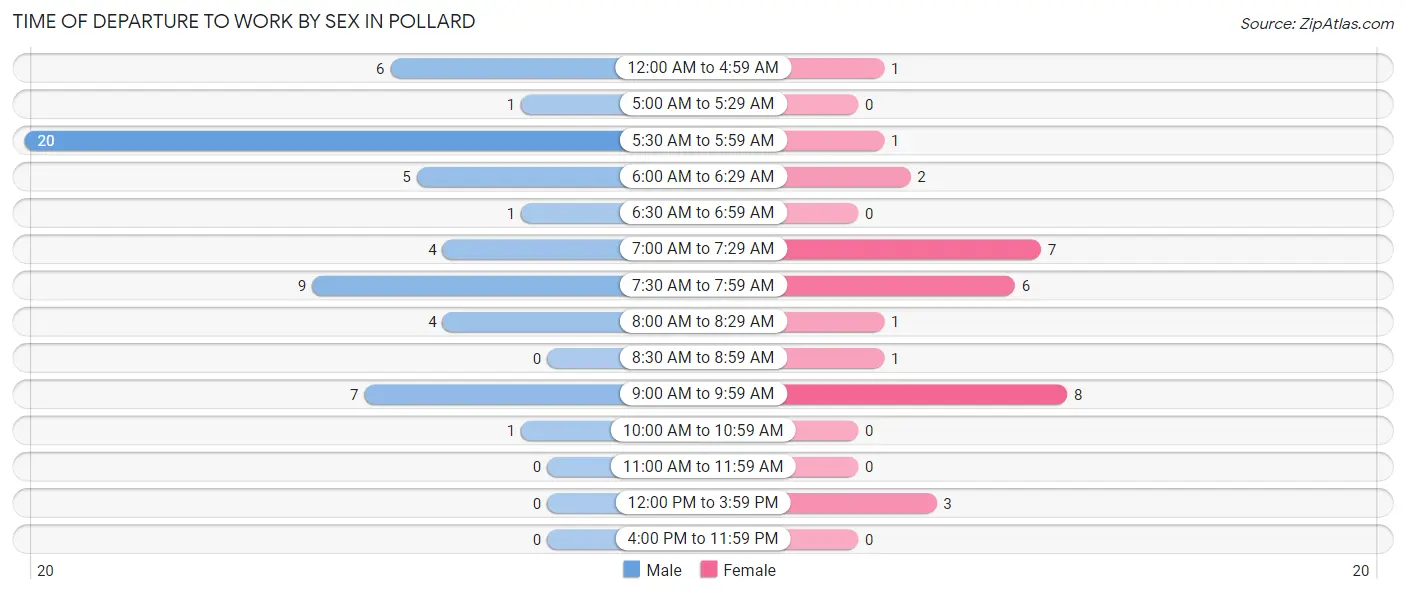
| Time of Departure | Male | Female |
| 12:00 AM to 4:59 AM | 6 (10.3%) | 1 (3.3%) |
| 5:00 AM to 5:29 AM | 1 (1.7%) | 0 (0.0%) |
| 5:30 AM to 5:59 AM | 20 (34.5%) | 1 (3.3%) |
| 6:00 AM to 6:29 AM | 5 (8.6%) | 2 (6.7%) |
| 6:30 AM to 6:59 AM | 1 (1.7%) | 0 (0.0%) |
| 7:00 AM to 7:29 AM | 4 (6.9%) | 7 (23.3%) |
| 7:30 AM to 7:59 AM | 9 (15.5%) | 6 (20.0%) |
| 8:00 AM to 8:29 AM | 4 (6.9%) | 1 (3.3%) |
| 8:30 AM to 8:59 AM | 0 (0.0%) | 1 (3.3%) |
| 9:00 AM to 9:59 AM | 7 (12.1%) | 8 (26.7%) |
| 10:00 AM to 10:59 AM | 1 (1.7%) | 0 (0.0%) |
| 11:00 AM to 11:59 AM | 0 (0.0%) | 0 (0.0%) |
| 12:00 PM to 3:59 PM | 0 (0.0%) | 3 (10.0%) |
| 4:00 PM to 11:59 PM | 0 (0.0%) | 0 (0.0%) |
| Total | 58 (100.0%) | 30 (100.0%) |
Housing Occupancy in Pollard
Occupancy by Ownership in Pollard
Of the total 89 dwellings in Pollard, owner-occupied units account for 73 (82.0%), while renter-occupied units make up 16 (18.0%).
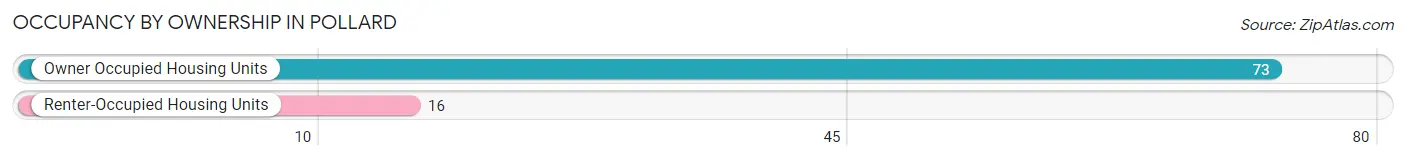
| Occupancy | # Housing Units | % Housing Units |
| Owner Occupied Housing Units | 73 | 82.0% |
| Renter-Occupied Housing Units | 16 | 18.0% |
| Total Occupied Housing Units | 89 | 100.0% |
Occupancy by Household Size in Pollard
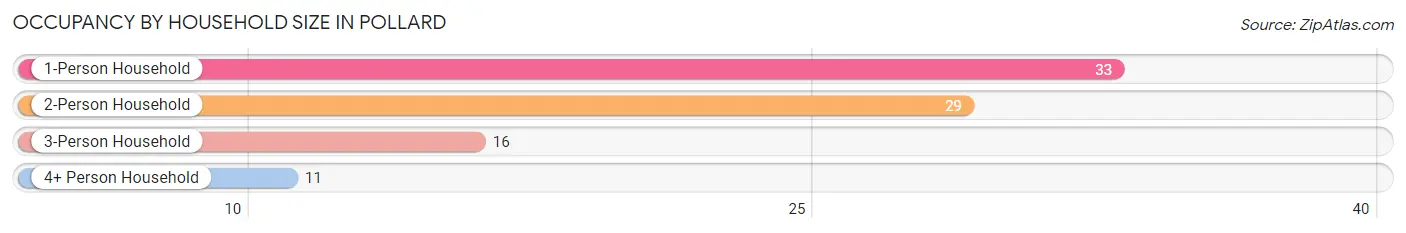
| Household Size | # Housing Units | % Housing Units |
| 1-Person Household | 33 | 37.1% |
| 2-Person Household | 29 | 32.6% |
| 3-Person Household | 16 | 18.0% |
| 4+ Person Household | 11 | 12.4% |
| Total Housing Units | 89 | 100.0% |
Occupancy by Ownership by Household Size in Pollard
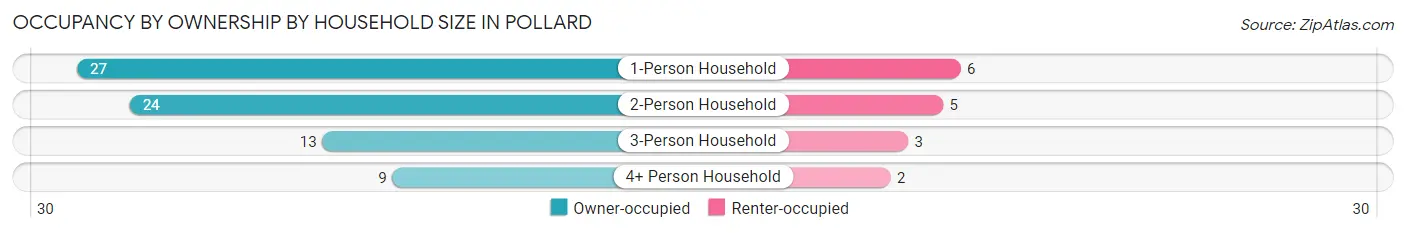
| Household Size | Owner-occupied | Renter-occupied |
| 1-Person Household | 27 (81.8%) | 6 (18.2%) |
| 2-Person Household | 24 (82.8%) | 5 (17.2%) |
| 3-Person Household | 13 (81.2%) | 3 (18.8%) |
| 4+ Person Household | 9 (81.8%) | 2 (18.2%) |
| Total Housing Units | 73 (82.0%) | 16 (18.0%) |
Occupancy by Educational Attainment in Pollard
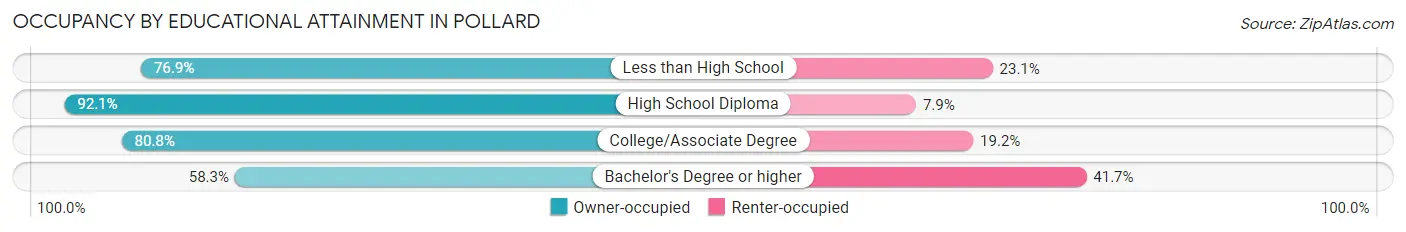
| Household Size | Owner-occupied | Renter-occupied |
| Less than High School | 10 (76.9%) | 3 (23.1%) |
| High School Diploma | 35 (92.1%) | 3 (7.9%) |
| College/Associate Degree | 21 (80.8%) | 5 (19.2%) |
| Bachelor's Degree or higher | 7 (58.3%) | 5 (41.7%) |
Occupancy by Age of Householder in Pollard
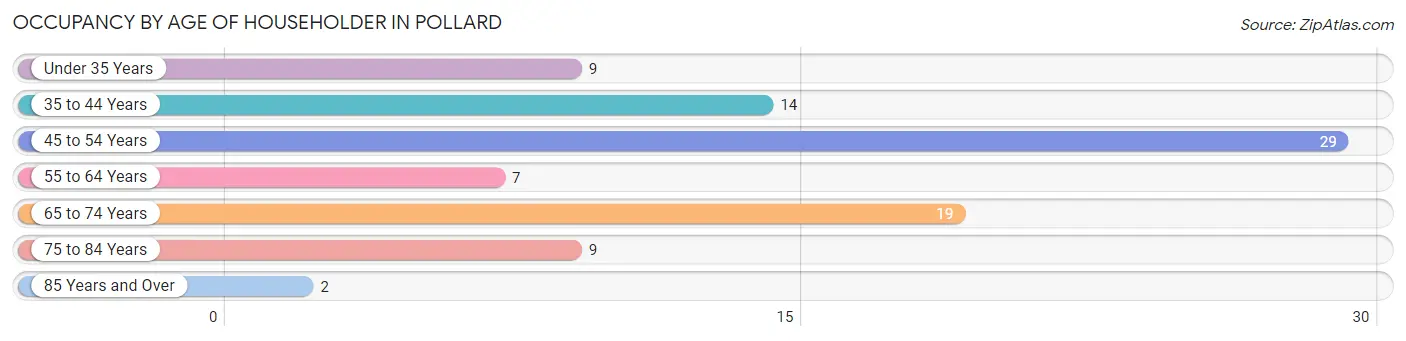
| Age Bracket | # Households | % Households |
| Under 35 Years | 9 | 10.1% |
| 35 to 44 Years | 14 | 15.7% |
| 45 to 54 Years | 29 | 32.6% |
| 55 to 64 Years | 7 | 7.9% |
| 65 to 74 Years | 19 | 21.3% |
| 75 to 84 Years | 9 | 10.1% |
| 85 Years and Over | 2 | 2.2% |
| Total | 89 | 100.0% |
Housing Finances in Pollard
Median Income by Occupancy in Pollard
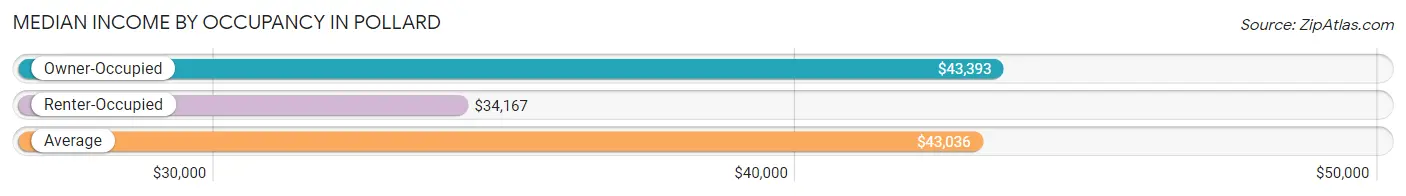
| Occupancy Type | # Households | Median Income |
| Owner-Occupied | 73 (82.0%) | $43,393 |
| Renter-Occupied | 16 (18.0%) | $34,167 |
| Average | 89 (100.0%) | $43,036 |
Occupancy by Householder Income Bracket in Pollard
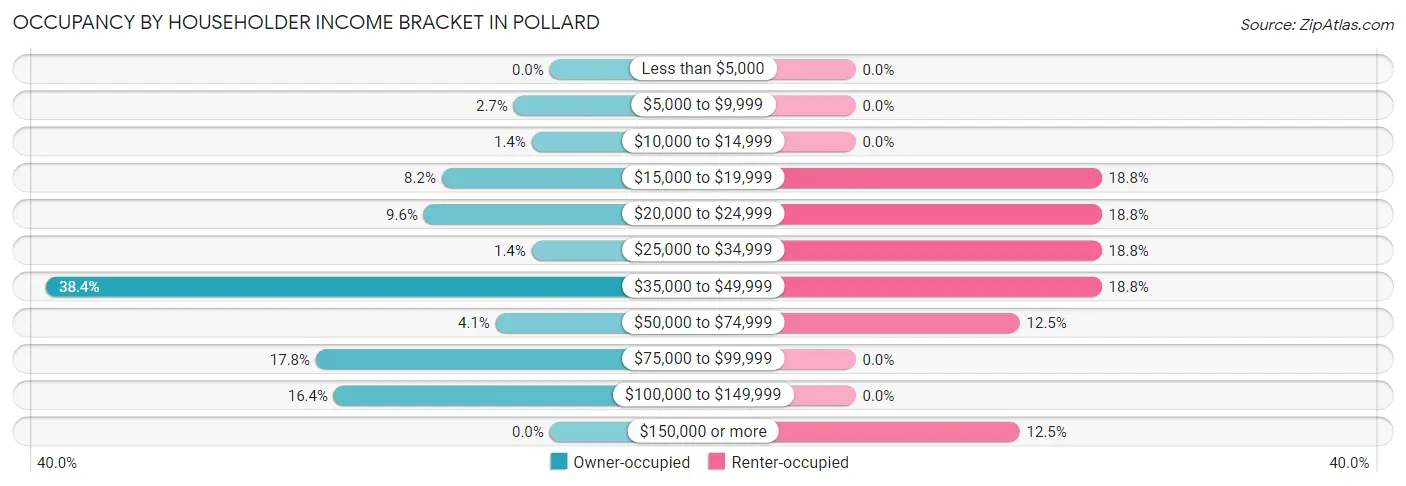
| Income Bracket | Owner-occupied | Renter-occupied |
| Less than $5,000 | 0 (0.0%) | 0 (0.0%) |
| $5,000 to $9,999 | 2 (2.7%) | 0 (0.0%) |
| $10,000 to $14,999 | 1 (1.4%) | 0 (0.0%) |
| $15,000 to $19,999 | 6 (8.2%) | 3 (18.8%) |
| $20,000 to $24,999 | 7 (9.6%) | 3 (18.8%) |
| $25,000 to $34,999 | 1 (1.4%) | 3 (18.8%) |
| $35,000 to $49,999 | 28 (38.4%) | 3 (18.8%) |
| $50,000 to $74,999 | 3 (4.1%) | 2 (12.5%) |
| $75,000 to $99,999 | 13 (17.8%) | 0 (0.0%) |
| $100,000 to $149,999 | 12 (16.4%) | 0 (0.0%) |
| $150,000 or more | 0 (0.0%) | 2 (12.5%) |
| Total | 73 (100.0%) | 16 (100.0%) |
Monthly Housing Cost Tiers in Pollard
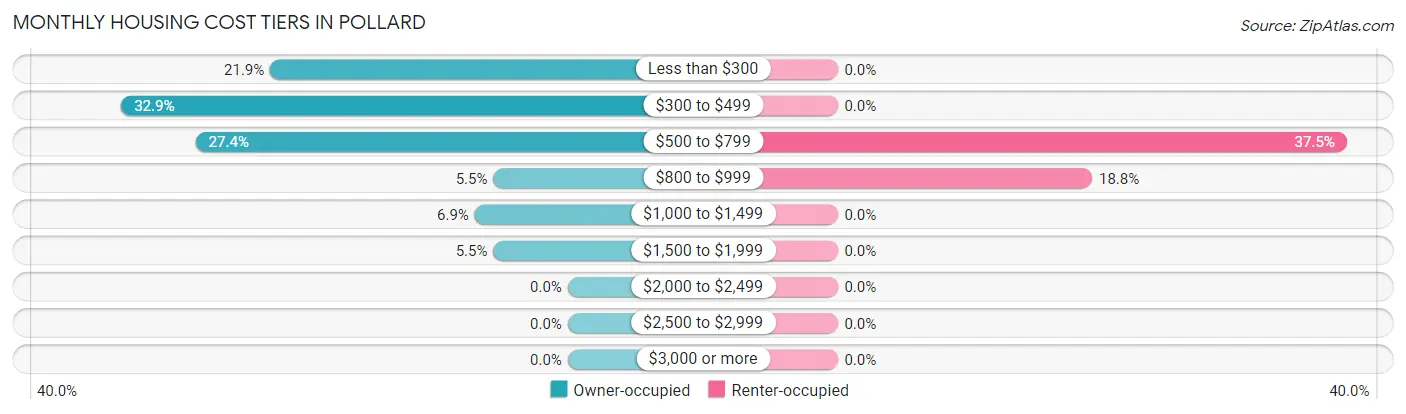
| Monthly Cost | Owner-occupied | Renter-occupied |
| Less than $300 | 16 (21.9%) | 0 (0.0%) |
| $300 to $499 | 24 (32.9%) | 0 (0.0%) |
| $500 to $799 | 20 (27.4%) | 6 (37.5%) |
| $800 to $999 | 4 (5.5%) | 3 (18.8%) |
| $1,000 to $1,499 | 5 (6.9%) | 0 (0.0%) |
| $1,500 to $1,999 | 4 (5.5%) | 0 (0.0%) |
| $2,000 to $2,499 | 0 (0.0%) | 0 (0.0%) |
| $2,500 to $2,999 | 0 (0.0%) | 0 (0.0%) |
| $3,000 or more | 0 (0.0%) | 0 (0.0%) |
| Total | 73 (100.0%) | 16 (100.0%) |
Physical Housing Characteristics in Pollard
Housing Structures in Pollard
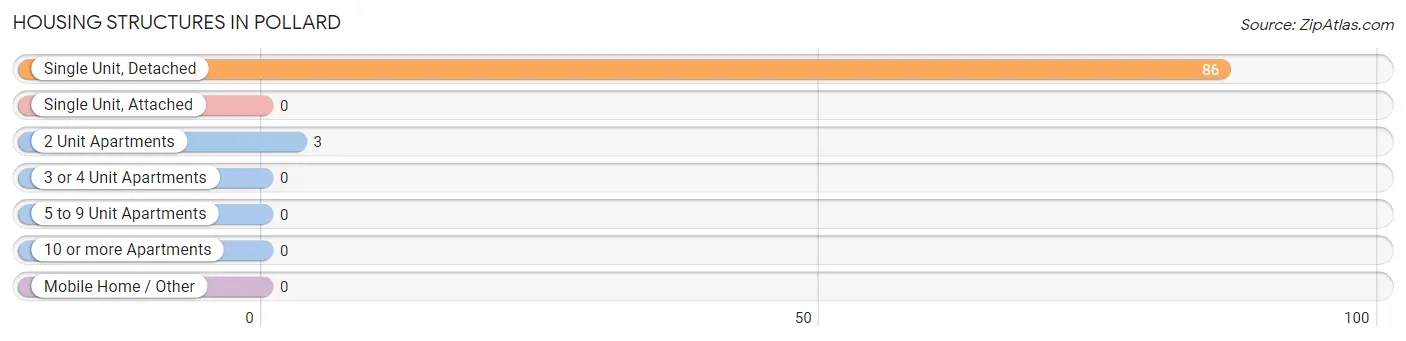
| Structure Type | # Housing Units | % Housing Units |
| Single Unit, Detached | 86 | 96.6% |
| Single Unit, Attached | 0 | 0.0% |
| 2 Unit Apartments | 3 | 3.4% |
| 3 or 4 Unit Apartments | 0 | 0.0% |
| 5 to 9 Unit Apartments | 0 | 0.0% |
| 10 or more Apartments | 0 | 0.0% |
| Mobile Home / Other | 0 | 0.0% |
| Total | 89 | 100.0% |
Housing Structures by Occupancy in Pollard
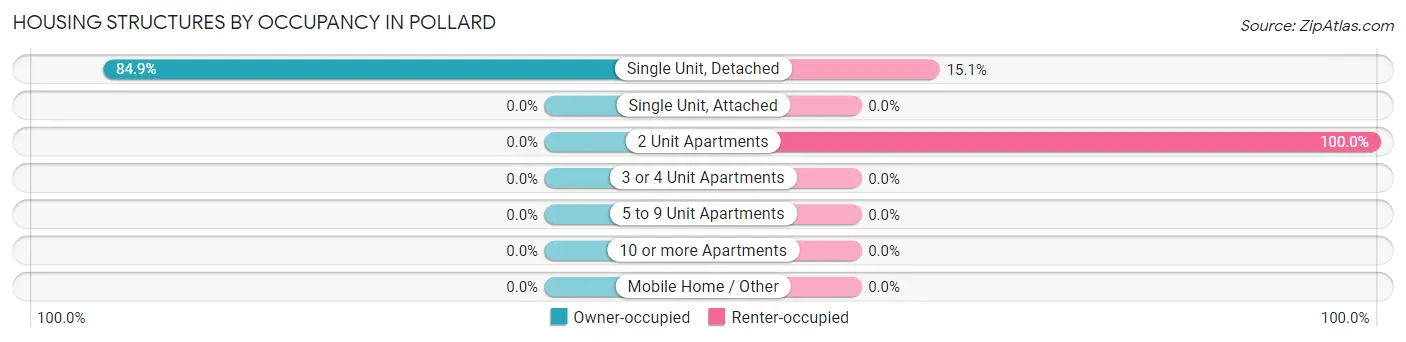
| Structure Type | Owner-occupied | Renter-occupied |
| Single Unit, Detached | 73 (84.9%) | 13 (15.1%) |
| Single Unit, Attached | 0 (0.0%) | 0 (0.0%) |
| 2 Unit Apartments | 0 (0.0%) | 3 (100.0%) |
| 3 or 4 Unit Apartments | 0 (0.0%) | 0 (0.0%) |
| 5 to 9 Unit Apartments | 0 (0.0%) | 0 (0.0%) |
| 10 or more Apartments | 0 (0.0%) | 0 (0.0%) |
| Mobile Home / Other | 0 (0.0%) | 0 (0.0%) |
| Total | 73 (82.0%) | 16 (18.0%) |
Housing Structures by Number of Rooms in Pollard
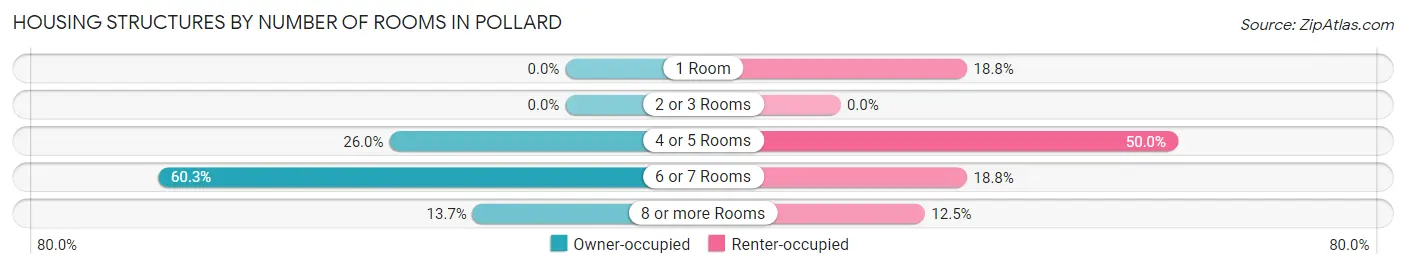
| Number of Rooms | Owner-occupied | Renter-occupied |
| 1 Room | 0 (0.0%) | 3 (18.8%) |
| 2 or 3 Rooms | 0 (0.0%) | 0 (0.0%) |
| 4 or 5 Rooms | 19 (26.0%) | 8 (50.0%) |
| 6 or 7 Rooms | 44 (60.3%) | 3 (18.8%) |
| 8 or more Rooms | 10 (13.7%) | 2 (12.5%) |
| Total | 73 (100.0%) | 16 (100.0%) |
Housing Structure by Heating Type in Pollard
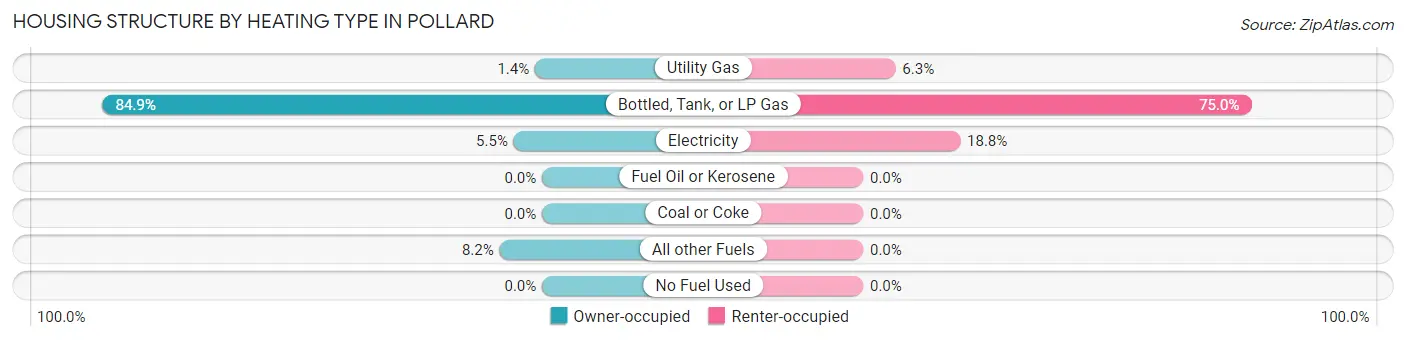
| Heating Type | Owner-occupied | Renter-occupied |
| Utility Gas | 1 (1.4%) | 1 (6.2%) |
| Bottled, Tank, or LP Gas | 62 (84.9%) | 12 (75.0%) |
| Electricity | 4 (5.5%) | 3 (18.8%) |
| Fuel Oil or Kerosene | 0 (0.0%) | 0 (0.0%) |
| Coal or Coke | 0 (0.0%) | 0 (0.0%) |
| All other Fuels | 6 (8.2%) | 0 (0.0%) |
| No Fuel Used | 0 (0.0%) | 0 (0.0%) |
| Total | 73 (100.0%) | 16 (100.0%) |
Household Vehicle Usage in Pollard
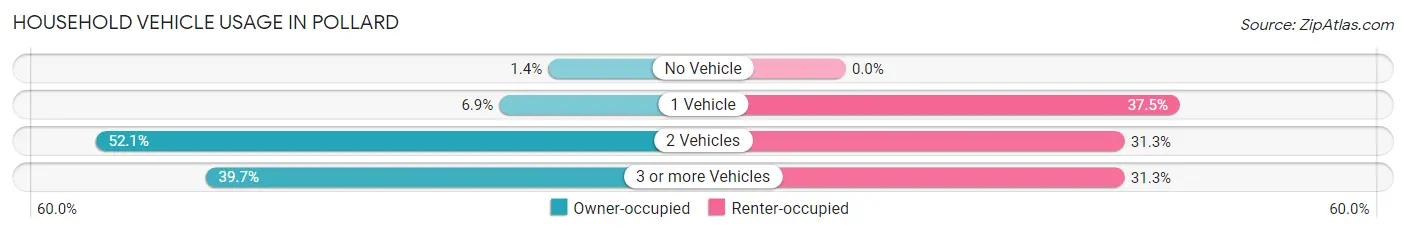
| Vehicles per Household | Owner-occupied | Renter-occupied |
| No Vehicle | 1 (1.4%) | 0 (0.0%) |
| 1 Vehicle | 5 (6.9%) | 6 (37.5%) |
| 2 Vehicles | 38 (52.0%) | 5 (31.2%) |
| 3 or more Vehicles | 29 (39.7%) | 5 (31.2%) |
| Total | 73 (100.0%) | 16 (100.0%) |
Real Estate & Mortgages in Pollard
Real Estate and Mortgage Overview in Pollard
| Characteristic | Without Mortgage | With Mortgage |
| Housing Units | 43 | 30 |
| Median Property Value | - | - |
| Median Household Income | $44,107 | $0 |
| Monthly Housing Costs | $396 | $0 |
| Real Estate Taxes | - | - |
Property Value by Mortgage Status in Pollard
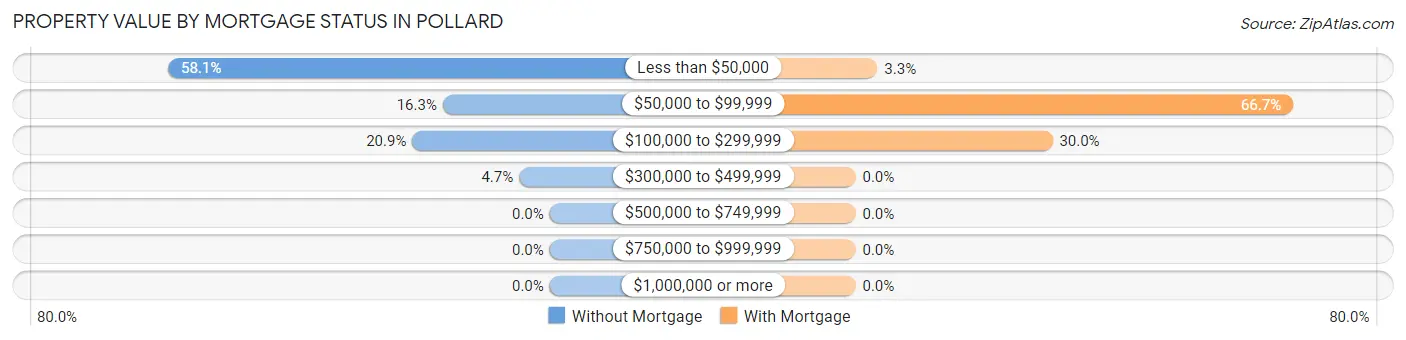
| Property Value | Without Mortgage | With Mortgage |
| Less than $50,000 | 25 (58.1%) | 1 (3.3%) |
| $50,000 to $99,999 | 7 (16.3%) | 20 (66.7%) |
| $100,000 to $299,999 | 9 (20.9%) | 9 (30.0%) |
| $300,000 to $499,999 | 2 (4.6%) | 0 (0.0%) |
| $500,000 to $749,999 | 0 (0.0%) | 0 (0.0%) |
| $750,000 to $999,999 | 0 (0.0%) | 0 (0.0%) |
| $1,000,000 or more | 0 (0.0%) | 0 (0.0%) |
| Total | 43 (100.0%) | 30 (100.0%) |
Household Income by Mortgage Status in Pollard
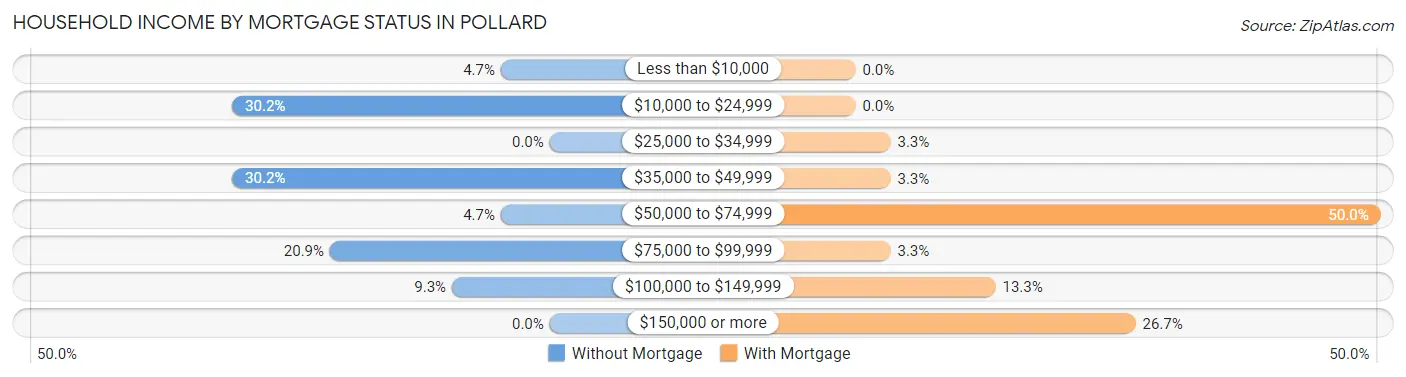
| Household Income | Without Mortgage | With Mortgage |
| Less than $10,000 | 2 (4.6%) | 0 (0.0%) |
| $10,000 to $24,999 | 13 (30.2%) | 0 (0.0%) |
| $25,000 to $34,999 | 0 (0.0%) | 1 (3.3%) |
| $35,000 to $49,999 | 13 (30.2%) | 1 (3.3%) |
| $50,000 to $74,999 | 2 (4.6%) | 15 (50.0%) |
| $75,000 to $99,999 | 9 (20.9%) | 1 (3.3%) |
| $100,000 to $149,999 | 4 (9.3%) | 4 (13.3%) |
| $150,000 or more | 0 (0.0%) | 8 (26.7%) |
| Total | 43 (100.0%) | 30 (100.0%) |
Property Value to Household Income Ratio in Pollard
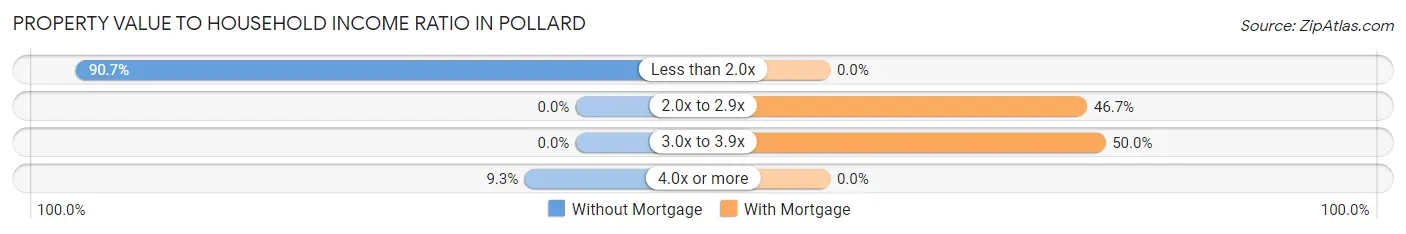
| Value-to-Income Ratio | Without Mortgage | With Mortgage |
| Less than 2.0x | 39 (90.7%) | 0 (0.0%) |
| 2.0x to 2.9x | 0 (0.0%) | 14 (46.7%) |
| 3.0x to 3.9x | 0 (0.0%) | 15 (50.0%) |
| 4.0x or more | 4 (9.3%) | 0 (0.0%) |
| Total | 43 (100.0%) | 30 (100.0%) |
Real Estate Taxes by Mortgage Status in Pollard
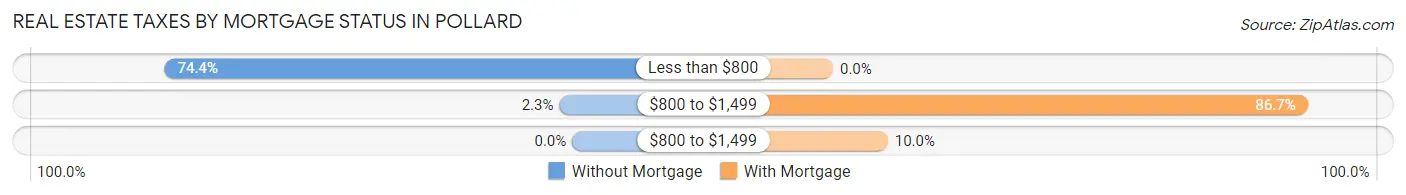
| Property Taxes | Without Mortgage | With Mortgage |
| Less than $800 | 32 (74.4%) | 0 (0.0%) |
| $800 to $1,499 | 1 (2.3%) | 26 (86.7%) |
| $800 to $1,499 | 0 (0.0%) | 3 (10.0%) |
| Total | 43 (100.0%) | 30 (100.0%) |
Health & Disability in Pollard
Health Insurance Coverage by Age in Pollard
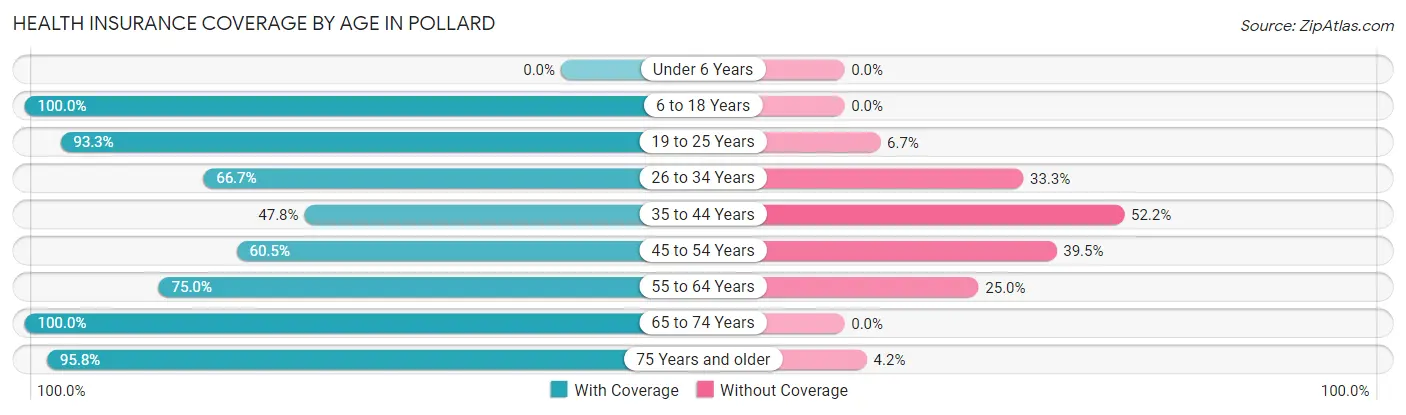
| Age Bracket | With Coverage | Without Coverage |
| Under 6 Years | 0 (0.0%) | 0 (0.0%) |
| 6 to 18 Years | 31 (100.0%) | 0 (0.0%) |
| 19 to 25 Years | 14 (93.3%) | 1 (6.7%) |
| 26 to 34 Years | 6 (66.7%) | 3 (33.3%) |
| 35 to 44 Years | 11 (47.8%) | 12 (52.2%) |
| 45 to 54 Years | 26 (60.5%) | 17 (39.5%) |
| 55 to 64 Years | 18 (75.0%) | 6 (25.0%) |
| 65 to 74 Years | 29 (100.0%) | 0 (0.0%) |
| 75 Years and older | 23 (95.8%) | 1 (4.2%) |
| Total | 158 (79.8%) | 40 (20.2%) |
Health Insurance Coverage by Citizenship Status in Pollard
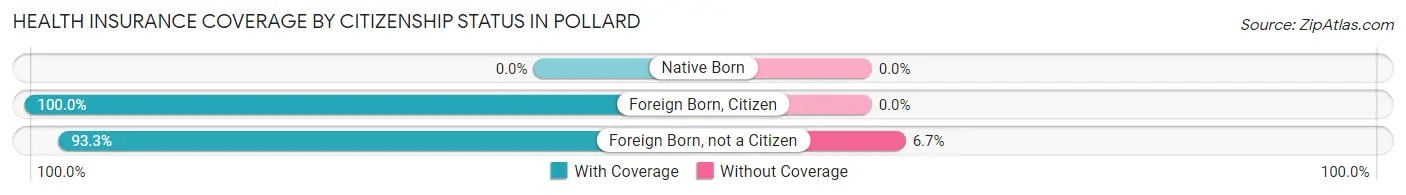
| Citizenship Status | With Coverage | Without Coverage |
| Native Born | 0 (0.0%) | 0 (0.0%) |
| Foreign Born, Citizen | 31 (100.0%) | 0 (0.0%) |
| Foreign Born, not a Citizen | 14 (93.3%) | 1 (6.7%) |
Health Insurance Coverage by Household Income in Pollard
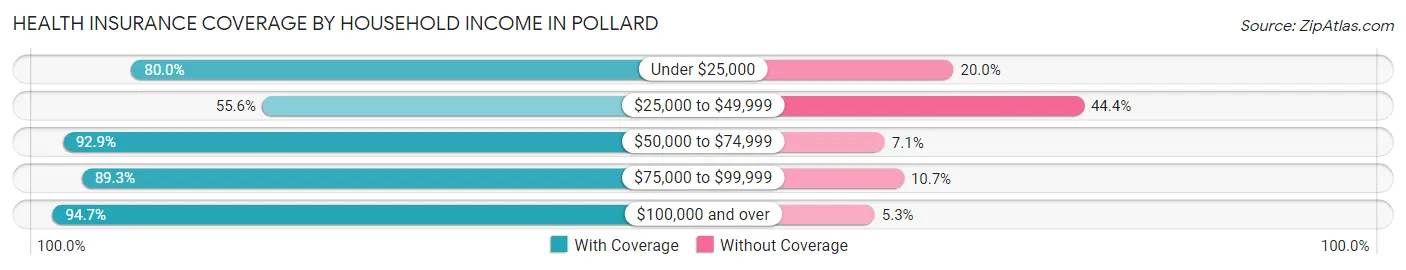
| Household Income | With Coverage | Without Coverage |
| Under $25,000 | 36 (80.0%) | 9 (20.0%) |
| $25,000 to $49,999 | 30 (55.6%) | 24 (44.4%) |
| $50,000 to $74,999 | 13 (92.9%) | 1 (7.1%) |
| $75,000 to $99,999 | 25 (89.3%) | 3 (10.7%) |
| $100,000 and over | 54 (94.7%) | 3 (5.3%) |
Public vs Private Health Insurance Coverage by Age in Pollard
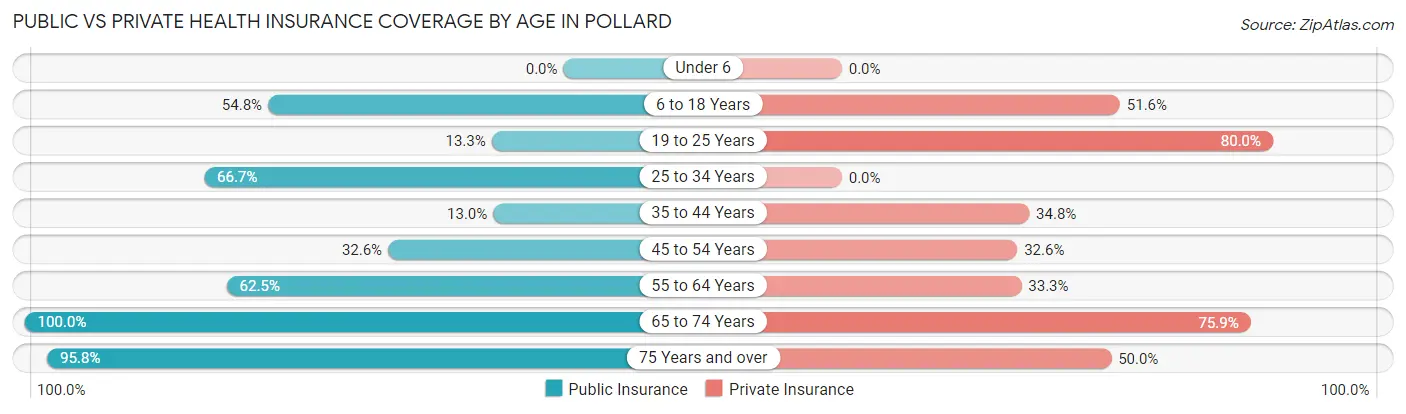
| Age Bracket | Public Insurance | Private Insurance |
| Under 6 | 0 (0.0%) | 0 (0.0%) |
| 6 to 18 Years | 17 (54.8%) | 16 (51.6%) |
| 19 to 25 Years | 2 (13.3%) | 12 (80.0%) |
| 25 to 34 Years | 6 (66.7%) | 0 (0.0%) |
| 35 to 44 Years | 3 (13.0%) | 8 (34.8%) |
| 45 to 54 Years | 14 (32.6%) | 14 (32.6%) |
| 55 to 64 Years | 15 (62.5%) | 8 (33.3%) |
| 65 to 74 Years | 29 (100.0%) | 22 (75.9%) |
| 75 Years and over | 23 (95.8%) | 12 (50.0%) |
| Total | 109 (55.0%) | 92 (46.5%) |
Disability Status by Sex by Age in Pollard
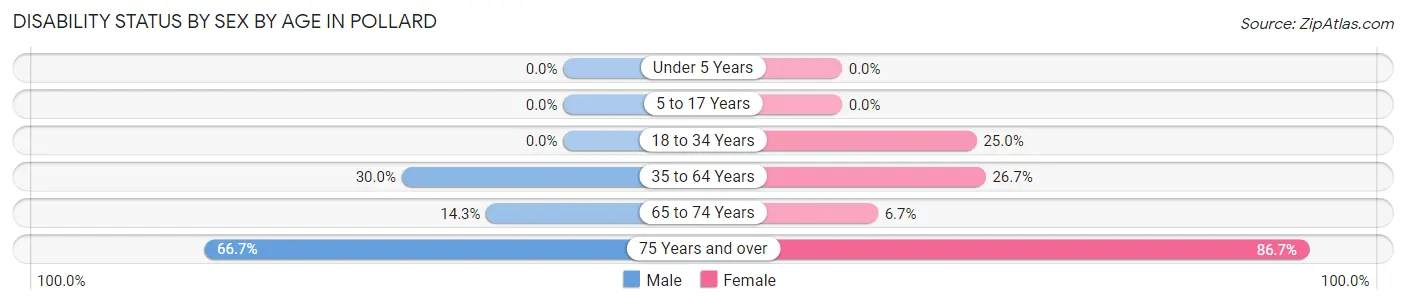
| Age Bracket | Male | Female |
| Under 5 Years | 0 (0.0%) | 0 (0.0%) |
| 5 to 17 Years | 0 (0.0%) | 0 (0.0%) |
| 18 to 34 Years | 0 (0.0%) | 4 (25.0%) |
| 35 to 64 Years | 18 (30.0%) | 8 (26.7%) |
| 65 to 74 Years | 2 (14.3%) | 1 (6.7%) |
| 75 Years and over | 6 (66.7%) | 13 (86.7%) |
Disability Class by Sex by Age in Pollard
Disability Class: Hearing Difficulty
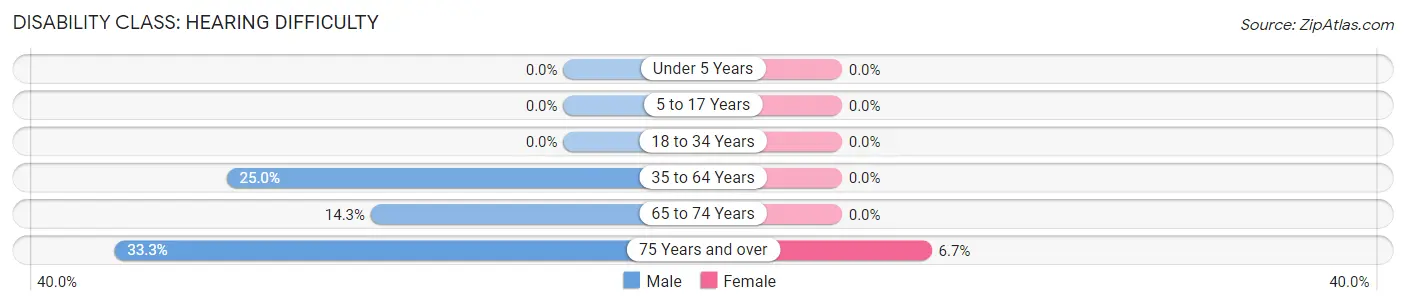
| Age Bracket | Male | Female |
| Under 5 Years | 0 (0.0%) | 0 (0.0%) |
| 5 to 17 Years | 0 (0.0%) | 0 (0.0%) |
| 18 to 34 Years | 0 (0.0%) | 0 (0.0%) |
| 35 to 64 Years | 15 (25.0%) | 0 (0.0%) |
| 65 to 74 Years | 2 (14.3%) | 0 (0.0%) |
| 75 Years and over | 3 (33.3%) | 1 (6.7%) |
Disability Class: Vision Difficulty
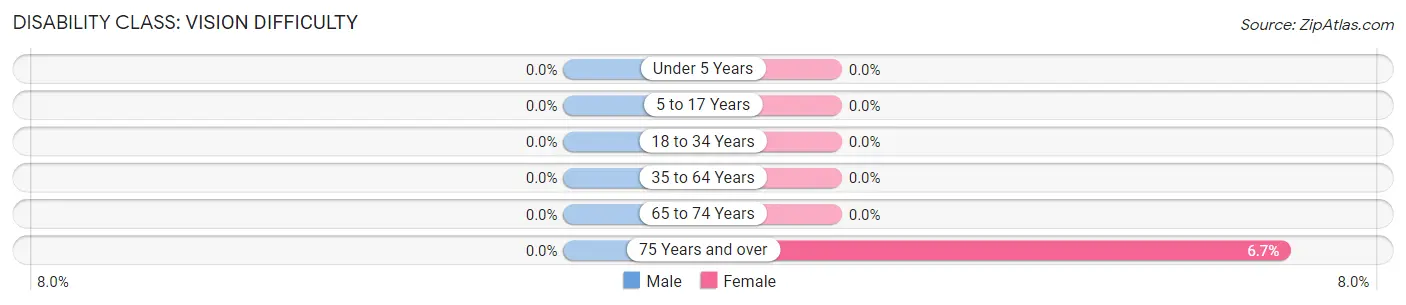
| Age Bracket | Male | Female |
| Under 5 Years | 0 (0.0%) | 0 (0.0%) |
| 5 to 17 Years | 0 (0.0%) | 0 (0.0%) |
| 18 to 34 Years | 0 (0.0%) | 0 (0.0%) |
| 35 to 64 Years | 0 (0.0%) | 0 (0.0%) |
| 65 to 74 Years | 0 (0.0%) | 0 (0.0%) |
| 75 Years and over | 0 (0.0%) | 1 (6.7%) |
Disability Class: Cognitive Difficulty
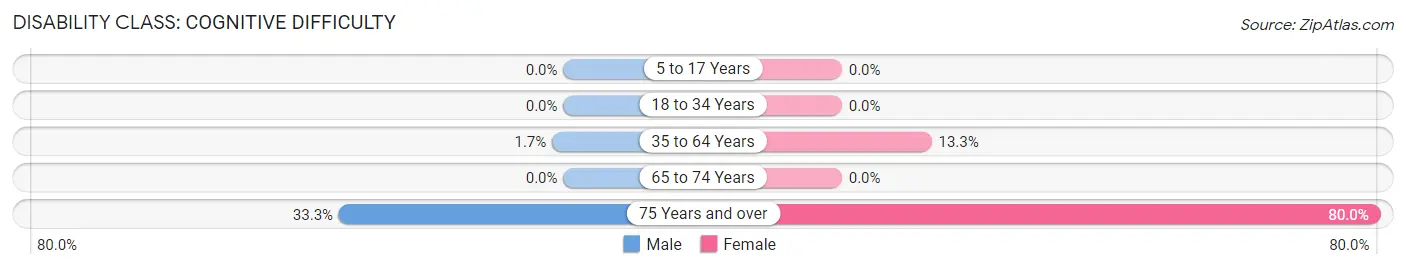
| Age Bracket | Male | Female |
| 5 to 17 Years | 0 (0.0%) | 0 (0.0%) |
| 18 to 34 Years | 0 (0.0%) | 0 (0.0%) |
| 35 to 64 Years | 1 (1.7%) | 4 (13.3%) |
| 65 to 74 Years | 0 (0.0%) | 0 (0.0%) |
| 75 Years and over | 3 (33.3%) | 12 (80.0%) |
Disability Class: Ambulatory Difficulty
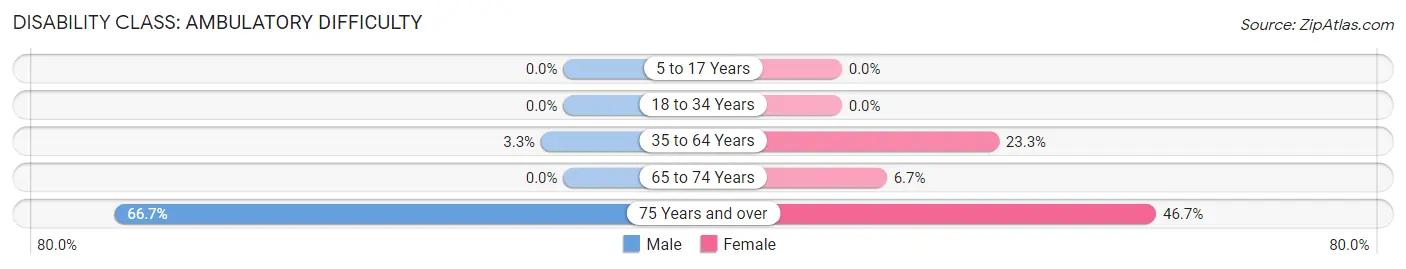
| Age Bracket | Male | Female |
| 5 to 17 Years | 0 (0.0%) | 0 (0.0%) |
| 18 to 34 Years | 0 (0.0%) | 0 (0.0%) |
| 35 to 64 Years | 2 (3.3%) | 7 (23.3%) |
| 65 to 74 Years | 0 (0.0%) | 1 (6.7%) |
| 75 Years and over | 6 (66.7%) | 7 (46.7%) |
Disability Class: Self-Care Difficulty
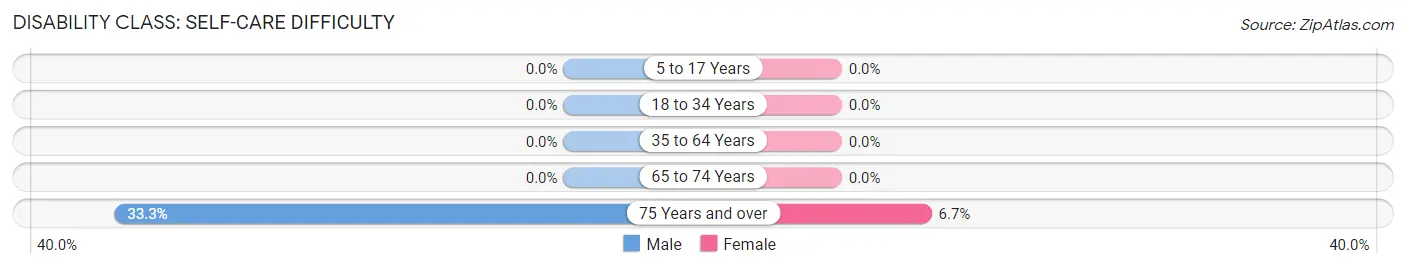
| Age Bracket | Male | Female |
| 5 to 17 Years | 0 (0.0%) | 0 (0.0%) |
| 18 to 34 Years | 0 (0.0%) | 0 (0.0%) |
| 35 to 64 Years | 0 (0.0%) | 0 (0.0%) |
| 65 to 74 Years | 0 (0.0%) | 0 (0.0%) |
| 75 Years and over | 3 (33.3%) | 1 (6.7%) |
Technology Access in Pollard
Computing Device Access in Pollard
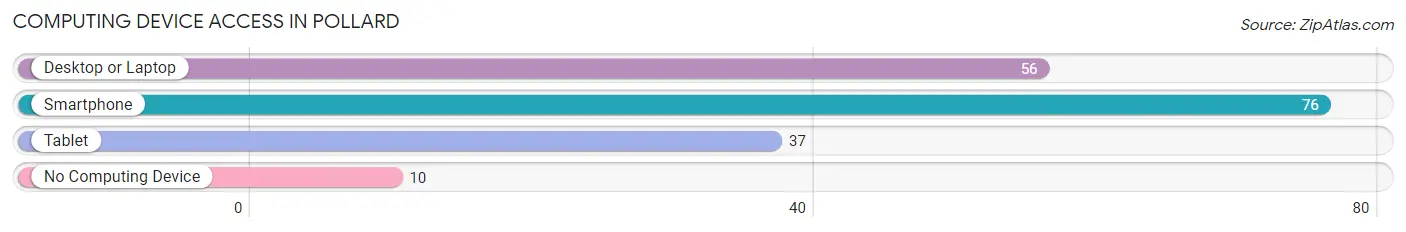
| Device Type | # Households | % Households |
| Desktop or Laptop | 56 | 62.9% |
| Smartphone | 76 | 85.4% |
| Tablet | 37 | 41.6% |
| No Computing Device | 10 | 11.2% |
| Total | 89 | 100.0% |
Internet Access in Pollard
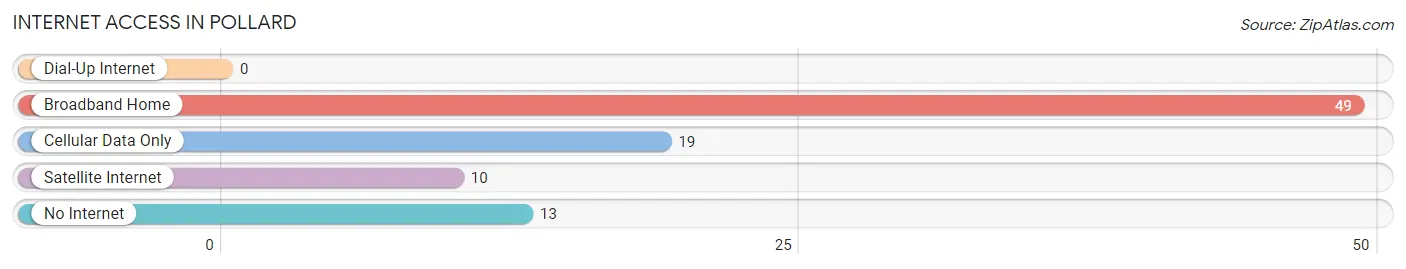
| Internet Type | # Households | % Households |
| Dial-Up Internet | 0 | 0.0% |
| Broadband Home | 49 | 55.1% |
| Cellular Data Only | 19 | 21.3% |
| Satellite Internet | 10 | 11.2% |
| No Internet | 13 | 14.6% |
| Total | 89 | 100.0% |
Pollard Summary
History
The small town of Pollard, Arkansas is located in Clay County in the northeastern corner of the state. It was founded in 1883 by the St. Louis, Iron Mountain and Southern Railway. The town was named after the railroad's president, Thomas Pollard. The town was originally a farming community, but it soon became a center for timber production. The timber industry was the main source of employment for the town until the late 20th century.
In the early 20th century, Pollard was a thriving community with a population of over 1,000 people. It had a variety of businesses, including a bank, a hotel, a movie theater, and several stores. The town also had a school, a post office, and a newspaper.
In the 1950s, the timber industry began to decline and the population of Pollard began to decrease. By the 1970s, the population had dropped to just over 500 people. In the 1980s, the town began to experience a resurgence as new businesses moved in and the population began to grow again.
Geography
Pollard is located in the Ozark Mountains in the northeastern corner of Arkansas. It is situated on the banks of the Black River, which is a tributary of the White River. The town is surrounded by rolling hills and forests, and is located about 30 miles from the Arkansas-Missouri border.
The climate in Pollard is humid subtropical, with hot summers and mild winters. The average annual temperature is around 64°F, and the average annual precipitation is around 45 inches.
Economy
The economy of Pollard is largely based on agriculture and timber production. The town is home to several farms, and the surrounding area is known for its production of cotton, soybeans, and corn. The timber industry is still an important part of the local economy, and the town is home to several sawmills and lumber companies.
In recent years, Pollard has become a popular tourist destination. The town is home to several historic sites, including the Pollard Historic District, which is listed on the National Register of Historic Places. The town also has several restaurants, shops, and other attractions.
Demographics
As of the 2010 census, the population of Pollard was 1,072. The racial makeup of the town was 95.3% White, 0.7% African American, 0.3% Native American, 0.2% Asian, 0.1% Pacific Islander, and 3.4% from other races. The median household income was $30,938, and the median family income was $37,813.
Pollard is a small, rural town with a close-knit community. The town is home to several churches, and the local school system is highly rated. The town is also home to several parks and recreational areas, including the Pollard City Park and the Pollard Nature Center.
Common Questions
What is Per Capita Income in Pollard?
Per Capita income in Pollard is $26,071.
What is the Median Family Income in Pollard?
Median Family Income in Pollard is $55,000.
What is the Median Household income in Pollard?
Median Household Income in Pollard is $43,036.
What is Income or Wage Gap in Pollard?
Income or Wage Gap in Pollard is 45.4%.
Women in Pollard earn 54.6 cents for every dollar earned by a man.
What is Inequality or Gini Index in Pollard?
Inequality or Gini Index in Pollard is 0.37.
What is the Total Population of Pollard?
Total Population of Pollard is 198.
What is the Total Male Population of Pollard?
Total Male Population of Pollard is 100.
What is the Total Female Population of Pollard?
Total Female Population of Pollard is 98.
What is the Ratio of Males per 100 Females in Pollard?
There are 102.04 Males per 100 Females in Pollard.
What is the Ratio of Females per 100 Males in Pollard?
There are 98.00 Females per 100 Males in Pollard.
What is the Median Population Age in Pollard?
Median Population Age in Pollard is 52.2 Years.
What is the Average Family Size in Pollard
Average Family Size in Pollard is 2.9 People.
What is the Average Household Size in Pollard
Average Household Size in Pollard is 2.2 People.
How Large is the Labor Force in Pollard?
There are 104 People in the Labor Forcein in Pollard.
What is the Percentage of People in the Labor Force in Pollard?
59.8% of People are in the Labor Force in Pollard.
What is the Unemployment Rate in Pollard?
Unemployment Rate in Pollard is 15.4%.