Haynes, AR Map & Demographics
Haynes Map
Haynes Overview
$22,151
PER CAPITA INCOME
$40,625
AVG FAMILY INCOME
$42,000
AVG HOUSEHOLD INCOME
0.41
INEQUALITY / GINI INDEX
113
TOTAL POPULATION
79
MALE POPULATION
34
FEMALE POPULATION
232.35
MALES / 100 FEMALES
43.04
FEMALES / 100 MALES
43.5
MEDIAN AGE
3.3
AVG FAMILY SIZE
3.0
AVG HOUSEHOLD SIZE
50
LABOR FORCE [ PEOPLE ]
47.2%
PERCENT IN LABOR FORCE
28.0%
UNEMPLOYMENT RATE
Haynes Zip Codes
Haynes Area Codes
Income in Haynes
Income Overview in Haynes
Per Capita Income in Haynes is $22,151, while median incomes of families and households are $40,625 and $42,000 respectively.
| Characteristic | Number | Measure |
| Per Capita Income | 113 | $22,151 |
| Median Family Income | 29 | $40,625 |
| Mean Family Income | 29 | $47,597 |
| Median Household Income | 38 | $42,000 |
| Mean Household Income | 38 | $54,482 |
| Income Deficit | 29 | $0 |
| Wage / Income Gap (%) | 113 | 0.00% |
| Wage / Income Gap ($) | 113 | 100.00¢ per $1 |
| Gini / Inequality Index | 113 | 0.41 |
Earnings by Sex in Haynes
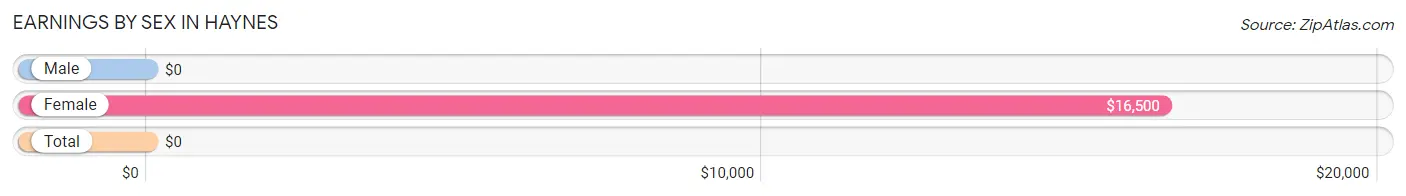
| Sex | Number | Average Earnings |
| Male | 43 (81.1%) | $0 |
| Female | 10 (18.9%) | $16,500 |
| Total | 53 (100.0%) | $0 |
Earnings by Sex by Income Bracket in Haynes
The most common earnings brackets in Haynes are $2,499 or less for men (12 | 27.9%) and $15,000 to $17,499 for women (5 | 50.0%).
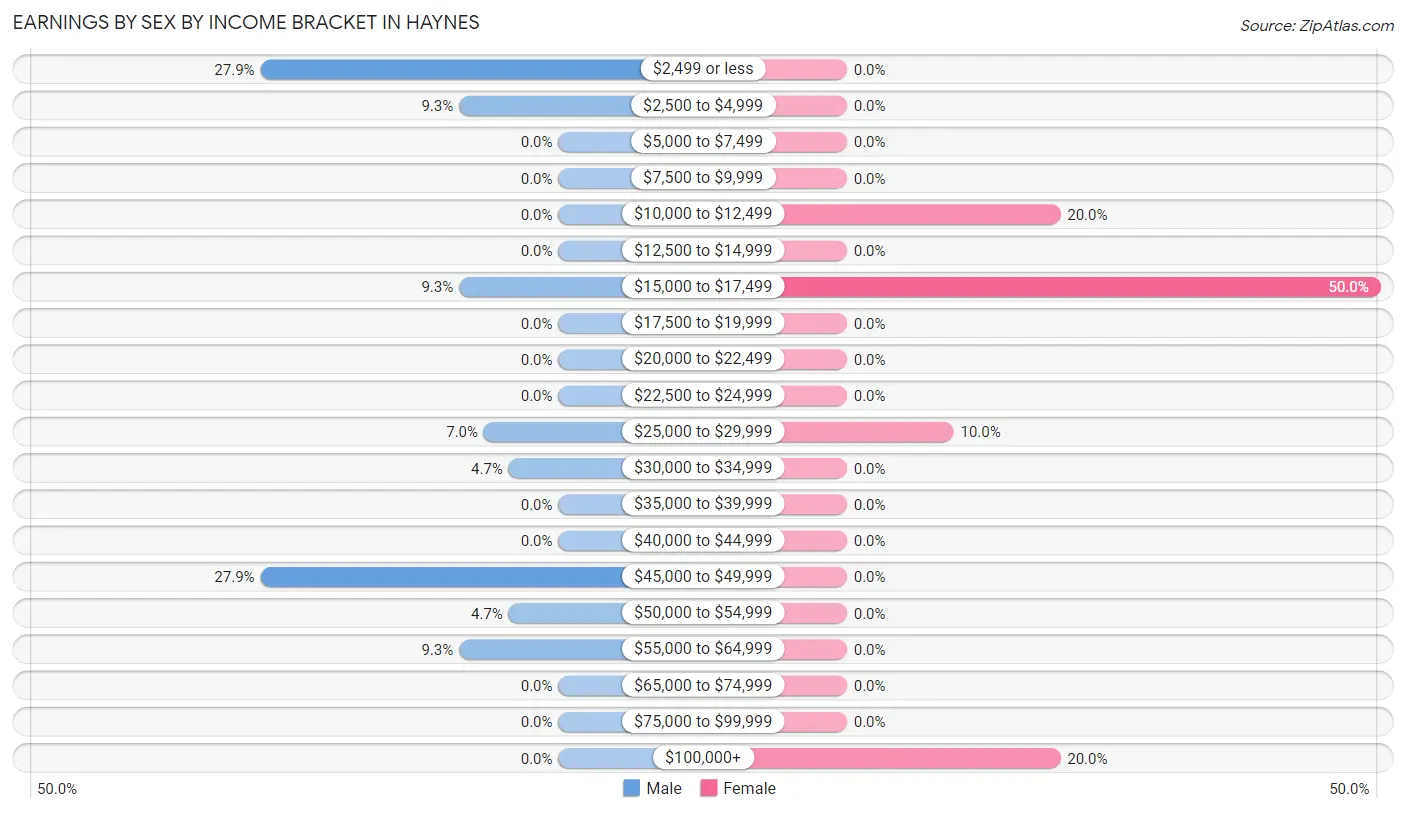
| Income | Male | Female |
| $2,499 or less | 12 (27.9%) | 0 (0.0%) |
| $2,500 to $4,999 | 4 (9.3%) | 0 (0.0%) |
| $5,000 to $7,499 | 0 (0.0%) | 0 (0.0%) |
| $7,500 to $9,999 | 0 (0.0%) | 0 (0.0%) |
| $10,000 to $12,499 | 0 (0.0%) | 2 (20.0%) |
| $12,500 to $14,999 | 0 (0.0%) | 0 (0.0%) |
| $15,000 to $17,499 | 4 (9.3%) | 5 (50.0%) |
| $17,500 to $19,999 | 0 (0.0%) | 0 (0.0%) |
| $20,000 to $22,499 | 0 (0.0%) | 0 (0.0%) |
| $22,500 to $24,999 | 0 (0.0%) | 0 (0.0%) |
| $25,000 to $29,999 | 3 (7.0%) | 1 (10.0%) |
| $30,000 to $34,999 | 2 (4.6%) | 0 (0.0%) |
| $35,000 to $39,999 | 0 (0.0%) | 0 (0.0%) |
| $40,000 to $44,999 | 0 (0.0%) | 0 (0.0%) |
| $45,000 to $49,999 | 12 (27.9%) | 0 (0.0%) |
| $50,000 to $54,999 | 2 (4.6%) | 0 (0.0%) |
| $55,000 to $64,999 | 4 (9.3%) | 0 (0.0%) |
| $65,000 to $74,999 | 0 (0.0%) | 0 (0.0%) |
| $75,000 to $99,999 | 0 (0.0%) | 0 (0.0%) |
| $100,000+ | 0 (0.0%) | 2 (20.0%) |
| Total | 43 (100.0%) | 10 (100.0%) |
Earnings by Sex by Educational Attainment in Haynes
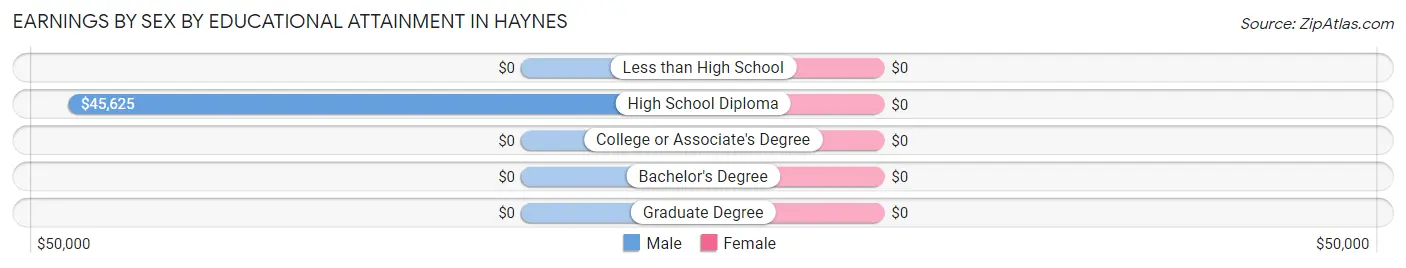
| Educational Attainment | Male Income | Female Income |
| Less than High School | - | - |
| High School Diploma | $45,625 | $0 |
| College or Associate's Degree | - | - |
| Bachelor's Degree | - | - |
| Graduate Degree | - | - |
| Total | - | - |
Family Income in Haynes
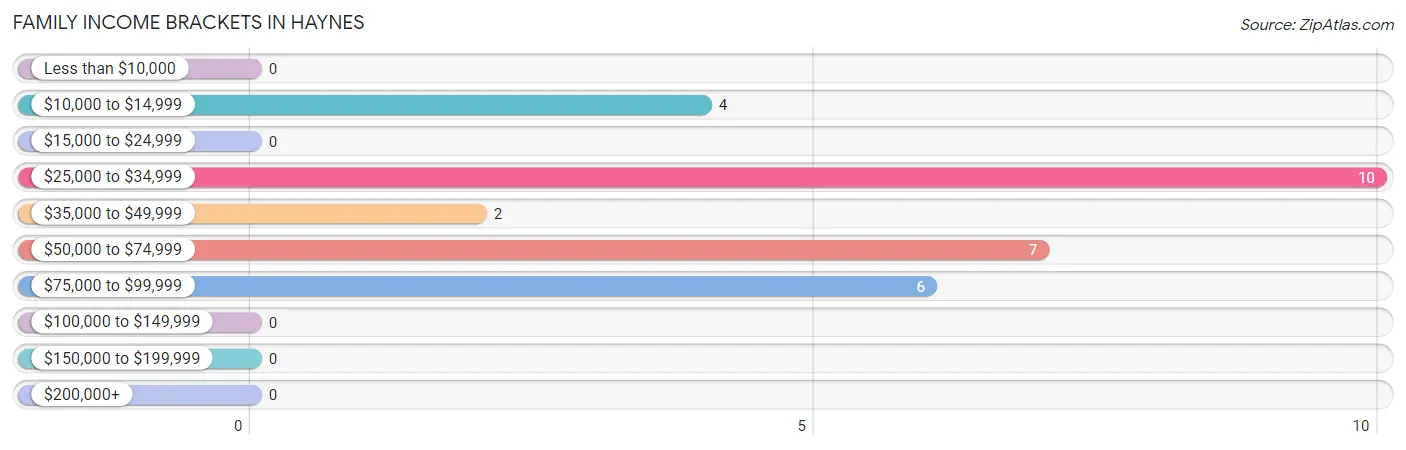
Family Income Brackets in Haynes
According to the Haynes family income data, there are 10 families falling into the $25,000 to $34,999 income range, which is the most common income bracket and makes up 34.5% of all families.
| Income Bracket | # Families | % Families |
| Less than $10,000 | 0 | 0.0% |
| $10,000 to $14,999 | 4 | 13.8% |
| $15,000 to $24,999 | 0 | 0.0% |
| $25,000 to $34,999 | 10 | 34.5% |
| $35,000 to $49,999 | 2 | 6.9% |
| $50,000 to $74,999 | 7 | 24.1% |
| $75,000 to $99,999 | 6 | 20.7% |
| $100,000 to $149,999 | 0 | 0.0% |
| $150,000 to $199,999 | 0 | 0.0% |
| $200,000+ | 0 | 0.0% |
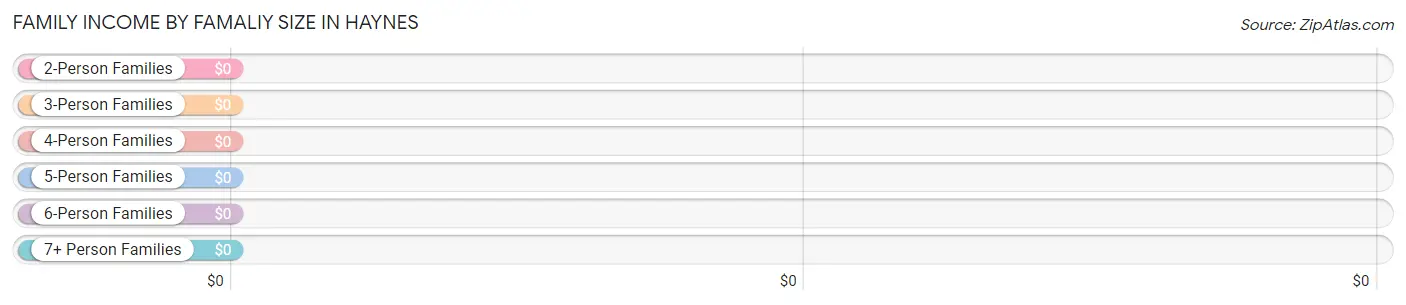
Family Income by Famaliy Size in Haynes
| Income Bracket | # Families | Median Income |
| 2-Person Families | 15 (51.7%) | $0 |
| 3-Person Families | 11 (37.9%) | $0 |
| 4-Person Families | 3 (10.3%) | $0 |
| 5-Person Families | 0 (0.0%) | $0 |
| 6-Person Families | 0 (0.0%) | $0 |
| 7+ Person Families | 0 (0.0%) | $0 |
| Total | 29 (100.0%) | $40,625 |
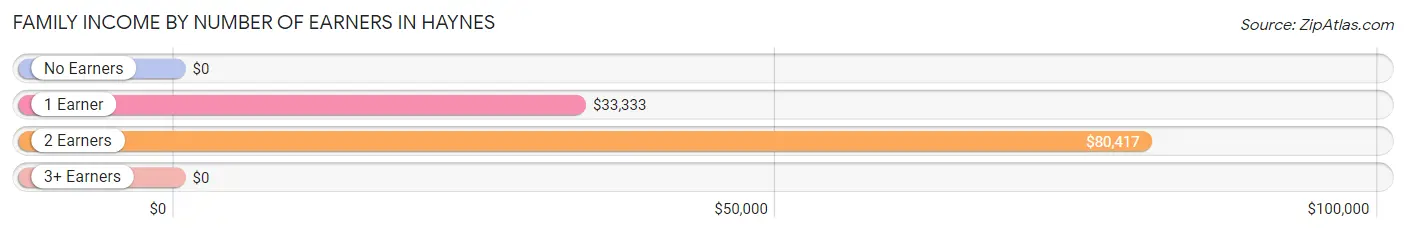
Family Income by Number of Earners in Haynes
| Number of Earners | # Families | Median Income |
| No Earners | 6 (20.7%) | $0 |
| 1 Earner | 16 (55.2%) | $33,333 |
| 2 Earners | 7 (24.1%) | $80,417 |
| 3+ Earners | 0 (0.0%) | $0 |
| Total | 29 (100.0%) | $40,625 |
Household Income in Haynes
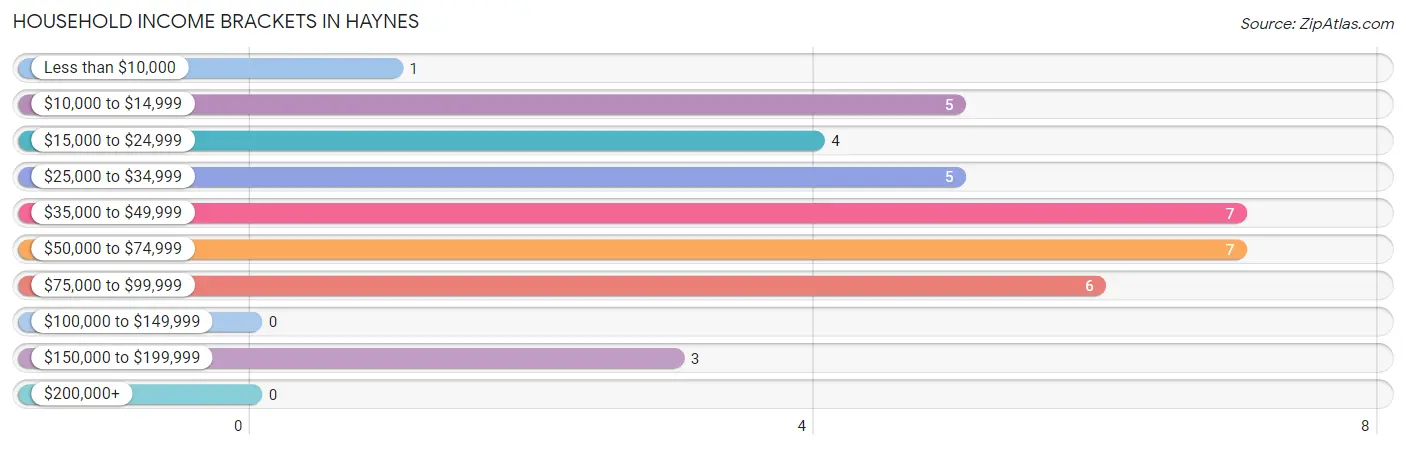
Household Income Brackets in Haynes
With 7 households falling in the category, the $35,000 to $49,999 income range is the most frequent in Haynes, accounting for 18.4% of all households.
| Income Bracket | # Households | % Households |
| Less than $10,000 | 1 | 2.6% |
| $10,000 to $14,999 | 5 | 13.2% |
| $15,000 to $24,999 | 4 | 10.5% |
| $25,000 to $34,999 | 5 | 13.2% |
| $35,000 to $49,999 | 7 | 18.4% |
| $50,000 to $74,999 | 7 | 18.4% |
| $75,000 to $99,999 | 6 | 15.8% |
| $100,000 to $149,999 | 0 | 0.0% |
| $150,000 to $199,999 | 3 | 7.9% |
| $200,000+ | 0 | 0.0% |
Household Income by Householder Age in Haynes
The median household income in Haynes is $42,000, with the highest median household income of $42,083 found in the 25 to 44 years age bracket for the primary householder. A total of 13 households (34.2%) fall into this category.
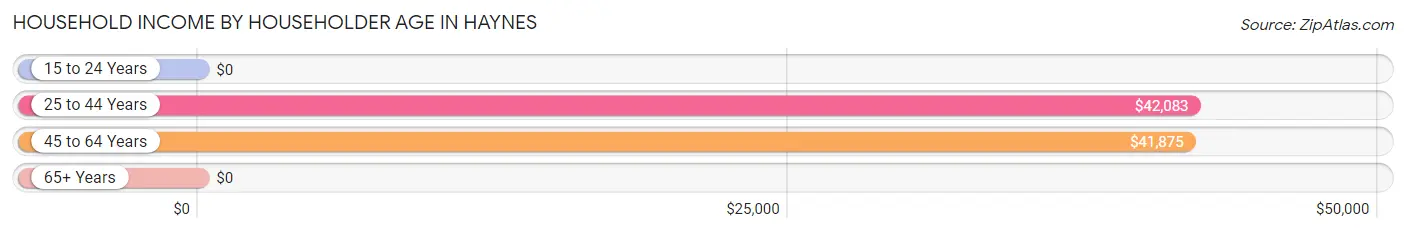
| Income Bracket | # Households | Median Income |
| 15 to 24 Years | 0 (0.0%) | $0 |
| 25 to 44 Years | 13 (34.2%) | $42,083 |
| 45 to 64 Years | 5 (13.2%) | $41,875 |
| 65+ Years | 20 (52.6%) | $0 |
| Total | 38 (100.0%) | $42,000 |
Poverty in Haynes
Income Below Poverty by Sex and Age in Haynes
With 7.6% poverty level for males and 14.7% for females among the residents of Haynes, 6 to 11 year old males and 75 year old and over females are the most vulnerable to poverty, with 2 males (28.6%) and 4 females (100.0%) in their respective age groups living below the poverty level.
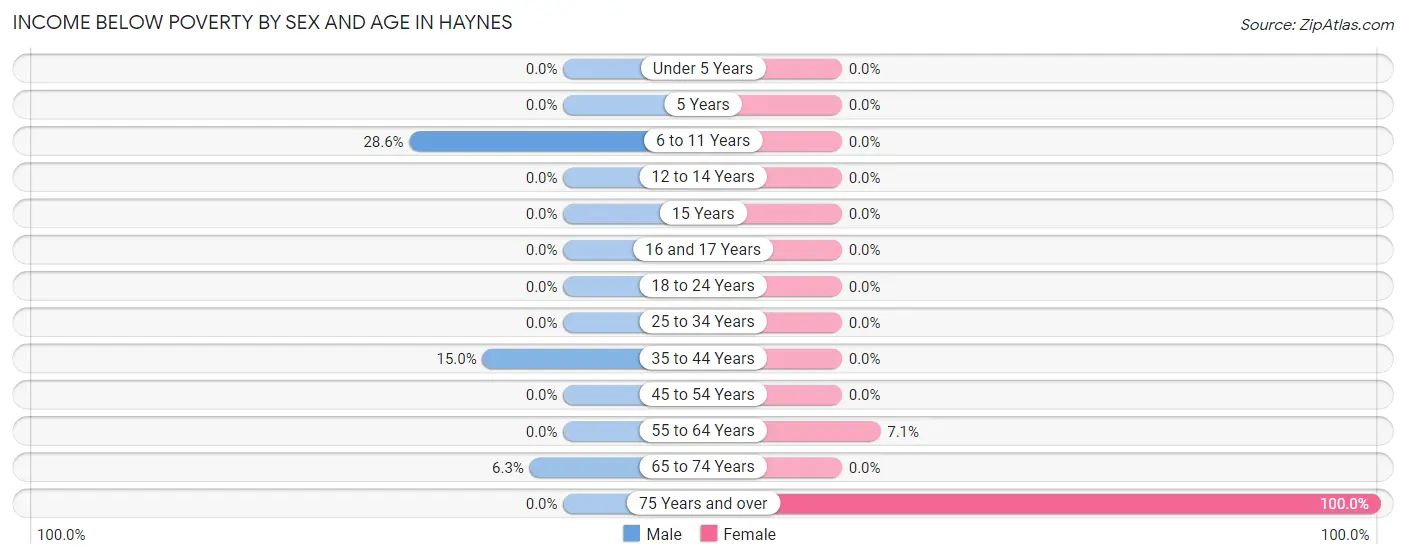
| Age Bracket | Male | Female |
| Under 5 Years | 0 (0.0%) | 0 (0.0%) |
| 5 Years | 0 (0.0%) | 0 (0.0%) |
| 6 to 11 Years | 2 (28.6%) | 0 (0.0%) |
| 12 to 14 Years | 0 (0.0%) | 0 (0.0%) |
| 15 Years | 0 (0.0%) | 0 (0.0%) |
| 16 and 17 Years | 0 (0.0%) | 0 (0.0%) |
| 18 to 24 Years | 0 (0.0%) | 0 (0.0%) |
| 25 to 34 Years | 0 (0.0%) | 0 (0.0%) |
| 35 to 44 Years | 3 (15.0%) | 0 (0.0%) |
| 45 to 54 Years | 0 (0.0%) | 0 (0.0%) |
| 55 to 64 Years | 0 (0.0%) | 1 (7.1%) |
| 65 to 74 Years | 1 (6.2%) | 0 (0.0%) |
| 75 Years and over | 0 (0.0%) | 4 (100.0%) |
| Total | 6 (7.6%) | 5 (14.7%) |
Income Above Poverty by Sex and Age in Haynes
According to the poverty statistics in Haynes, males aged 16 and 17 years and females aged 35 to 44 years are the age groups that are most secure financially, with 100.0% of males and 100.0% of females in these age groups living above the poverty line.
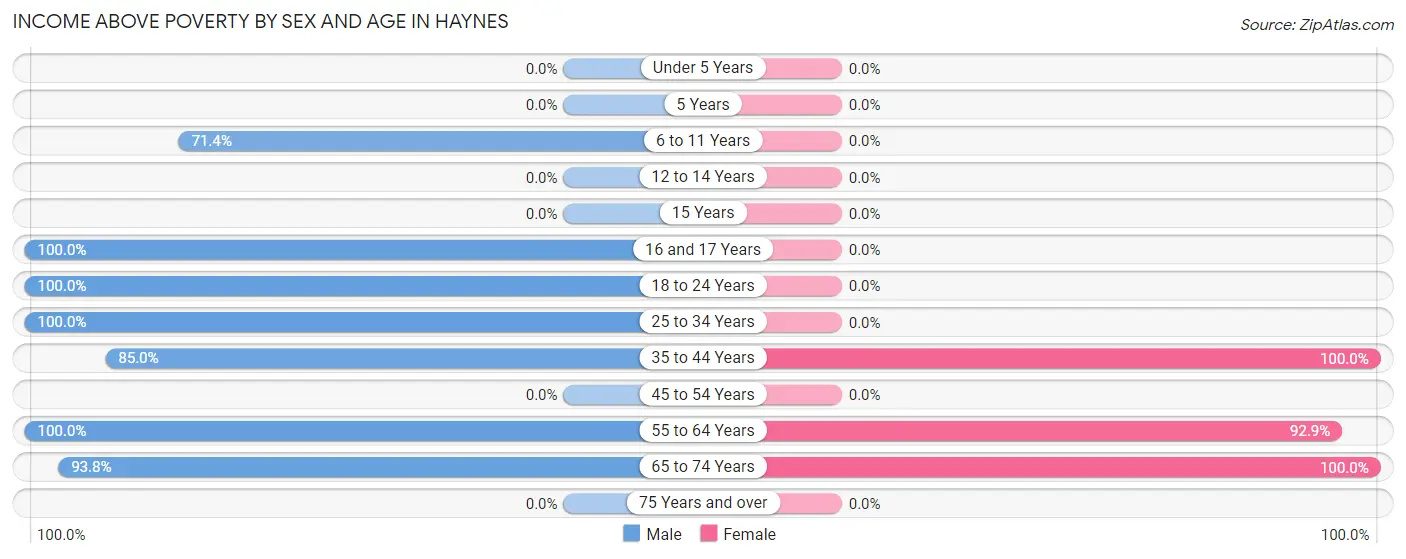
| Age Bracket | Male | Female |
| Under 5 Years | 0 (0.0%) | 0 (0.0%) |
| 5 Years | 0 (0.0%) | 0 (0.0%) |
| 6 to 11 Years | 5 (71.4%) | 0 (0.0%) |
| 12 to 14 Years | 0 (0.0%) | 0 (0.0%) |
| 15 Years | 0 (0.0%) | 0 (0.0%) |
| 16 and 17 Years | 2 (100.0%) | 0 (0.0%) |
| 18 to 24 Years | 14 (100.0%) | 0 (0.0%) |
| 25 to 34 Years | 7 (100.0%) | 0 (0.0%) |
| 35 to 44 Years | 17 (85.0%) | 7 (100.0%) |
| 45 to 54 Years | 0 (0.0%) | 0 (0.0%) |
| 55 to 64 Years | 13 (100.0%) | 13 (92.9%) |
| 65 to 74 Years | 15 (93.8%) | 9 (100.0%) |
| 75 Years and over | 0 (0.0%) | 0 (0.0%) |
| Total | 73 (92.4%) | 29 (85.3%) |
Income Below Poverty Among Married-Couple Families in Haynes
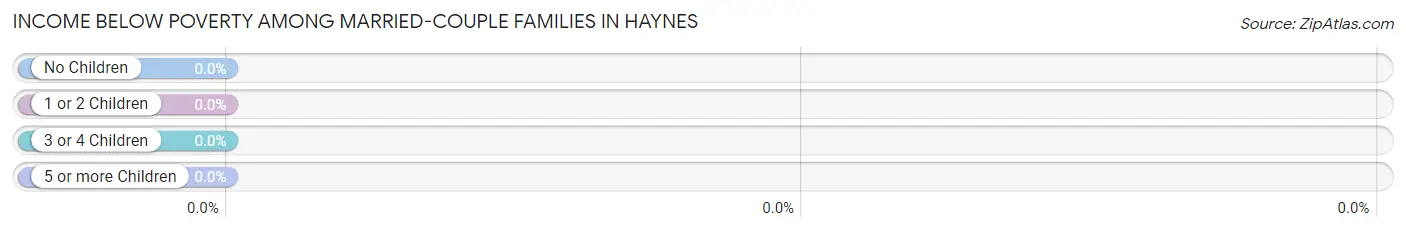
| Children | Above Poverty | Below Poverty |
| No Children | 14 (100.0%) | 0 (0.0%) |
| 1 or 2 Children | 3 (100.0%) | 0 (0.0%) |
| 3 or 4 Children | 0 (0.0%) | 0 (0.0%) |
| 5 or more Children | 0 (0.0%) | 0 (0.0%) |
| Total | 17 (100.0%) | 0 (0.0%) |
Income Below Poverty Among Single-Parent Households in Haynes
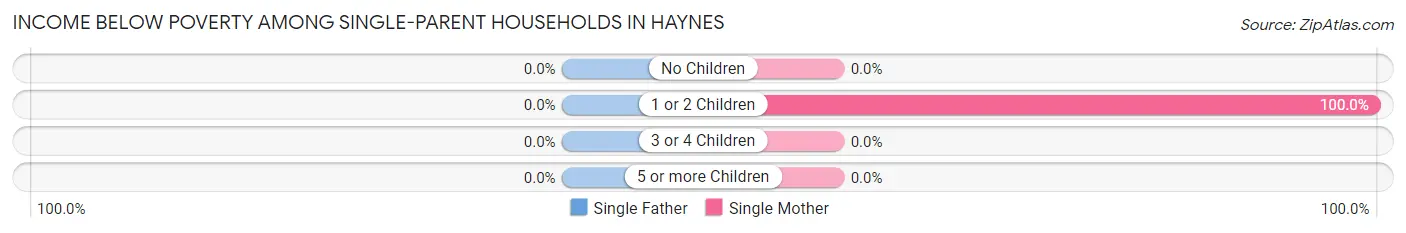
| Children | Single Father | Single Mother |
| No Children | 0 (0.0%) | 0 (0.0%) |
| 1 or 2 Children | 0 (0.0%) | 4 (100.0%) |
| 3 or 4 Children | 0 (0.0%) | 0 (0.0%) |
| 5 or more Children | 0 (0.0%) | 0 (0.0%) |
| Total | 0 (0.0%) | 4 (57.1%) |
Income Below Poverty Among Married-Couple vs Single-Parent Households in Haynes
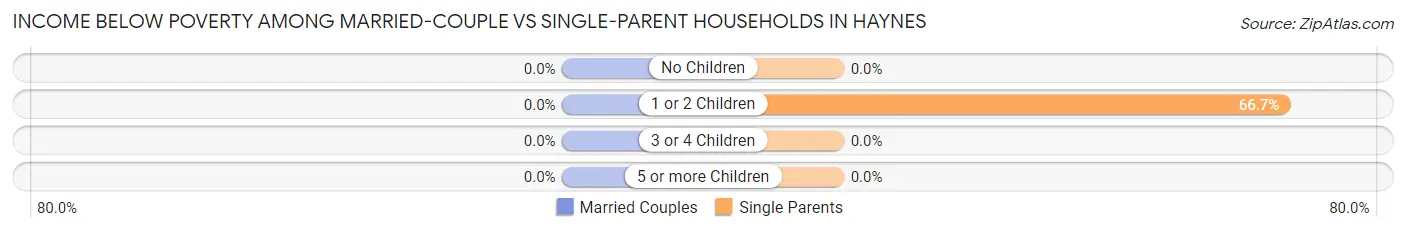
| Children | Married-Couple Families | Single-Parent Households |
| No Children | 0 (0.0%) | 0 (0.0%) |
| 1 or 2 Children | 0 (0.0%) | 4 (66.7%) |
| 3 or 4 Children | 0 (0.0%) | 0 (0.0%) |
| 5 or more Children | 0 (0.0%) | 0 (0.0%) |
| Total | 0 (0.0%) | 4 (33.3%) |
Race in Haynes
The most populous races in Haynes are Black / African American (86 | 76.1%), White / Caucasian (27 | 23.9%), and Hispanic or Latino (5 | 4.4%).
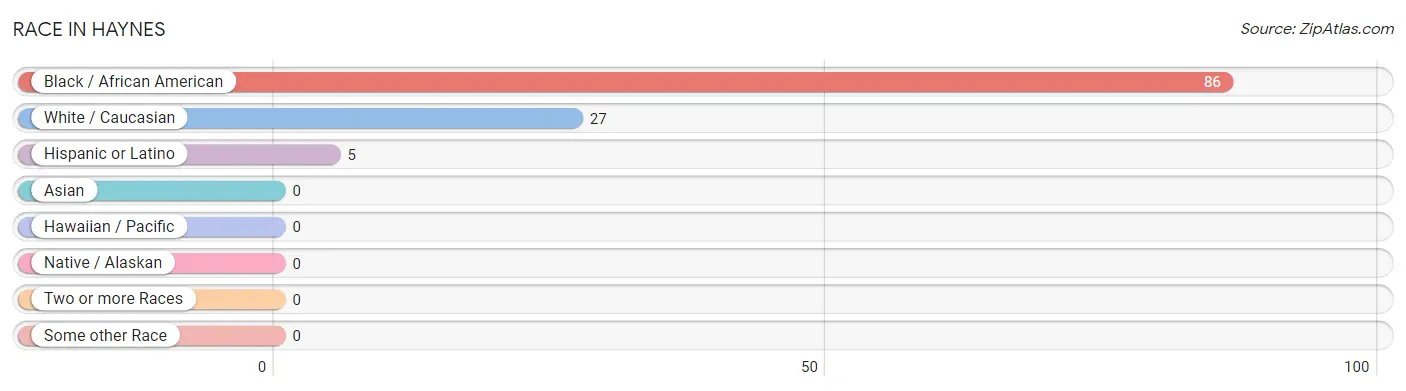
| Race | # Population | % Population |
| Asian | 0 | 0.0% |
| Black / African American | 86 | 76.1% |
| Hawaiian / Pacific | 0 | 0.0% |
| Hispanic or Latino | 5 | 4.4% |
| Native / Alaskan | 0 | 0.0% |
| White / Caucasian | 27 | 23.9% |
| Two or more Races | 0 | 0.0% |
| Some other Race | 0 | 0.0% |
| Total | 113 | 100.0% |
Ancestry in Haynes
The most populous ancestries reported in Haynes are Mexican (5 | 4.4%), Irish (4 | 3.5%), African (3 | 2.6%), and Subsaharan African (3 | 2.6%), together accounting for 13.3% of all Haynes residents.
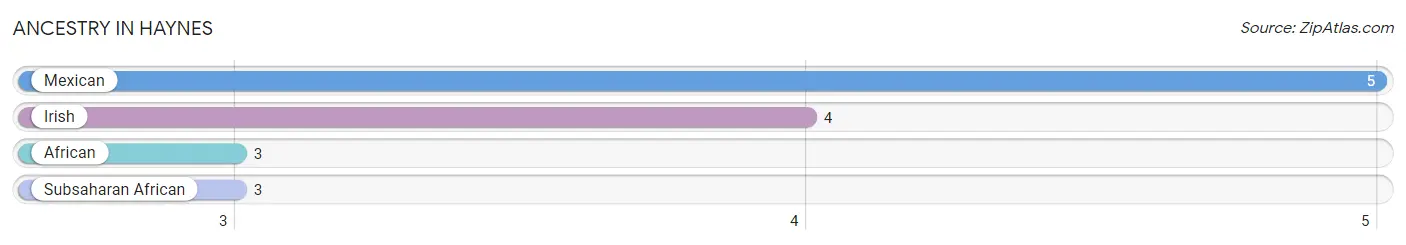
| Ancestry | # Population | % Population |
| African | 3 | 2.6% |
| Irish | 4 | 3.5% |
| Mexican | 5 | 4.4% |
| Subsaharan African | 3 | 2.6% | View All 4 Rows |
Immigrants in Haynes

| Immigration Origin | # Population | % Population | View All 0 Rows |
Sex and Age in Haynes
Sex and Age in Haynes
The most populous age groups in Haynes are 15 to 19 Years (12 | 15.2%) for men and 65 to 69 Years (9 | 26.5%) for women.
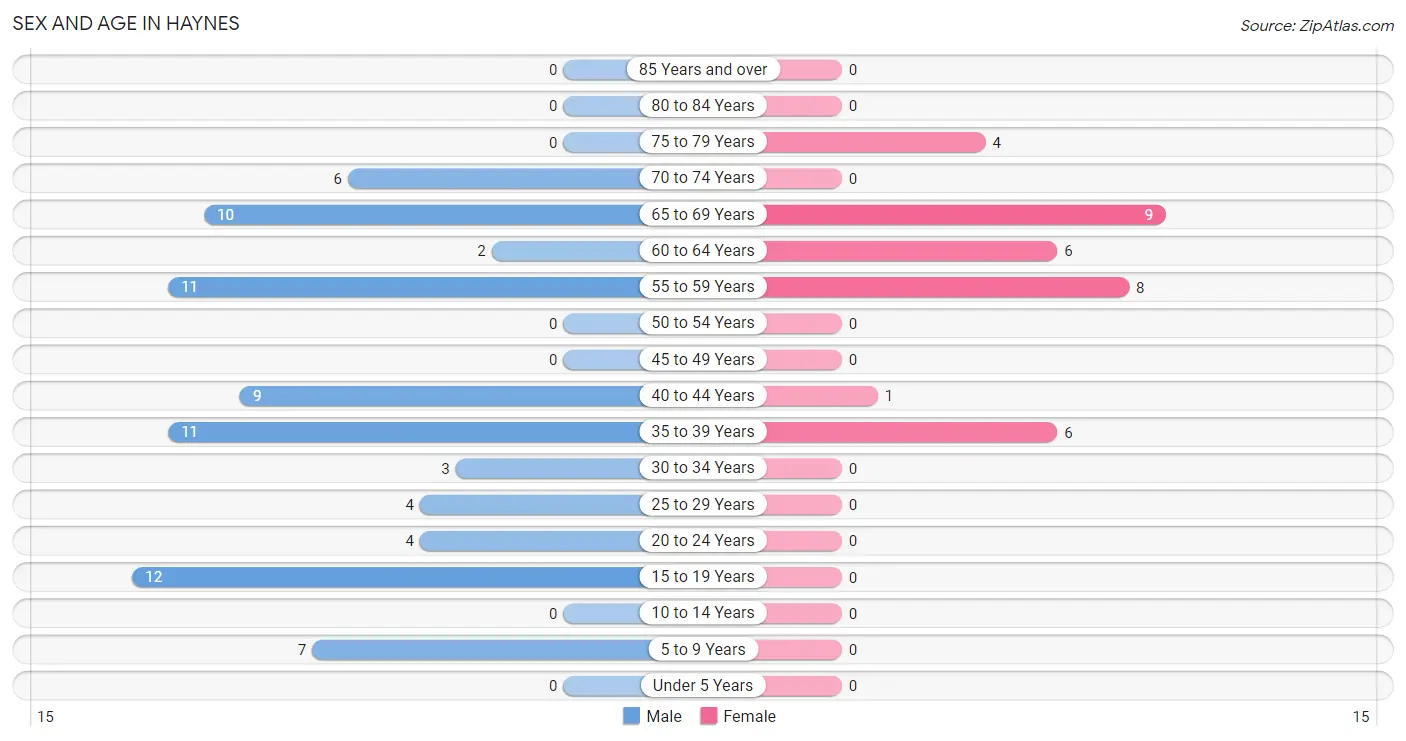
| Age Bracket | Male | Female |
| Under 5 Years | 0 (0.0%) | 0 (0.0%) |
| 5 to 9 Years | 7 (8.9%) | 0 (0.0%) |
| 10 to 14 Years | 0 (0.0%) | 0 (0.0%) |
| 15 to 19 Years | 12 (15.2%) | 0 (0.0%) |
| 20 to 24 Years | 4 (5.1%) | 0 (0.0%) |
| 25 to 29 Years | 4 (5.1%) | 0 (0.0%) |
| 30 to 34 Years | 3 (3.8%) | 0 (0.0%) |
| 35 to 39 Years | 11 (13.9%) | 6 (17.6%) |
| 40 to 44 Years | 9 (11.4%) | 1 (2.9%) |
| 45 to 49 Years | 0 (0.0%) | 0 (0.0%) |
| 50 to 54 Years | 0 (0.0%) | 0 (0.0%) |
| 55 to 59 Years | 11 (13.9%) | 8 (23.5%) |
| 60 to 64 Years | 2 (2.5%) | 6 (17.6%) |
| 65 to 69 Years | 10 (12.7%) | 9 (26.5%) |
| 70 to 74 Years | 6 (7.6%) | 0 (0.0%) |
| 75 to 79 Years | 0 (0.0%) | 4 (11.8%) |
| 80 to 84 Years | 0 (0.0%) | 0 (0.0%) |
| 85 Years and over | 0 (0.0%) | 0 (0.0%) |
| Total | 79 (100.0%) | 34 (100.0%) |
Families and Households in Haynes
Median Family Size in Haynes
The median family size in Haynes is 3.31 persons per family, with single male/father families (5 | 17.2%) accounting for the largest median family size of 5.4 persons per family. On the other hand, married-couple families (17 | 58.6%) represent the smallest median family size with 2.71 persons per family.
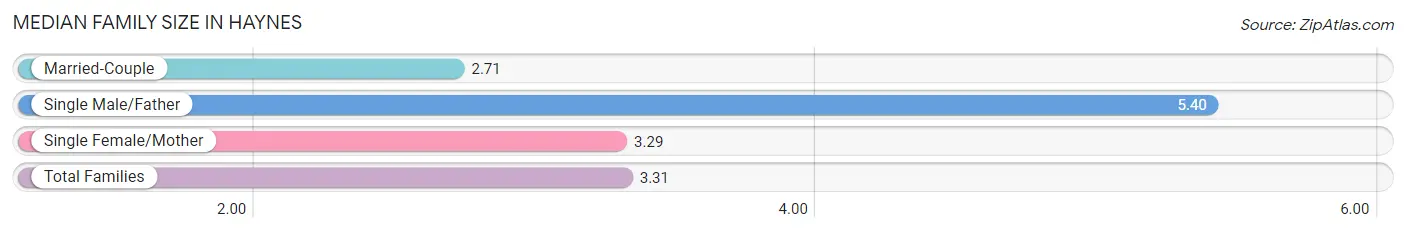
| Family Type | # Families | Family Size |
| Married-Couple | 17 (58.6%) | 2.71 |
| Single Male/Father | 5 (17.2%) | 5.40 |
| Single Female/Mother | 7 (24.1%) | 3.29 |
| Total Families | 29 (100.0%) | 3.31 |
Median Household Size in Haynes
The median household size in Haynes is 2.97 persons per household, with single male/father households (5 | 13.2%) accounting for the largest median household size of 6 persons per household. non-family households (9 | 23.7%) represent the smallest median household size with 1.22 persons per household.
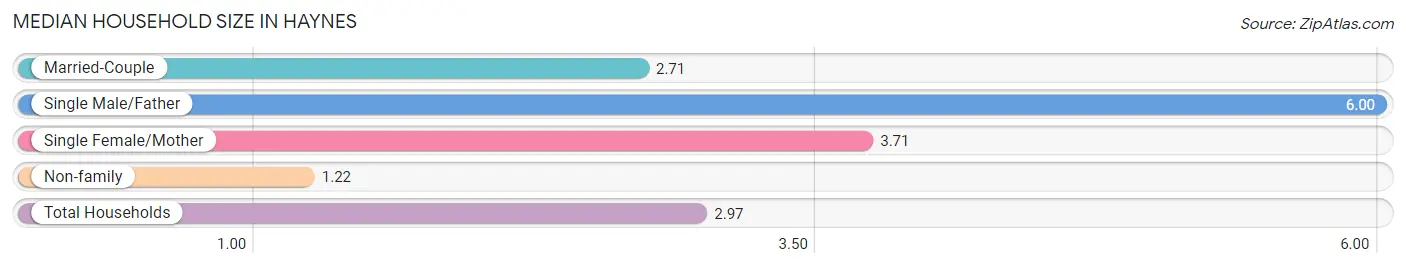
| Household Type | # Households | Household Size |
| Married-Couple | 17 (44.7%) | 2.71 |
| Single Male/Father | 5 (13.2%) | 6.00 |
| Single Female/Mother | 7 (18.4%) | 3.71 |
| Non-family | 9 (23.7%) | 1.22 |
| Total Households | 38 (100.0%) | 2.97 |
Household Size by Marriage Status in Haynes
Out of a total of 38 households in Haynes, 29 (76.3%) are family households, while 9 (23.7%) are nonfamily households. The most numerous type of family households are 2-person households, comprising 13, and the most common type of nonfamily households are 1-person households, comprising 6.
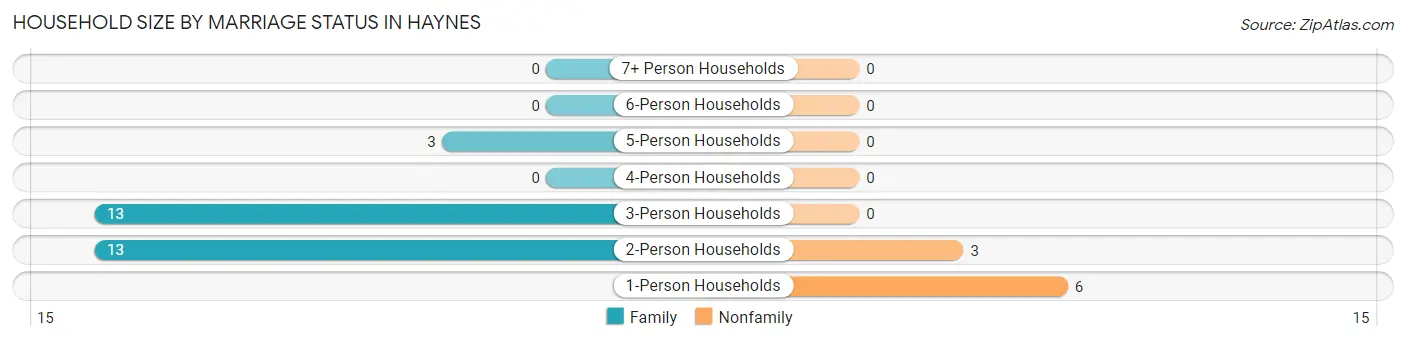
| Household Size | Family Households | Nonfamily Households |
| 1-Person Households | - | 6 (15.8%) |
| 2-Person Households | 13 (34.2%) | 3 (7.9%) |
| 3-Person Households | 13 (34.2%) | 0 (0.0%) |
| 4-Person Households | 0 (0.0%) | 0 (0.0%) |
| 5-Person Households | 3 (7.9%) | 0 (0.0%) |
| 6-Person Households | 0 (0.0%) | 0 (0.0%) |
| 7+ Person Households | 0 (0.0%) | 0 (0.0%) |
| Total | 29 (76.3%) | 9 (23.7%) |
Female Fertility in Haynes
Fertility by Age in Haynes
| Age Bracket | Women with Births | Births / 1,000 Women |
| 15 to 19 years | 0 (0.0%) | 0.0 |
| 20 to 34 years | 0 (0.0%) | 0.0 |
| 35 to 50 years | 0 (0.0%) | 0.0 |
| Total | 0 (0.0%) | 0.0 |
Fertility by Age by Marriage Status in Haynes
| Age Bracket | Married | Unmarried |
| 15 to 19 years | 0 (0.0%) | 0 (0.0%) |
| 20 to 34 years | 0 (0.0%) | 0 (0.0%) |
| 35 to 50 years | 0 (0.0%) | 0 (0.0%) |
| Total | 0 (0.0%) | 0 (0.0%) |
Fertility by Education in Haynes
| Educational Attainment | Women with Births | Births / 1,000 Women |
| Less than High School | 0 (0.0%) | 0.0 |
| High School Diploma | 0 (0.0%) | 0.0 |
| College or Associate's Degree | 0 (0.0%) | 0.0 |
| Bachelor's Degree | 0 (0.0%) | 0.0 |
| Graduate Degree | 0 (0.0%) | 0.0 |
| Total | 0 (0.0%) | 0.0 |
Fertility by Education by Marriage Status in Haynes
| Educational Attainment | Married | Unmarried |
| Less than High School | 0 (0.0%) | 0 (0.0%) |
| High School Diploma | 0 (0.0%) | 0 (0.0%) |
| College or Associate's Degree | 0 (0.0%) | 0 (0.0%) |
| Bachelor's Degree | 0 (0.0%) | 0 (0.0%) |
| Graduate Degree | 0 (0.0%) | 0 (0.0%) |
| Total | 0 (0.0%) | 0 (0.0%) |
Employment Characteristics in Haynes
Employment by Class of Employer in Haynes
Among the 33 employed individuals in Haynes, private company employees (29 | 87.9%), and state government employees (4 | 12.1%) make up the most common classes of employment.
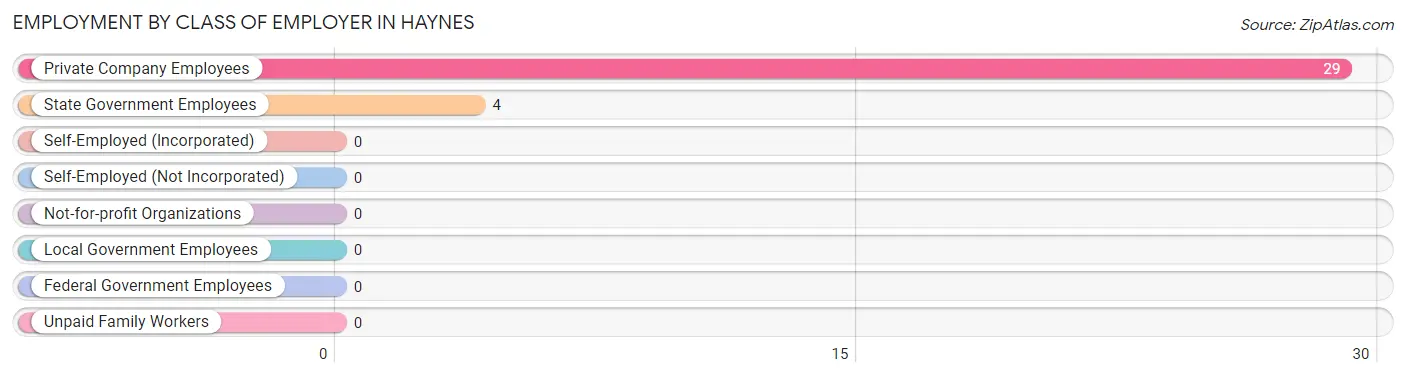
| Employer Class | # Employees | % Employees |
| Private Company Employees | 29 | 87.9% |
| Self-Employed (Incorporated) | 0 | 0.0% |
| Self-Employed (Not Incorporated) | 0 | 0.0% |
| Not-for-profit Organizations | 0 | 0.0% |
| Local Government Employees | 0 | 0.0% |
| State Government Employees | 4 | 12.1% |
| Federal Government Employees | 0 | 0.0% |
| Unpaid Family Workers | 0 | 0.0% |
| Total | 33 | 100.0% |
Employment Status by Age in Haynes
According to the labor force statistics for Haynes, out of the total population over 16 years of age (106), 47.2% or 50 individuals are in the labor force, with 28.0% or 14 of them unemployed. The age group with the highest labor force participation rate is 25 to 29 years, with 100.0% or 4 individuals in the labor force. Within the labor force, the 55 to 59 years age range has the highest percentage of unemployed individuals, with 100.0% or 11 of them being unemployed.
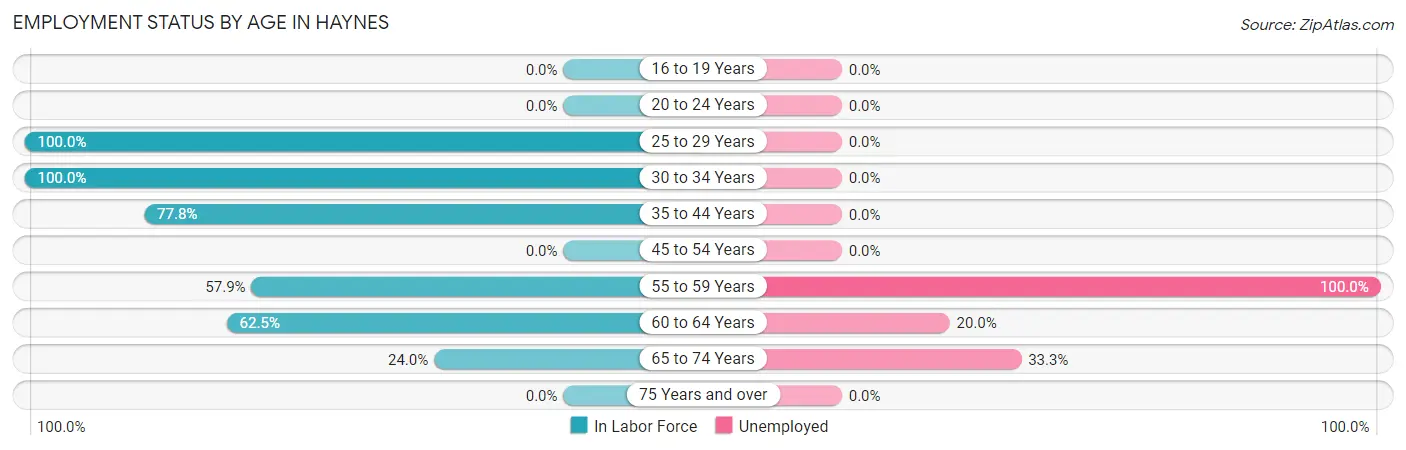
| Age Bracket | In Labor Force | Unemployed |
| 16 to 19 Years | 0 (0.0%) | 0 (0.0%) |
| 20 to 24 Years | 0 (0.0%) | 0 (0.0%) |
| 25 to 29 Years | 4 (100.0%) | 0 (0.0%) |
| 30 to 34 Years | 3 (100.0%) | 0 (0.0%) |
| 35 to 44 Years | 21 (77.8%) | 0 (0.0%) |
| 45 to 54 Years | 0 (0.0%) | 0 (0.0%) |
| 55 to 59 Years | 11 (57.9%) | 11 (100.0%) |
| 60 to 64 Years | 5 (62.5%) | 1 (20.0%) |
| 65 to 74 Years | 6 (24.0%) | 2 (33.3%) |
| 75 Years and over | 0 (0.0%) | 0 (0.0%) |
| Total | 50 (47.2%) | 14 (28.0%) |
Employment Status by Educational Attainment in Haynes
According to labor force statistics for Haynes, 72.1% of individuals (44) out of the total population between 25 and 64 years of age (61) are in the labor force, with 27.3% or 12 of them being unemployed. The group with the highest labor force participation rate are those with the educational attainment of less than high school, with 100.0% or 1 individuals in the labor force. Within the labor force, individuals with high school diploma education have the highest percentage of unemployment, with 34.4% or 11 of them being unemployed.
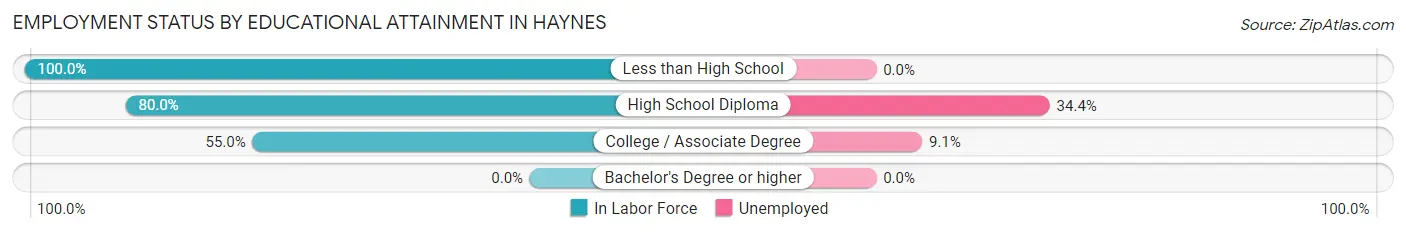
| Educational Attainment | In Labor Force | Unemployed |
| Less than High School | 1 (100.0%) | 0 (0.0%) |
| High School Diploma | 32 (80.0%) | 14 (34.4%) |
| College / Associate Degree | 11 (55.0%) | 2 (9.1%) |
| Bachelor's Degree or higher | 0 (0.0%) | 0 (0.0%) |
| Total | 44 (72.1%) | 17 (27.3%) |
Employment Occupations by Sex in Haynes
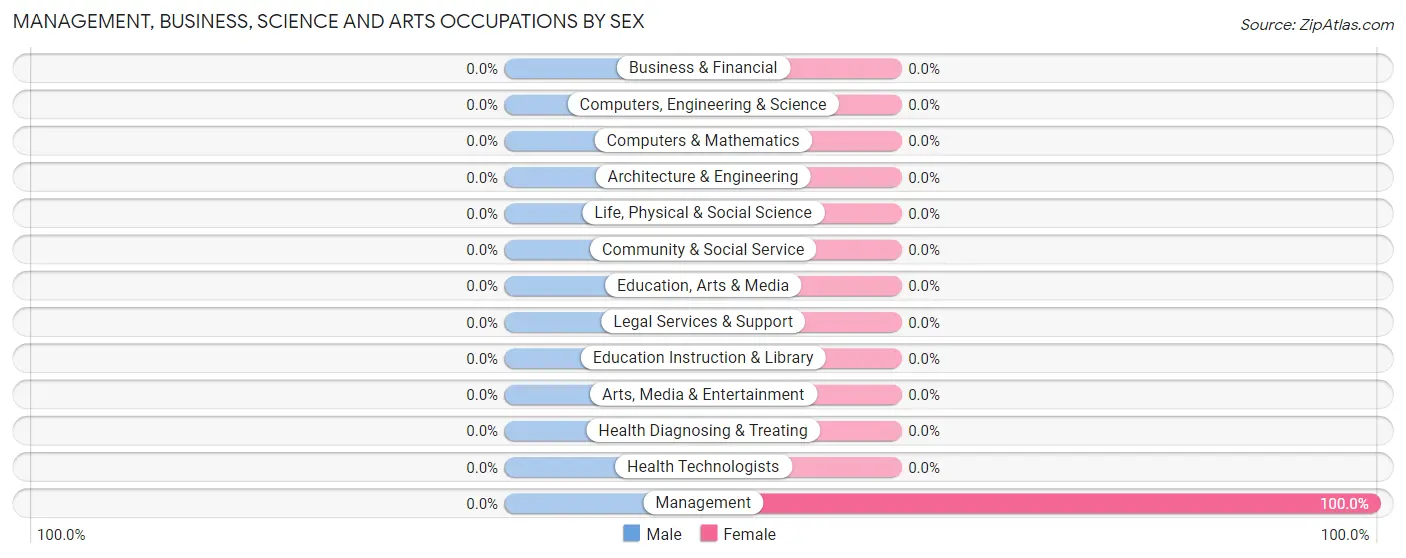
Management, Business, Science and Arts Occupations
The most common Management, Business, Science and Arts occupations in Haynes are , and Management (2 | 5.6%).
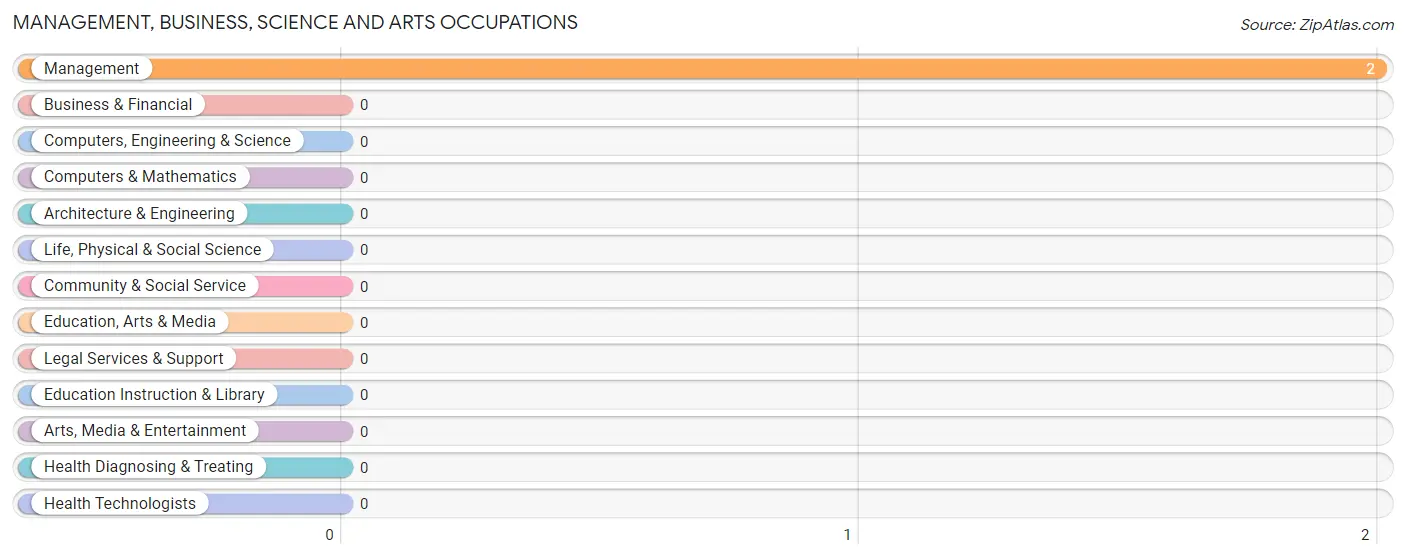
Management, Business, Science and Arts Occupations by Sex
| Occupation | Male | Female |
| Management | 0 (0.0%) | 2 (100.0%) |
| Business & Financial | 0 (0.0%) | 0 (0.0%) |
| Computers, Engineering & Science | 0 (0.0%) | 0 (0.0%) |
| Computers & Mathematics | 0 (0.0%) | 0 (0.0%) |
| Architecture & Engineering | 0 (0.0%) | 0 (0.0%) |
| Life, Physical & Social Science | 0 (0.0%) | 0 (0.0%) |
| Community & Social Service | 0 (0.0%) | 0 (0.0%) |
| Education, Arts & Media | 0 (0.0%) | 0 (0.0%) |
| Legal Services & Support | 0 (0.0%) | 0 (0.0%) |
| Education Instruction & Library | 0 (0.0%) | 0 (0.0%) |
| Arts, Media & Entertainment | 0 (0.0%) | 0 (0.0%) |
| Health Diagnosing & Treating | 0 (0.0%) | 0 (0.0%) |
| Health Technologists | 0 (0.0%) | 0 (0.0%) |
| Total (Category) | 0 (0.0%) | 2 (100.0%) |
| Total (Overall) | 26 (72.2%) | 10 (27.8%) |
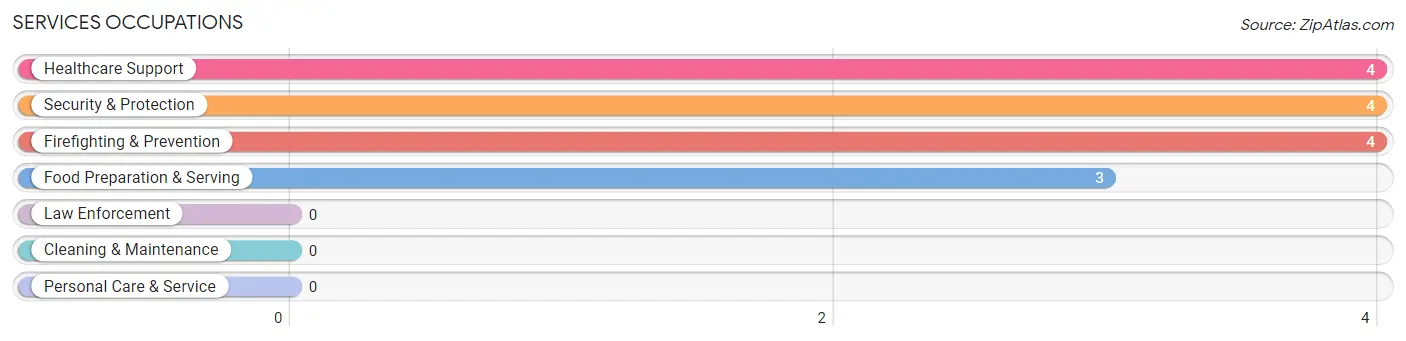
Services Occupations
The most common Services occupations in Haynes are Healthcare Support (4 | 11.1%), Security & Protection (4 | 11.1%), Firefighting & Prevention (4 | 11.1%), and Food Preparation & Serving (3 | 8.3%).
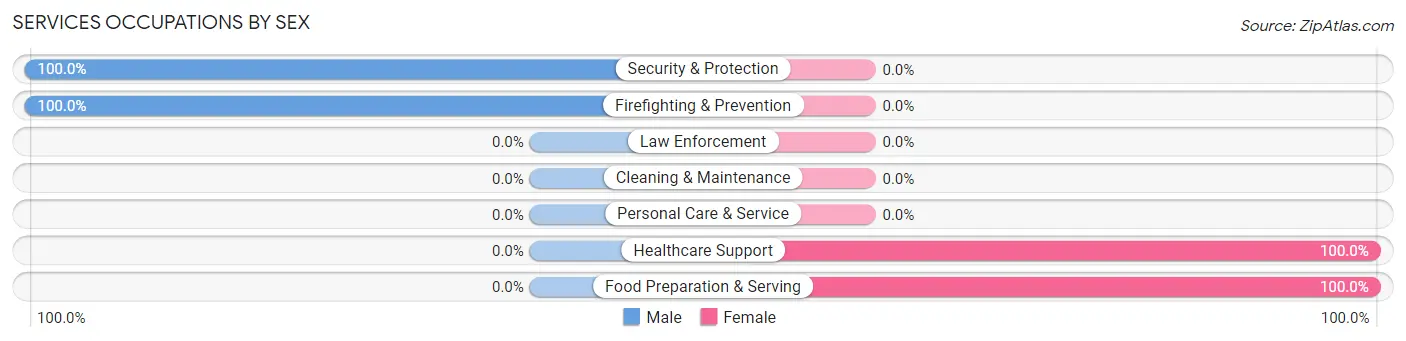
Services Occupations by Sex
Within the Services occupations in Haynes, the most male-oriented occupations are Security & Protection (100.0%), and Firefighting & Prevention (100.0%), while the most female-oriented occupations are Healthcare Support (100.0%), and Food Preparation & Serving (100.0%).
| Occupation | Male | Female |
| Healthcare Support | 0 (0.0%) | 4 (100.0%) |
| Security & Protection | 4 (100.0%) | 0 (0.0%) |
| Firefighting & Prevention | 4 (100.0%) | 0 (0.0%) |
| Law Enforcement | 0 (0.0%) | 0 (0.0%) |
| Food Preparation & Serving | 0 (0.0%) | 3 (100.0%) |
| Cleaning & Maintenance | 0 (0.0%) | 0 (0.0%) |
| Personal Care & Service | 0 (0.0%) | 0 (0.0%) |
| Total (Category) | 4 (36.4%) | 7 (63.6%) |
| Total (Overall) | 26 (72.2%) | 10 (27.8%) |
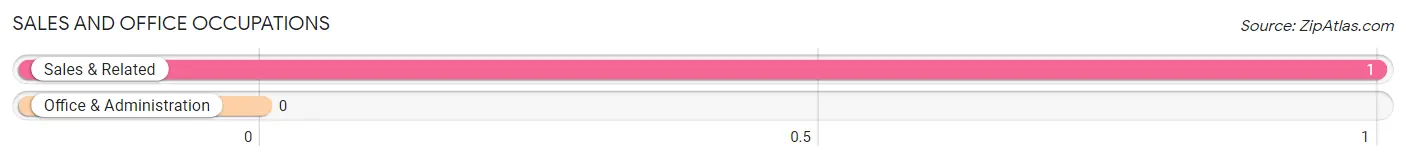
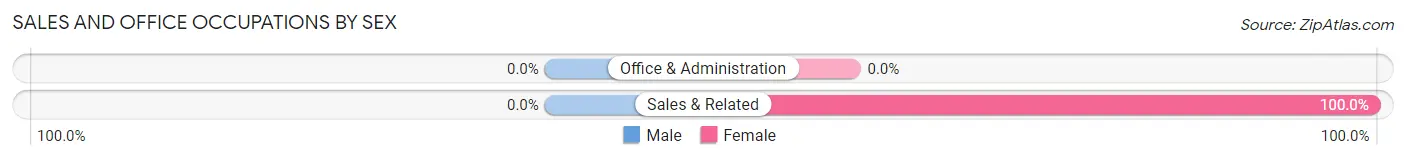
Sales and Office Occupations
The most common Sales and Office occupations in Haynes are , and Sales & Related (1 | 2.8%).
Sales and Office Occupations by Sex
| Occupation | Male | Female |
| Sales & Related | 0 (0.0%) | 1 (100.0%) |
| Office & Administration | 0 (0.0%) | 0 (0.0%) |
| Total (Category) | 0 (0.0%) | 1 (100.0%) |
| Total (Overall) | 26 (72.2%) | 10 (27.8%) |
Natural Resources, Construction and Maintenance Occupations
The most common Natural Resources, Construction and Maintenance occupations in Haynes are Farming, Fishing & Forestry (5 | 13.9%), and Construction & Extraction (4 | 11.1%).
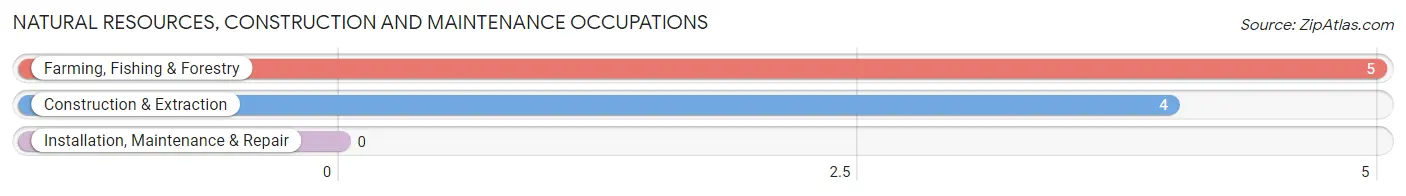
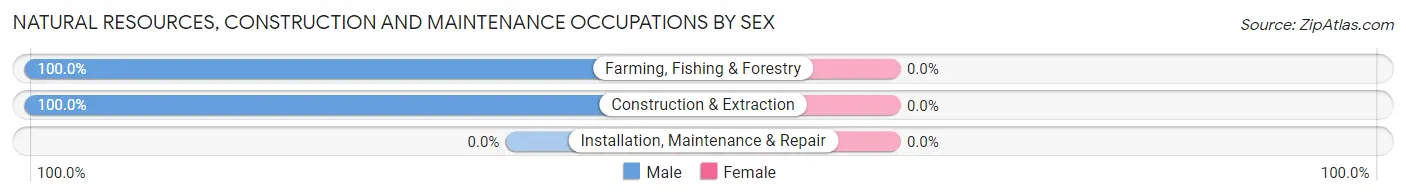
Natural Resources, Construction and Maintenance Occupations by Sex
| Occupation | Male | Female |
| Farming, Fishing & Forestry | 5 (100.0%) | 0 (0.0%) |
| Construction & Extraction | 4 (100.0%) | 0 (0.0%) |
| Installation, Maintenance & Repair | 0 (0.0%) | 0 (0.0%) |
| Total (Category) | 9 (100.0%) | 0 (0.0%) |
| Total (Overall) | 26 (72.2%) | 10 (27.8%) |
Production, Transportation and Moving Occupations
The most common Production, Transportation and Moving occupations in Haynes are , and Transportation (13 | 36.1%).
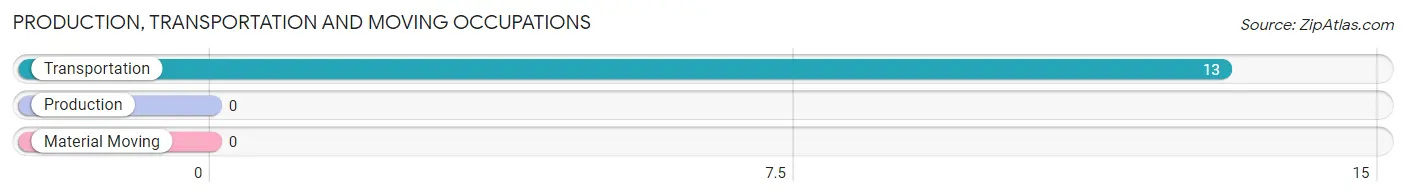
Production, Transportation and Moving Occupations by Sex
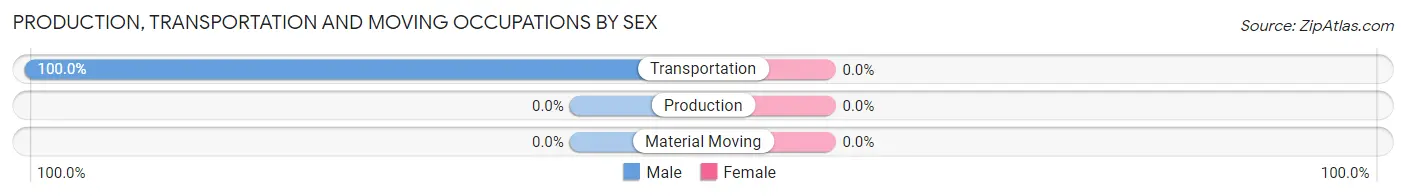
| Occupation | Male | Female |
| Production | 0 (0.0%) | 0 (0.0%) |
| Transportation | 13 (100.0%) | 0 (0.0%) |
| Material Moving | 0 (0.0%) | 0 (0.0%) |
| Total (Category) | 13 (100.0%) | 0 (0.0%) |
| Total (Overall) | 26 (72.2%) | 10 (27.8%) |
Employment Industries by Sex in Haynes
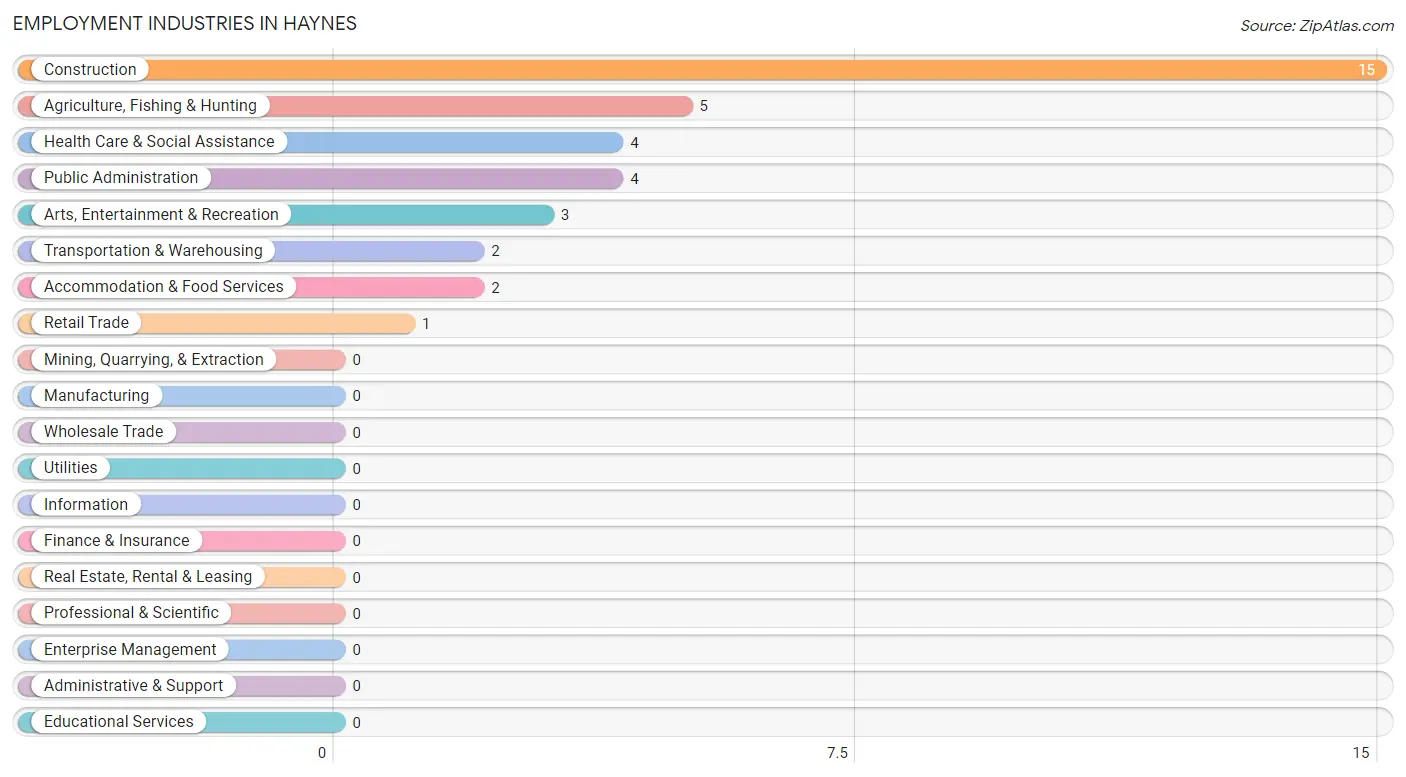
Employment Industries in Haynes
The major employment industries in Haynes include Construction (15 | 41.7%), Agriculture, Fishing & Hunting (5 | 13.9%), Health Care & Social Assistance (4 | 11.1%), Public Administration (4 | 11.1%), and Arts, Entertainment & Recreation (3 | 8.3%).
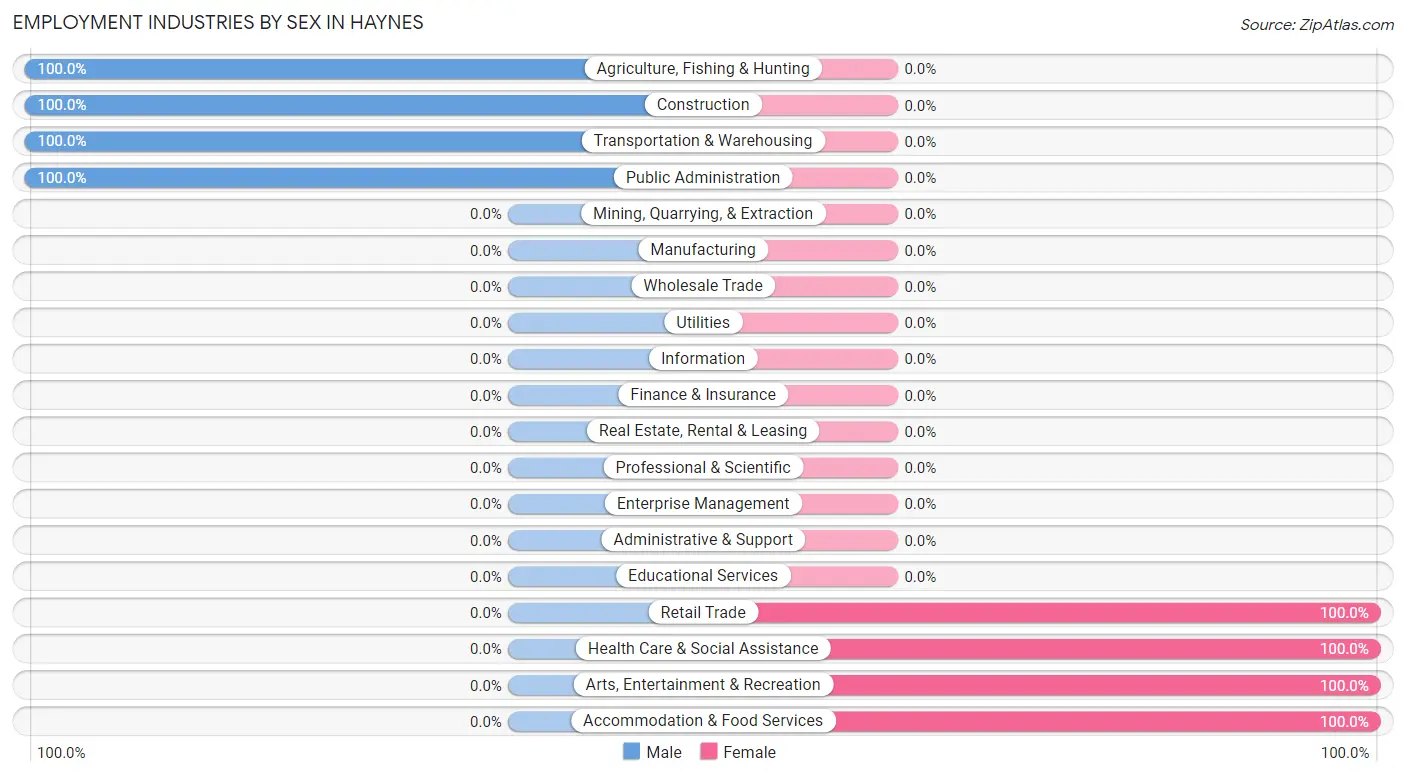
Employment Industries by Sex in Haynes
The Haynes industries that see more men than women are Agriculture, Fishing & Hunting (100.0%), Construction (100.0%), and Transportation & Warehousing (100.0%), whereas the industries that tend to have a higher number of women are Retail Trade (100.0%), Health Care & Social Assistance (100.0%), and Arts, Entertainment & Recreation (100.0%).
| Industry | Male | Female |
| Agriculture, Fishing & Hunting | 5 (100.0%) | 0 (0.0%) |
| Mining, Quarrying, & Extraction | 0 (0.0%) | 0 (0.0%) |
| Construction | 15 (100.0%) | 0 (0.0%) |
| Manufacturing | 0 (0.0%) | 0 (0.0%) |
| Wholesale Trade | 0 (0.0%) | 0 (0.0%) |
| Retail Trade | 0 (0.0%) | 1 (100.0%) |
| Transportation & Warehousing | 2 (100.0%) | 0 (0.0%) |
| Utilities | 0 (0.0%) | 0 (0.0%) |
| Information | 0 (0.0%) | 0 (0.0%) |
| Finance & Insurance | 0 (0.0%) | 0 (0.0%) |
| Real Estate, Rental & Leasing | 0 (0.0%) | 0 (0.0%) |
| Professional & Scientific | 0 (0.0%) | 0 (0.0%) |
| Enterprise Management | 0 (0.0%) | 0 (0.0%) |
| Administrative & Support | 0 (0.0%) | 0 (0.0%) |
| Educational Services | 0 (0.0%) | 0 (0.0%) |
| Health Care & Social Assistance | 0 (0.0%) | 4 (100.0%) |
| Arts, Entertainment & Recreation | 0 (0.0%) | 3 (100.0%) |
| Accommodation & Food Services | 0 (0.0%) | 2 (100.0%) |
| Public Administration | 4 (100.0%) | 0 (0.0%) |
| Total | 26 (72.2%) | 10 (27.8%) |
Education in Haynes
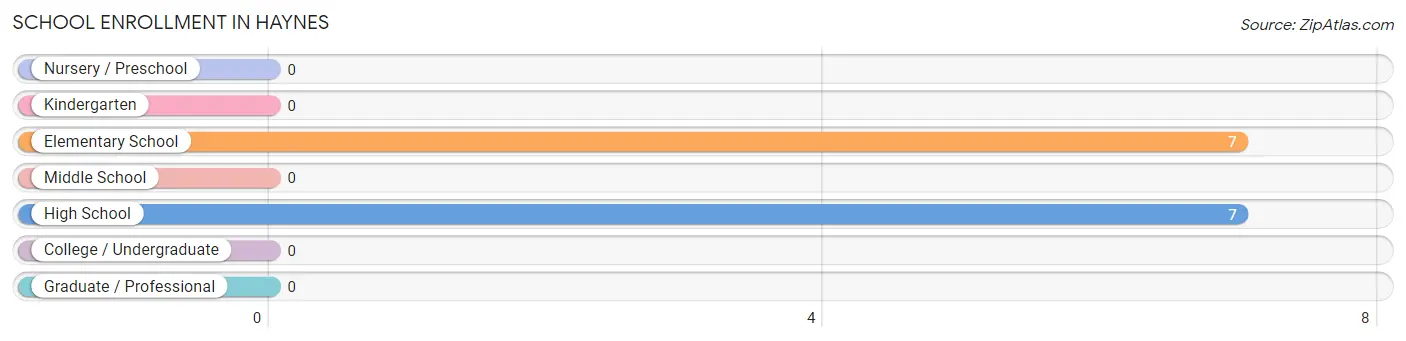
School Enrollment in Haynes
The most common levels of schooling among the 14 students in Haynes are elementary school (7 | 50.0%), and high school (7 | 50.0%).
| School Level | # Students | % Students |
| Nursery / Preschool | 0 | 0.0% |
| Kindergarten | 0 | 0.0% |
| Elementary School | 7 | 50.0% |
| Middle School | 0 | 0.0% |
| High School | 7 | 50.0% |
| College / Undergraduate | 0 | 0.0% |
| Graduate / Professional | 0 | 0.0% |
| Total | 14 | 100.0% |
School Enrollment by Age by Funding Source in Haynes
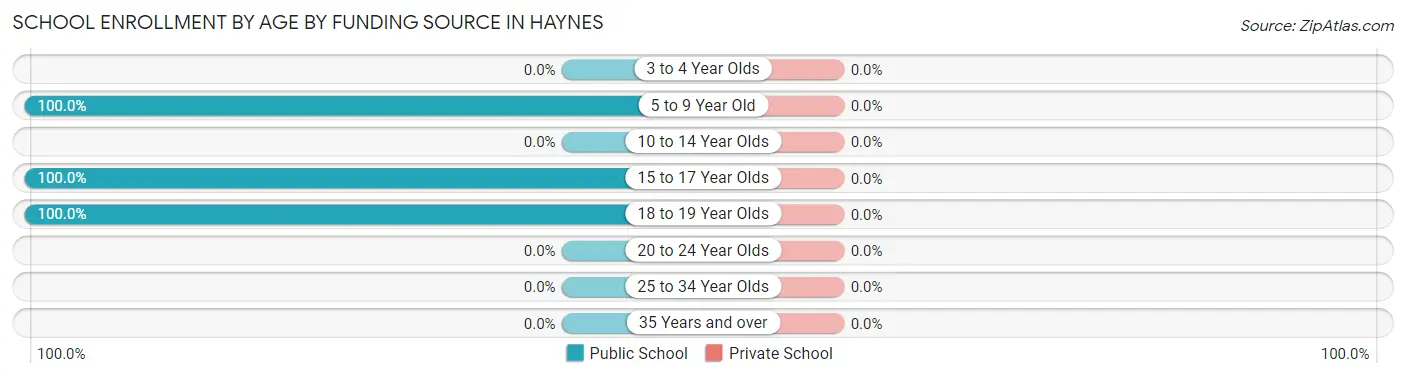
| Age Bracket | Public School | Private School |
| 3 to 4 Year Olds | 0 (0.0%) | 0 (0.0%) |
| 5 to 9 Year Old | 7 (100.0%) | 0 (0.0%) |
| 10 to 14 Year Olds | 0 (0.0%) | 0 (0.0%) |
| 15 to 17 Year Olds | 2 (100.0%) | 0 (0.0%) |
| 18 to 19 Year Olds | 5 (100.0%) | 0 (0.0%) |
| 20 to 24 Year Olds | 0 (0.0%) | 0 (0.0%) |
| 25 to 34 Year Olds | 0 (0.0%) | 0 (0.0%) |
| 35 Years and over | 0 (0.0%) | 0 (0.0%) |
| Total | 14 (100.0%) | 0 (0.0%) |
Educational Attainment by Field of Study in Haynes
, and bio, nature & agricultural (3 | 100.0%) are the most common fields of study among 3 individuals in Haynes who have obtained a bachelor's degree or higher.
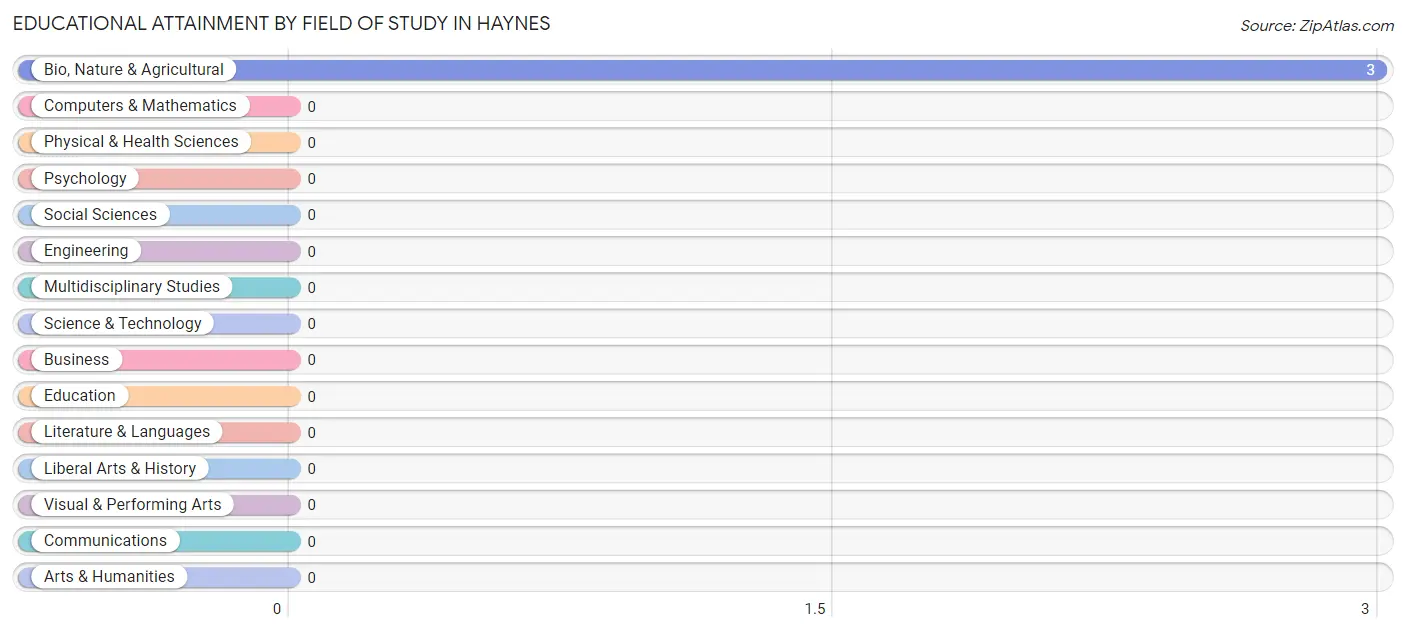
| Field of Study | # Graduates | % Graduates |
| Computers & Mathematics | 0 | 0.0% |
| Bio, Nature & Agricultural | 3 | 100.0% |
| Physical & Health Sciences | 0 | 0.0% |
| Psychology | 0 | 0.0% |
| Social Sciences | 0 | 0.0% |
| Engineering | 0 | 0.0% |
| Multidisciplinary Studies | 0 | 0.0% |
| Science & Technology | 0 | 0.0% |
| Business | 0 | 0.0% |
| Education | 0 | 0.0% |
| Literature & Languages | 0 | 0.0% |
| Liberal Arts & History | 0 | 0.0% |
| Visual & Performing Arts | 0 | 0.0% |
| Communications | 0 | 0.0% |
| Arts & Humanities | 0 | 0.0% |
| Total | 3 | 100.0% |
Transportation & Commute in Haynes
Vehicle Availability by Sex in Haynes
The most prevalent vehicle ownership categories in Haynes are males with 2 vehicles (19, accounting for 82.6%) and females with 2 vehicles (6, making up 190.0%).
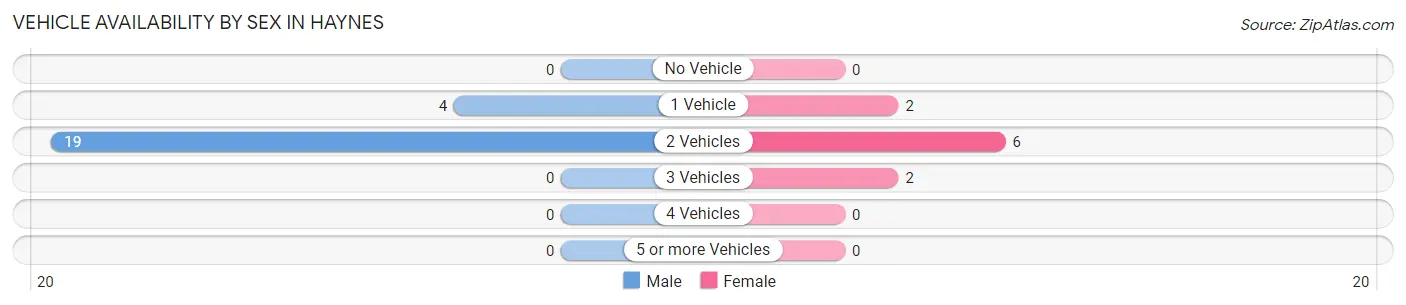
| Vehicles Available | Male | Female |
| No Vehicle | 0 (0.0%) | 0 (0.0%) |
| 1 Vehicle | 4 (17.4%) | 2 (20.0%) |
| 2 Vehicles | 19 (82.6%) | 6 (60.0%) |
| 3 Vehicles | 0 (0.0%) | 2 (20.0%) |
| 4 Vehicles | 0 (0.0%) | 0 (0.0%) |
| 5 or more Vehicles | 0 (0.0%) | 0 (0.0%) |
| Total | 23 (100.0%) | 10 (100.0%) |
Commute Time in Haynes
The most frequently occuring commute durations in Haynes are 45 to 59 minutes (11 commuters, 33.3%), 15 to 19 minutes (9 commuters, 27.3%), and 10 to 14 minutes (5 commuters, 15.1%).
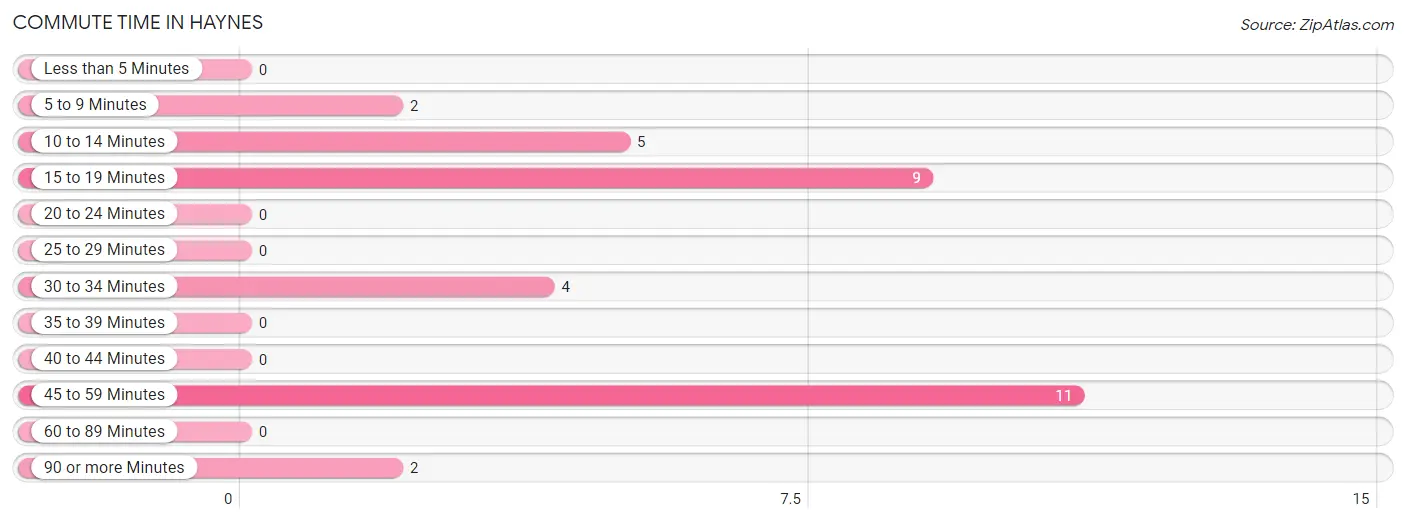
| Commute Time | # Commuters | % Commuters |
| Less than 5 Minutes | 0 | 0.0% |
| 5 to 9 Minutes | 2 | 6.1% |
| 10 to 14 Minutes | 5 | 15.1% |
| 15 to 19 Minutes | 9 | 27.3% |
| 20 to 24 Minutes | 0 | 0.0% |
| 25 to 29 Minutes | 0 | 0.0% |
| 30 to 34 Minutes | 4 | 12.1% |
| 35 to 39 Minutes | 0 | 0.0% |
| 40 to 44 Minutes | 0 | 0.0% |
| 45 to 59 Minutes | 11 | 33.3% |
| 60 to 89 Minutes | 0 | 0.0% |
| 90 or more Minutes | 2 | 6.1% |
Commute Time by Sex in Haynes
The most common commute times in Haynes are 45 to 59 minutes (11 commuters, 47.8%) for males and 10 to 14 minutes (5 commuters, 50.0%) for females.
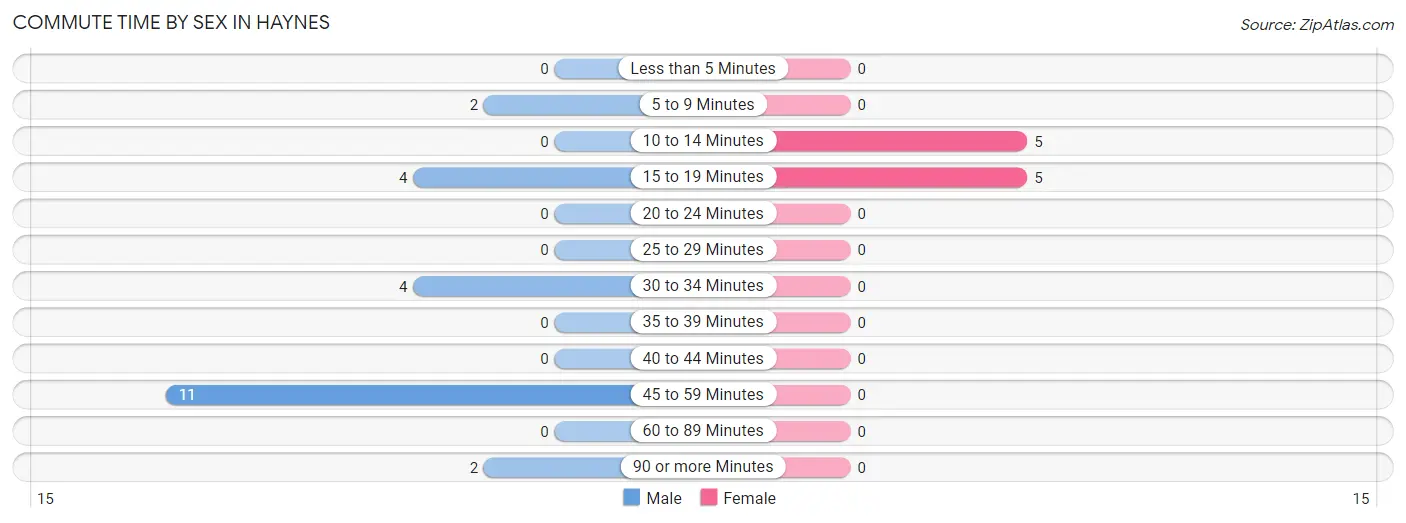
| Commute Time | Male | Female |
| Less than 5 Minutes | 0 (0.0%) | 0 (0.0%) |
| 5 to 9 Minutes | 2 (8.7%) | 0 (0.0%) |
| 10 to 14 Minutes | 0 (0.0%) | 5 (50.0%) |
| 15 to 19 Minutes | 4 (17.4%) | 5 (50.0%) |
| 20 to 24 Minutes | 0 (0.0%) | 0 (0.0%) |
| 25 to 29 Minutes | 0 (0.0%) | 0 (0.0%) |
| 30 to 34 Minutes | 4 (17.4%) | 0 (0.0%) |
| 35 to 39 Minutes | 0 (0.0%) | 0 (0.0%) |
| 40 to 44 Minutes | 0 (0.0%) | 0 (0.0%) |
| 45 to 59 Minutes | 11 (47.8%) | 0 (0.0%) |
| 60 to 89 Minutes | 0 (0.0%) | 0 (0.0%) |
| 90 or more Minutes | 2 (8.7%) | 0 (0.0%) |
Time of Departure to Work by Sex in Haynes
The most frequent times of departure to work in Haynes are 6:00 AM to 6:29 AM (15, 65.2%) for males and 10:00 AM to 10:59 AM (3, 30.0%) for females.
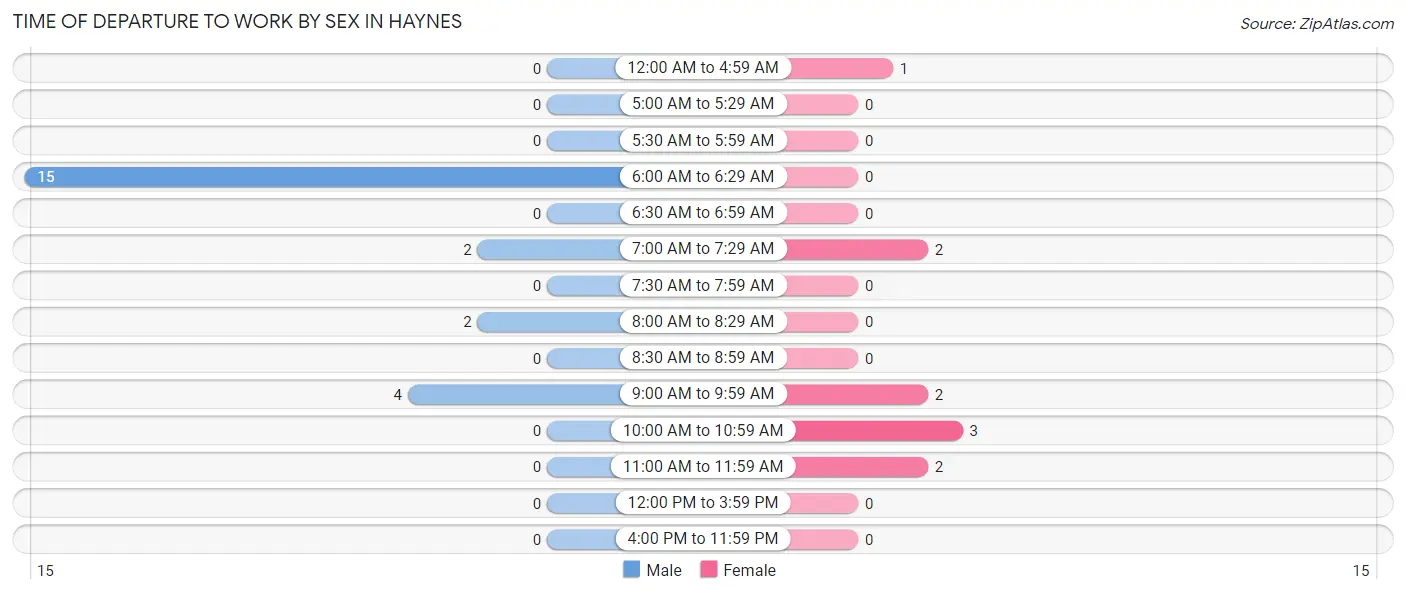
| Time of Departure | Male | Female |
| 12:00 AM to 4:59 AM | 0 (0.0%) | 1 (10.0%) |
| 5:00 AM to 5:29 AM | 0 (0.0%) | 0 (0.0%) |
| 5:30 AM to 5:59 AM | 0 (0.0%) | 0 (0.0%) |
| 6:00 AM to 6:29 AM | 15 (65.2%) | 0 (0.0%) |
| 6:30 AM to 6:59 AM | 0 (0.0%) | 0 (0.0%) |
| 7:00 AM to 7:29 AM | 2 (8.7%) | 2 (20.0%) |
| 7:30 AM to 7:59 AM | 0 (0.0%) | 0 (0.0%) |
| 8:00 AM to 8:29 AM | 2 (8.7%) | 0 (0.0%) |
| 8:30 AM to 8:59 AM | 0 (0.0%) | 0 (0.0%) |
| 9:00 AM to 9:59 AM | 4 (17.4%) | 2 (20.0%) |
| 10:00 AM to 10:59 AM | 0 (0.0%) | 3 (30.0%) |
| 11:00 AM to 11:59 AM | 0 (0.0%) | 2 (20.0%) |
| 12:00 PM to 3:59 PM | 0 (0.0%) | 0 (0.0%) |
| 4:00 PM to 11:59 PM | 0 (0.0%) | 0 (0.0%) |
| Total | 23 (100.0%) | 10 (100.0%) |
Housing Occupancy in Haynes
Occupancy by Ownership in Haynes
Of the total 38 dwellings in Haynes, owner-occupied units account for 30 (78.9%), while renter-occupied units make up 8 (21.0%).
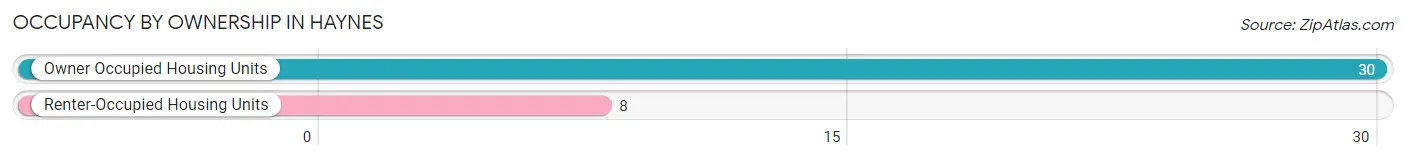
| Occupancy | # Housing Units | % Housing Units |
| Owner Occupied Housing Units | 30 | 78.9% |
| Renter-Occupied Housing Units | 8 | 21.0% |
| Total Occupied Housing Units | 38 | 100.0% |
Occupancy by Household Size in Haynes
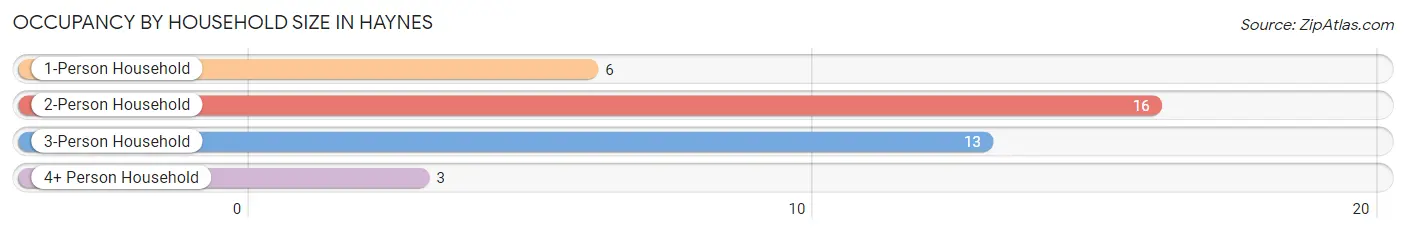
| Household Size | # Housing Units | % Housing Units |
| 1-Person Household | 6 | 15.8% |
| 2-Person Household | 16 | 42.1% |
| 3-Person Household | 13 | 34.2% |
| 4+ Person Household | 3 | 7.9% |
| Total Housing Units | 38 | 100.0% |
Occupancy by Ownership by Household Size in Haynes
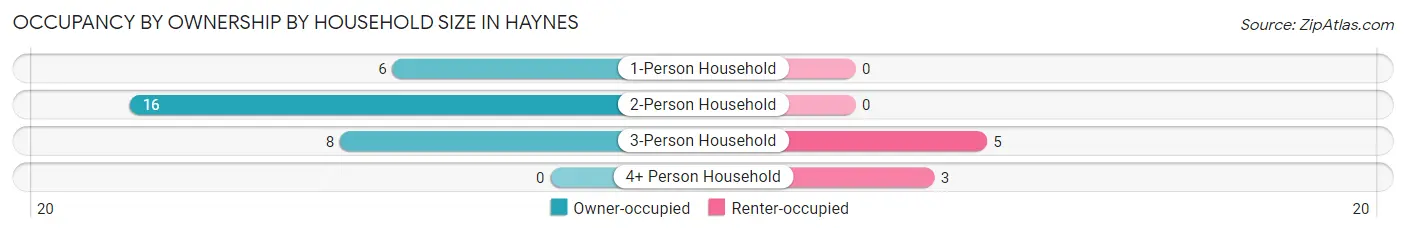
| Household Size | Owner-occupied | Renter-occupied |
| 1-Person Household | 6 (100.0%) | 0 (0.0%) |
| 2-Person Household | 16 (100.0%) | 0 (0.0%) |
| 3-Person Household | 8 (61.5%) | 5 (38.5%) |
| 4+ Person Household | 0 (0.0%) | 3 (100.0%) |
| Total Housing Units | 30 (78.9%) | 8 (21.0%) |
Occupancy by Educational Attainment in Haynes
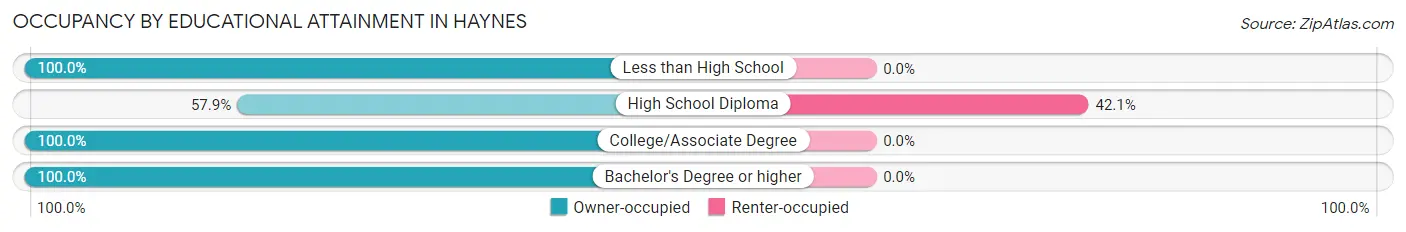
| Household Size | Owner-occupied | Renter-occupied |
| Less than High School | 5 (100.0%) | 0 (0.0%) |
| High School Diploma | 11 (57.9%) | 8 (42.1%) |
| College/Associate Degree | 11 (100.0%) | 0 (0.0%) |
| Bachelor's Degree or higher | 3 (100.0%) | 0 (0.0%) |
Occupancy by Age of Householder in Haynes
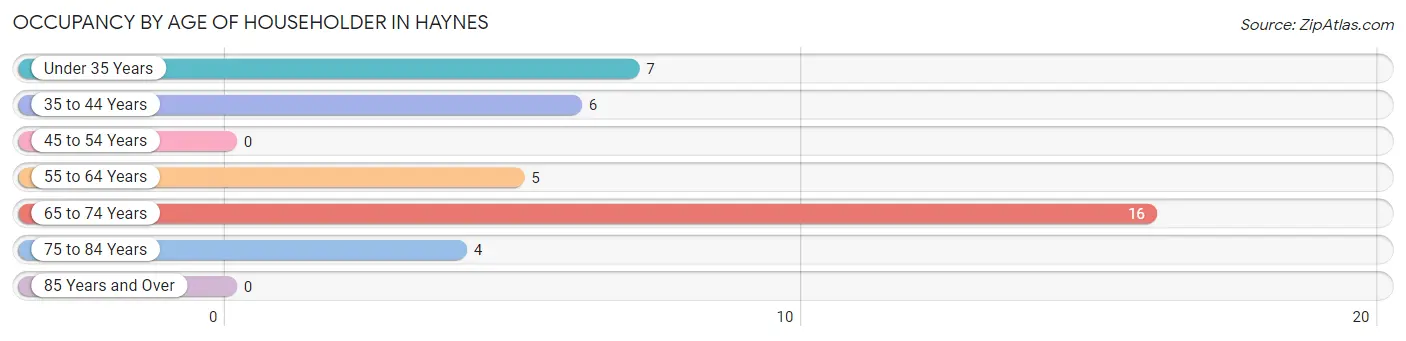
| Age Bracket | # Households | % Households |
| Under 35 Years | 7 | 18.4% |
| 35 to 44 Years | 6 | 15.8% |
| 45 to 54 Years | 0 | 0.0% |
| 55 to 64 Years | 5 | 13.2% |
| 65 to 74 Years | 16 | 42.1% |
| 75 to 84 Years | 4 | 10.5% |
| 85 Years and Over | 0 | 0.0% |
| Total | 38 | 100.0% |
Housing Finances in Haynes
Median Income by Occupancy in Haynes
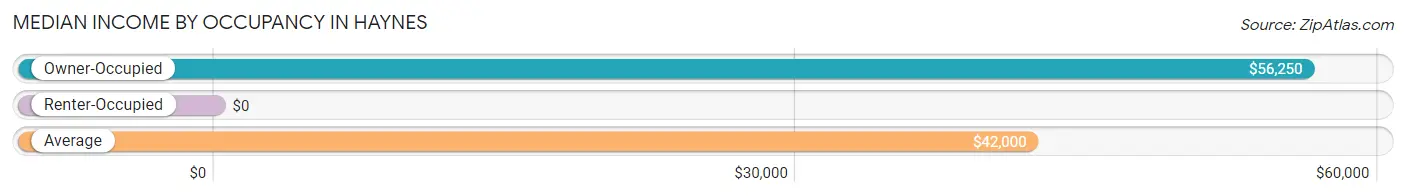
| Occupancy Type | # Households | Median Income |
| Owner-Occupied | 30 (78.9%) | $56,250 |
| Renter-Occupied | 8 (21.0%) | $0 |
| Average | 38 (100.0%) | $42,000 |
Occupancy by Householder Income Bracket in Haynes
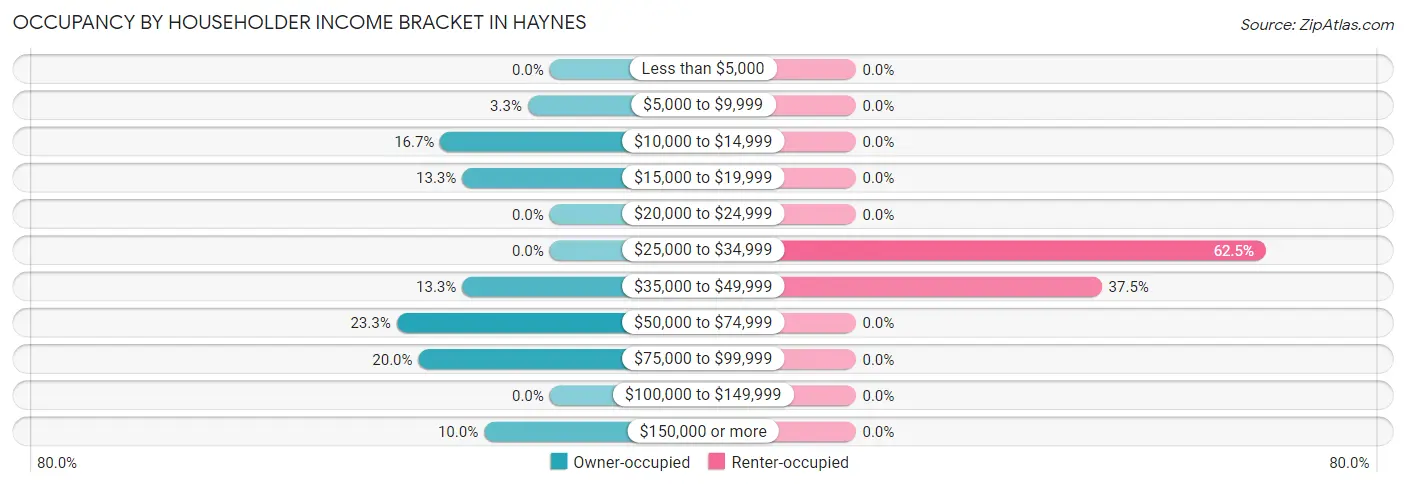
| Income Bracket | Owner-occupied | Renter-occupied |
| Less than $5,000 | 0 (0.0%) | 0 (0.0%) |
| $5,000 to $9,999 | 1 (3.3%) | 0 (0.0%) |
| $10,000 to $14,999 | 5 (16.7%) | 0 (0.0%) |
| $15,000 to $19,999 | 4 (13.3%) | 0 (0.0%) |
| $20,000 to $24,999 | 0 (0.0%) | 0 (0.0%) |
| $25,000 to $34,999 | 0 (0.0%) | 5 (62.5%) |
| $35,000 to $49,999 | 4 (13.3%) | 3 (37.5%) |
| $50,000 to $74,999 | 7 (23.3%) | 0 (0.0%) |
| $75,000 to $99,999 | 6 (20.0%) | 0 (0.0%) |
| $100,000 to $149,999 | 0 (0.0%) | 0 (0.0%) |
| $150,000 or more | 3 (10.0%) | 0 (0.0%) |
| Total | 30 (100.0%) | 8 (100.0%) |
Monthly Housing Cost Tiers in Haynes
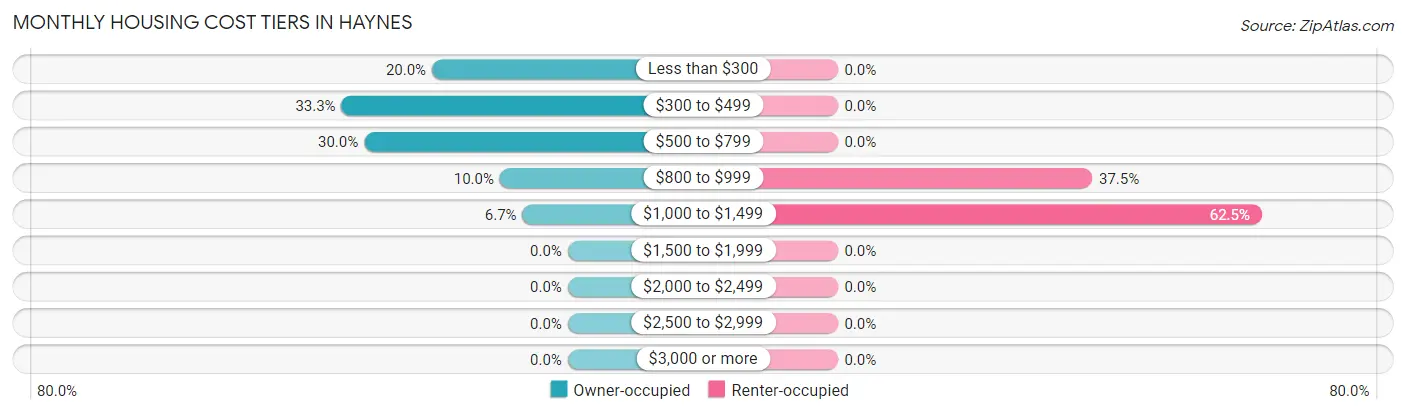
| Monthly Cost | Owner-occupied | Renter-occupied |
| Less than $300 | 6 (20.0%) | 0 (0.0%) |
| $300 to $499 | 10 (33.3%) | 0 (0.0%) |
| $500 to $799 | 9 (30.0%) | 0 (0.0%) |
| $800 to $999 | 3 (10.0%) | 3 (37.5%) |
| $1,000 to $1,499 | 2 (6.7%) | 5 (62.5%) |
| $1,500 to $1,999 | 0 (0.0%) | 0 (0.0%) |
| $2,000 to $2,499 | 0 (0.0%) | 0 (0.0%) |
| $2,500 to $2,999 | 0 (0.0%) | 0 (0.0%) |
| $3,000 or more | 0 (0.0%) | 0 (0.0%) |
| Total | 30 (100.0%) | 8 (100.0%) |
Physical Housing Characteristics in Haynes
Housing Structures in Haynes
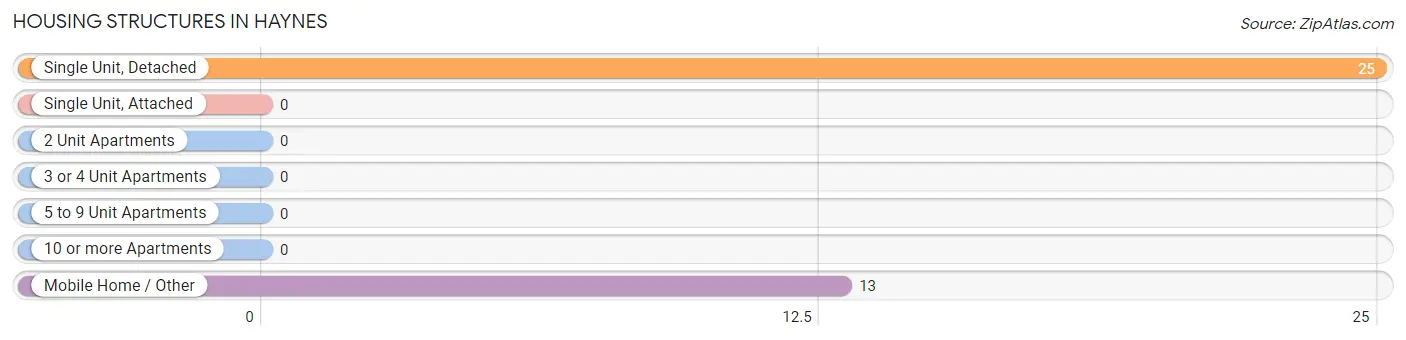
| Structure Type | # Housing Units | % Housing Units |
| Single Unit, Detached | 25 | 65.8% |
| Single Unit, Attached | 0 | 0.0% |
| 2 Unit Apartments | 0 | 0.0% |
| 3 or 4 Unit Apartments | 0 | 0.0% |
| 5 to 9 Unit Apartments | 0 | 0.0% |
| 10 or more Apartments | 0 | 0.0% |
| Mobile Home / Other | 13 | 34.2% |
| Total | 38 | 100.0% |
Housing Structures by Occupancy in Haynes
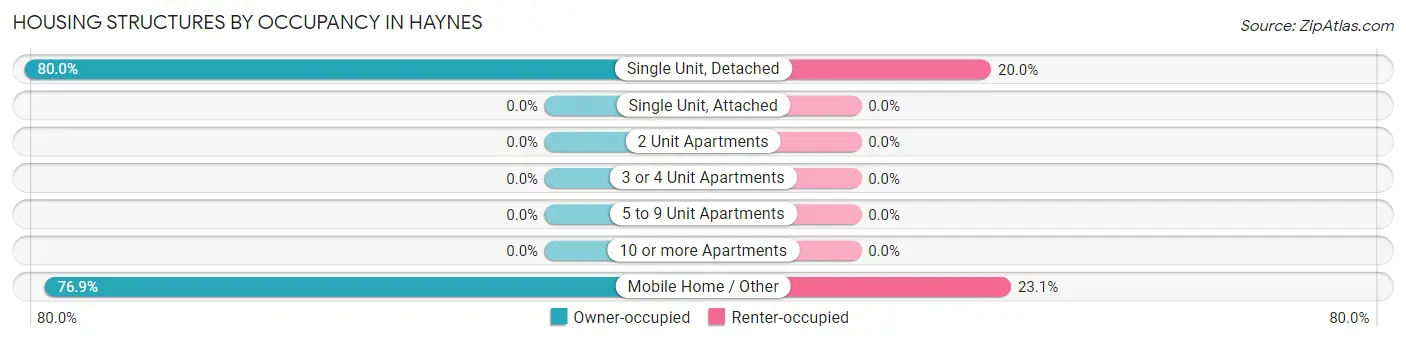
| Structure Type | Owner-occupied | Renter-occupied |
| Single Unit, Detached | 20 (80.0%) | 5 (20.0%) |
| Single Unit, Attached | 0 (0.0%) | 0 (0.0%) |
| 2 Unit Apartments | 0 (0.0%) | 0 (0.0%) |
| 3 or 4 Unit Apartments | 0 (0.0%) | 0 (0.0%) |
| 5 to 9 Unit Apartments | 0 (0.0%) | 0 (0.0%) |
| 10 or more Apartments | 0 (0.0%) | 0 (0.0%) |
| Mobile Home / Other | 10 (76.9%) | 3 (23.1%) |
| Total | 30 (78.9%) | 8 (21.0%) |
Housing Structures by Number of Rooms in Haynes
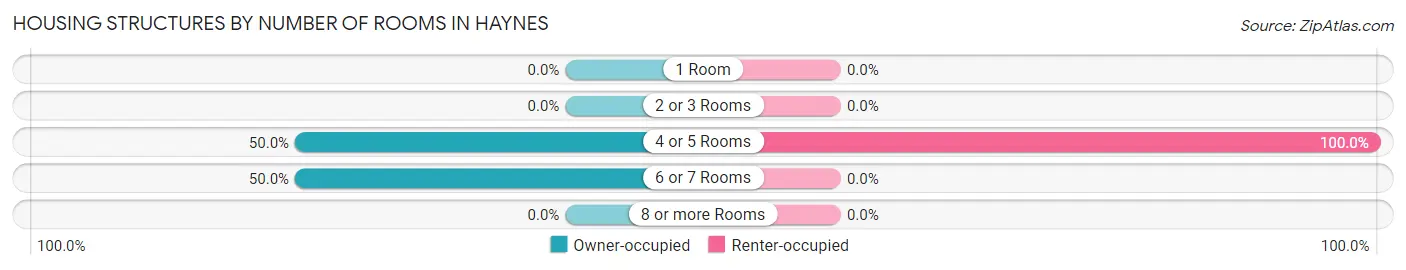
| Number of Rooms | Owner-occupied | Renter-occupied |
| 1 Room | 0 (0.0%) | 0 (0.0%) |
| 2 or 3 Rooms | 0 (0.0%) | 0 (0.0%) |
| 4 or 5 Rooms | 15 (50.0%) | 8 (100.0%) |
| 6 or 7 Rooms | 15 (50.0%) | 0 (0.0%) |
| 8 or more Rooms | 0 (0.0%) | 0 (0.0%) |
| Total | 30 (100.0%) | 8 (100.0%) |
Housing Structure by Heating Type in Haynes
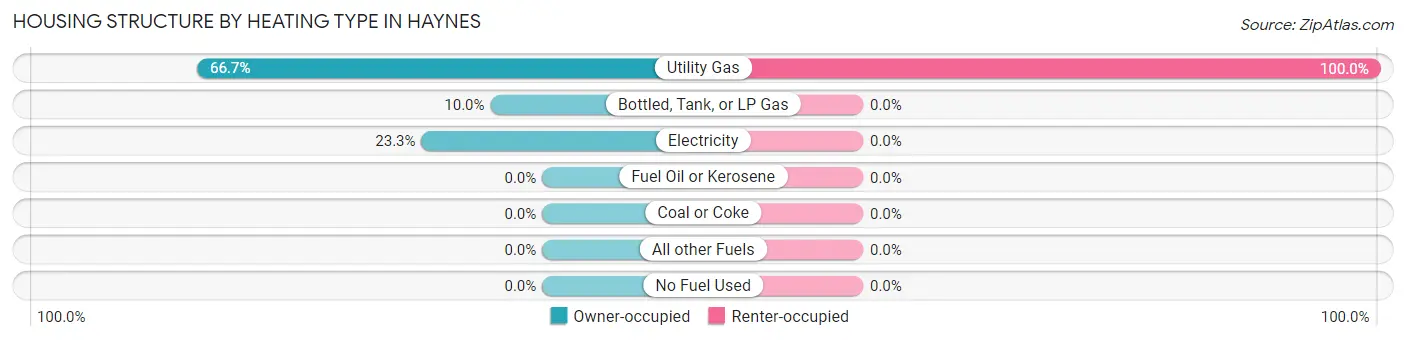
| Heating Type | Owner-occupied | Renter-occupied |
| Utility Gas | 20 (66.7%) | 8 (100.0%) |
| Bottled, Tank, or LP Gas | 3 (10.0%) | 0 (0.0%) |
| Electricity | 7 (23.3%) | 0 (0.0%) |
| Fuel Oil or Kerosene | 0 (0.0%) | 0 (0.0%) |
| Coal or Coke | 0 (0.0%) | 0 (0.0%) |
| All other Fuels | 0 (0.0%) | 0 (0.0%) |
| No Fuel Used | 0 (0.0%) | 0 (0.0%) |
| Total | 30 (100.0%) | 8 (100.0%) |
Household Vehicle Usage in Haynes
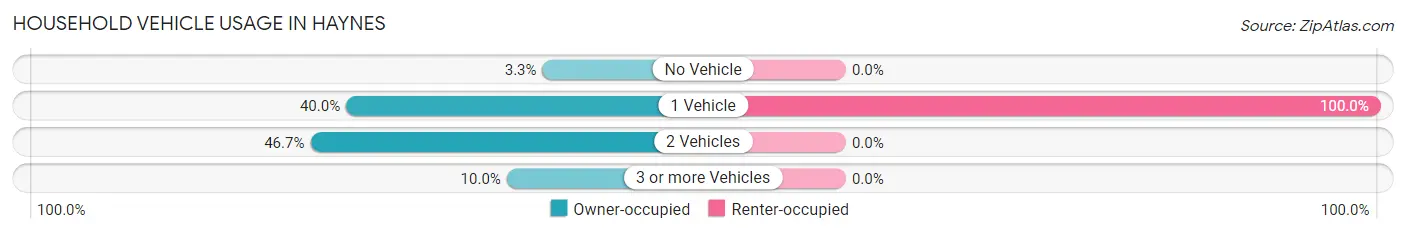
| Vehicles per Household | Owner-occupied | Renter-occupied |
| No Vehicle | 1 (3.3%) | 0 (0.0%) |
| 1 Vehicle | 12 (40.0%) | 8 (100.0%) |
| 2 Vehicles | 14 (46.7%) | 0 (0.0%) |
| 3 or more Vehicles | 3 (10.0%) | 0 (0.0%) |
| Total | 30 (100.0%) | 8 (100.0%) |
Real Estate & Mortgages in Haynes
Real Estate and Mortgage Overview in Haynes
| Characteristic | Without Mortgage | With Mortgage |
| Housing Units | 25 | 5 |
| Median Property Value | $58,300 | $0 |
| Median Household Income | $48,125 | $0 |
| Monthly Housing Costs | $388 | $0 |
| Real Estate Taxes | - | - |
Property Value by Mortgage Status in Haynes
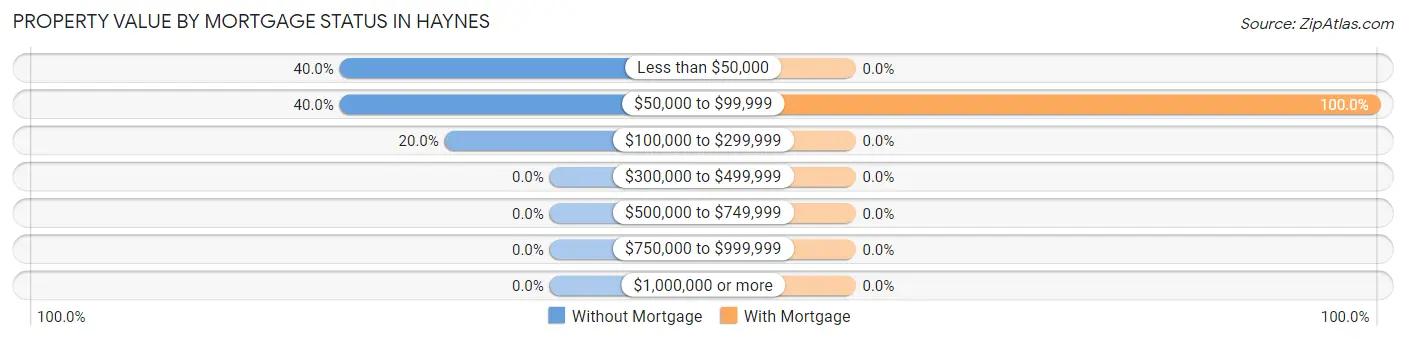
| Property Value | Without Mortgage | With Mortgage |
| Less than $50,000 | 10 (40.0%) | 0 (0.0%) |
| $50,000 to $99,999 | 10 (40.0%) | 5 (100.0%) |
| $100,000 to $299,999 | 5 (20.0%) | 0 (0.0%) |
| $300,000 to $499,999 | 0 (0.0%) | 0 (0.0%) |
| $500,000 to $749,999 | 0 (0.0%) | 0 (0.0%) |
| $750,000 to $999,999 | 0 (0.0%) | 0 (0.0%) |
| $1,000,000 or more | 0 (0.0%) | 0 (0.0%) |
| Total | 25 (100.0%) | 5 (100.0%) |
Household Income by Mortgage Status in Haynes
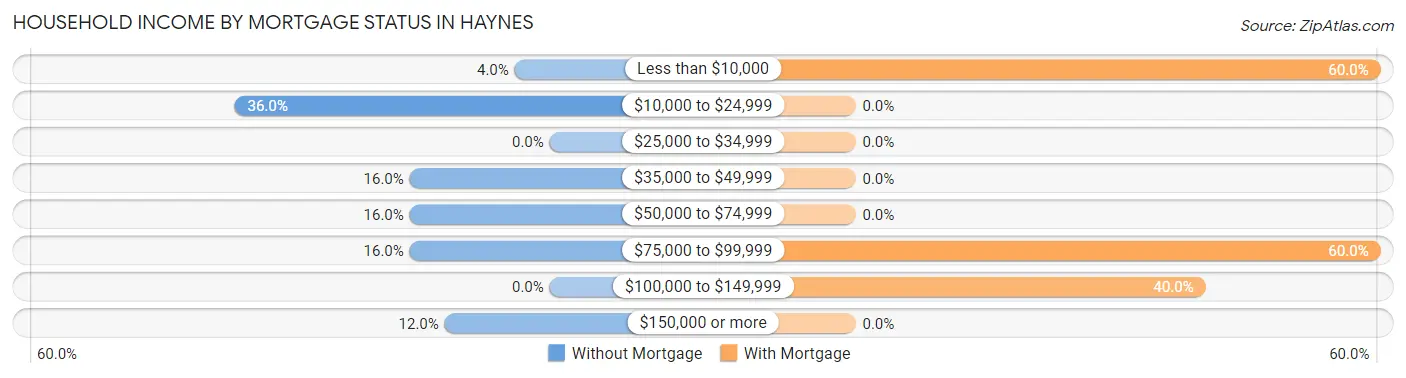
| Household Income | Without Mortgage | With Mortgage |
| Less than $10,000 | 1 (4.0%) | 3 (60.0%) |
| $10,000 to $24,999 | 9 (36.0%) | 0 (0.0%) |
| $25,000 to $34,999 | 0 (0.0%) | 0 (0.0%) |
| $35,000 to $49,999 | 4 (16.0%) | 0 (0.0%) |
| $50,000 to $74,999 | 4 (16.0%) | 0 (0.0%) |
| $75,000 to $99,999 | 4 (16.0%) | 3 (60.0%) |
| $100,000 to $149,999 | 0 (0.0%) | 2 (40.0%) |
| $150,000 or more | 3 (12.0%) | 0 (0.0%) |
| Total | 25 (100.0%) | 5 (100.0%) |
Property Value to Household Income Ratio in Haynes
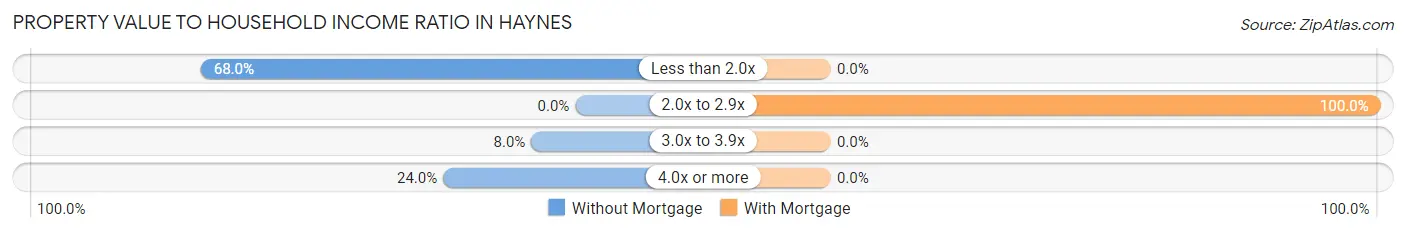
| Value-to-Income Ratio | Without Mortgage | With Mortgage |
| Less than 2.0x | 17 (68.0%) | 0 (0.0%) |
| 2.0x to 2.9x | 0 (0.0%) | 5 (100.0%) |
| 3.0x to 3.9x | 2 (8.0%) | 0 (0.0%) |
| 4.0x or more | 6 (24.0%) | 0 (0.0%) |
| Total | 25 (100.0%) | 5 (100.0%) |
Real Estate Taxes by Mortgage Status in Haynes
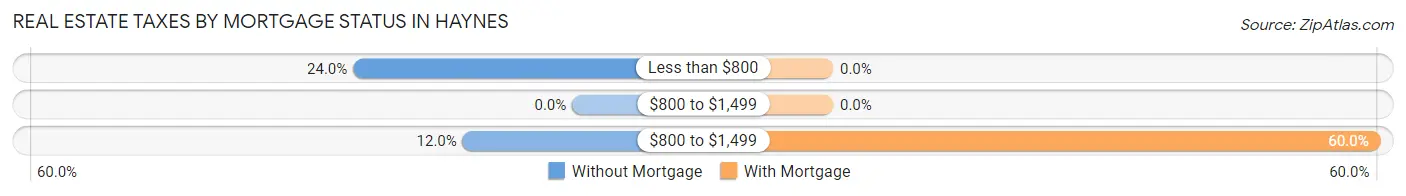
| Property Taxes | Without Mortgage | With Mortgage |
| Less than $800 | 6 (24.0%) | 0 (0.0%) |
| $800 to $1,499 | 0 (0.0%) | 0 (0.0%) |
| $800 to $1,499 | 3 (12.0%) | 3 (60.0%) |
| Total | 25 (100.0%) | 5 (100.0%) |
Health & Disability in Haynes
Health Insurance Coverage by Age in Haynes
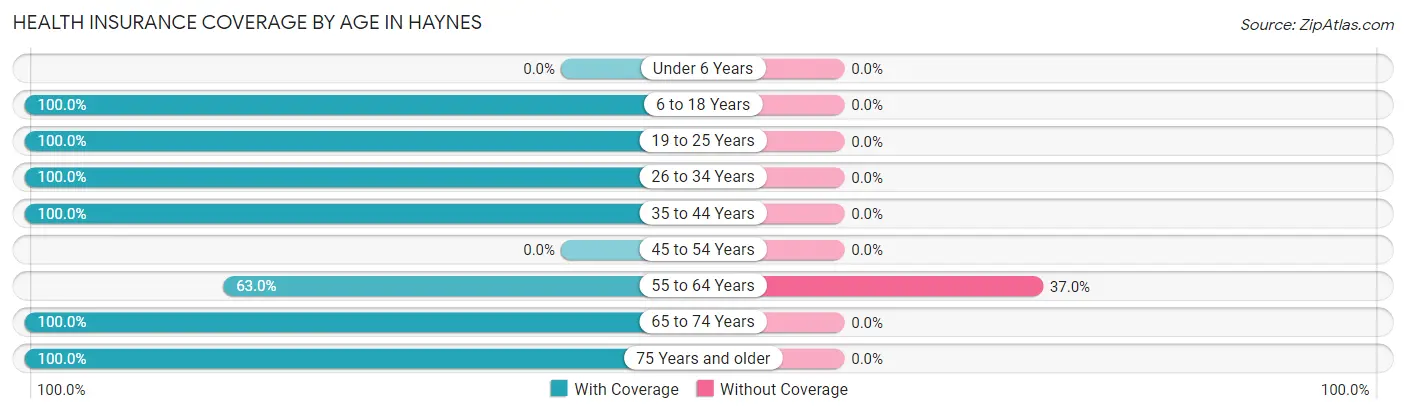
| Age Bracket | With Coverage | Without Coverage |
| Under 6 Years | 0 (0.0%) | 0 (0.0%) |
| 6 to 18 Years | 14 (100.0%) | 0 (0.0%) |
| 19 to 25 Years | 9 (100.0%) | 0 (0.0%) |
| 26 to 34 Years | 7 (100.0%) | 0 (0.0%) |
| 35 to 44 Years | 27 (100.0%) | 0 (0.0%) |
| 45 to 54 Years | 0 (0.0%) | 0 (0.0%) |
| 55 to 64 Years | 17 (63.0%) | 10 (37.0%) |
| 65 to 74 Years | 25 (100.0%) | 0 (0.0%) |
| 75 Years and older | 4 (100.0%) | 0 (0.0%) |
| Total | 103 (91.1%) | 10 (8.8%) |
Health Insurance Coverage by Citizenship Status in Haynes
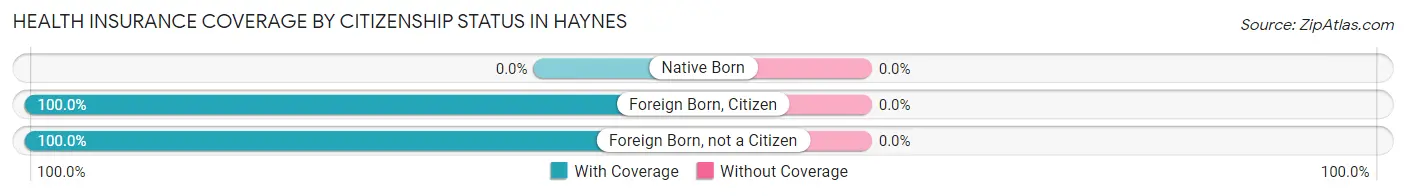
| Citizenship Status | With Coverage | Without Coverage |
| Native Born | 0 (0.0%) | 0 (0.0%) |
| Foreign Born, Citizen | 14 (100.0%) | 0 (0.0%) |
| Foreign Born, not a Citizen | 9 (100.0%) | 0 (0.0%) |
Health Insurance Coverage by Household Income in Haynes
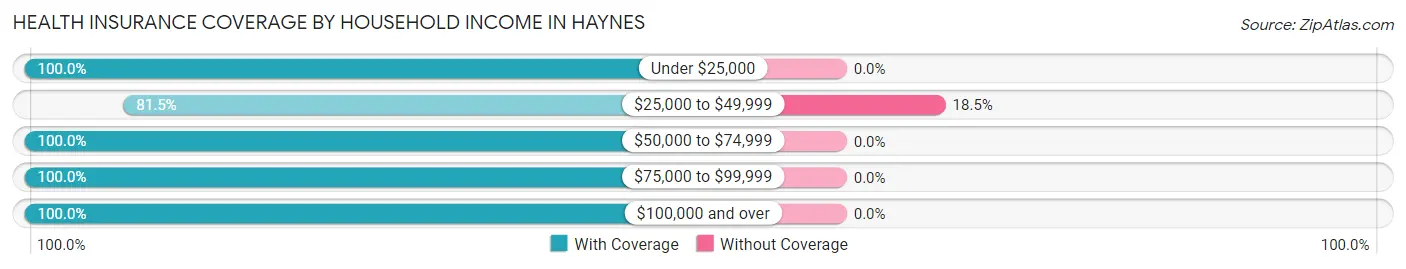
| Household Income | With Coverage | Without Coverage |
| Under $25,000 | 12 (100.0%) | 0 (0.0%) |
| $25,000 to $49,999 | 44 (81.5%) | 10 (18.5%) |
| $50,000 to $74,999 | 13 (100.0%) | 0 (0.0%) |
| $75,000 to $99,999 | 29 (100.0%) | 0 (0.0%) |
| $100,000 and over | 5 (100.0%) | 0 (0.0%) |
Public vs Private Health Insurance Coverage by Age in Haynes
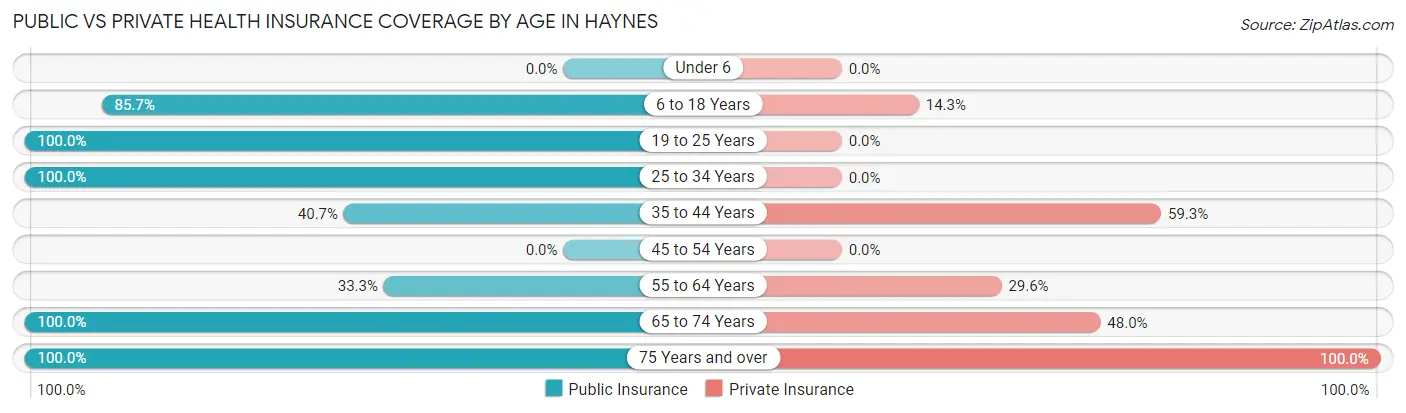
| Age Bracket | Public Insurance | Private Insurance |
| Under 6 | 0 (0.0%) | 0 (0.0%) |
| 6 to 18 Years | 12 (85.7%) | 2 (14.3%) |
| 19 to 25 Years | 9 (100.0%) | 0 (0.0%) |
| 25 to 34 Years | 7 (100.0%) | 0 (0.0%) |
| 35 to 44 Years | 11 (40.7%) | 16 (59.3%) |
| 45 to 54 Years | 0 (0.0%) | 0 (0.0%) |
| 55 to 64 Years | 9 (33.3%) | 8 (29.6%) |
| 65 to 74 Years | 25 (100.0%) | 12 (48.0%) |
| 75 Years and over | 4 (100.0%) | 4 (100.0%) |
| Total | 77 (68.1%) | 42 (37.2%) |
Disability Status by Sex by Age in Haynes
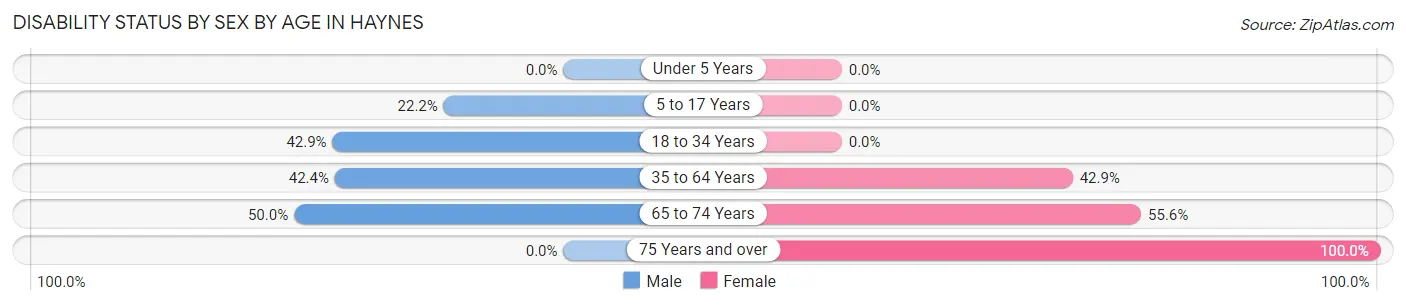
| Age Bracket | Male | Female |
| Under 5 Years | 0 (0.0%) | 0 (0.0%) |
| 5 to 17 Years | 2 (22.2%) | 0 (0.0%) |
| 18 to 34 Years | 9 (42.9%) | 0 (0.0%) |
| 35 to 64 Years | 14 (42.4%) | 9 (42.9%) |
| 65 to 74 Years | 8 (50.0%) | 5 (55.6%) |
| 75 Years and over | 0 (0.0%) | 4 (100.0%) |
Disability Class by Sex by Age in Haynes
Disability Class: Hearing Difficulty
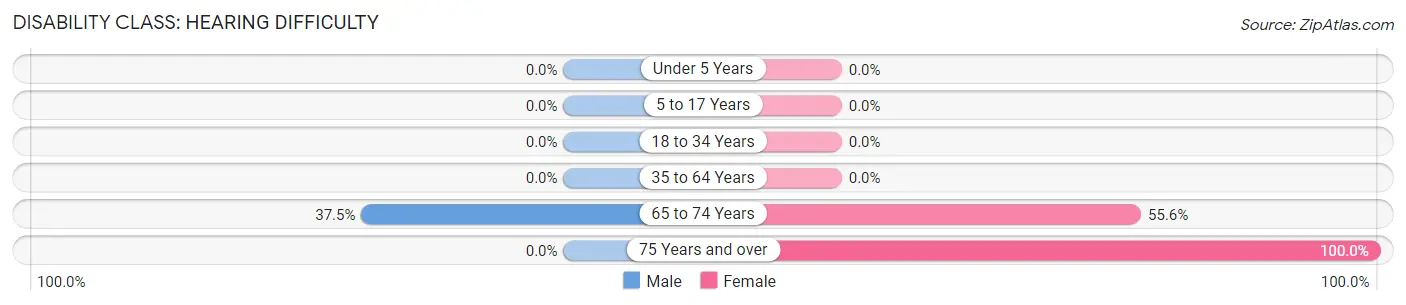
| Age Bracket | Male | Female |
| Under 5 Years | 0 (0.0%) | 0 (0.0%) |
| 5 to 17 Years | 0 (0.0%) | 0 (0.0%) |
| 18 to 34 Years | 0 (0.0%) | 0 (0.0%) |
| 35 to 64 Years | 0 (0.0%) | 0 (0.0%) |
| 65 to 74 Years | 6 (37.5%) | 5 (55.6%) |
| 75 Years and over | 0 (0.0%) | 4 (100.0%) |
Disability Class: Vision Difficulty
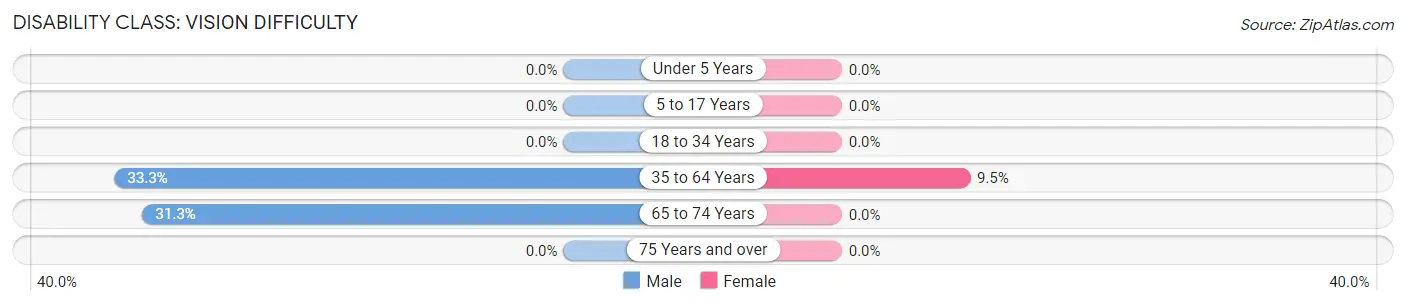
| Age Bracket | Male | Female |
| Under 5 Years | 0 (0.0%) | 0 (0.0%) |
| 5 to 17 Years | 0 (0.0%) | 0 (0.0%) |
| 18 to 34 Years | 0 (0.0%) | 0 (0.0%) |
| 35 to 64 Years | 11 (33.3%) | 2 (9.5%) |
| 65 to 74 Years | 5 (31.2%) | 0 (0.0%) |
| 75 Years and over | 0 (0.0%) | 0 (0.0%) |
Disability Class: Cognitive Difficulty
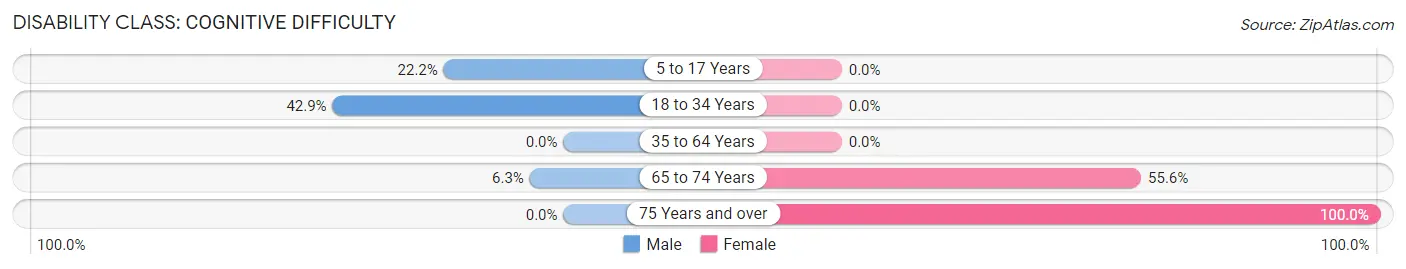
| Age Bracket | Male | Female |
| 5 to 17 Years | 2 (22.2%) | 0 (0.0%) |
| 18 to 34 Years | 9 (42.9%) | 0 (0.0%) |
| 35 to 64 Years | 0 (0.0%) | 0 (0.0%) |
| 65 to 74 Years | 1 (6.2%) | 5 (55.6%) |
| 75 Years and over | 0 (0.0%) | 4 (100.0%) |
Disability Class: Ambulatory Difficulty
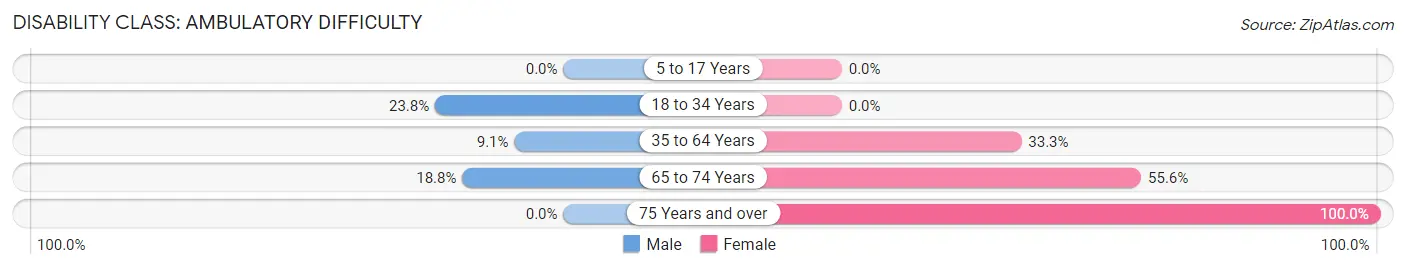
| Age Bracket | Male | Female |
| 5 to 17 Years | 0 (0.0%) | 0 (0.0%) |
| 18 to 34 Years | 5 (23.8%) | 0 (0.0%) |
| 35 to 64 Years | 3 (9.1%) | 7 (33.3%) |
| 65 to 74 Years | 3 (18.8%) | 5 (55.6%) |
| 75 Years and over | 0 (0.0%) | 4 (100.0%) |
Disability Class: Self-Care Difficulty
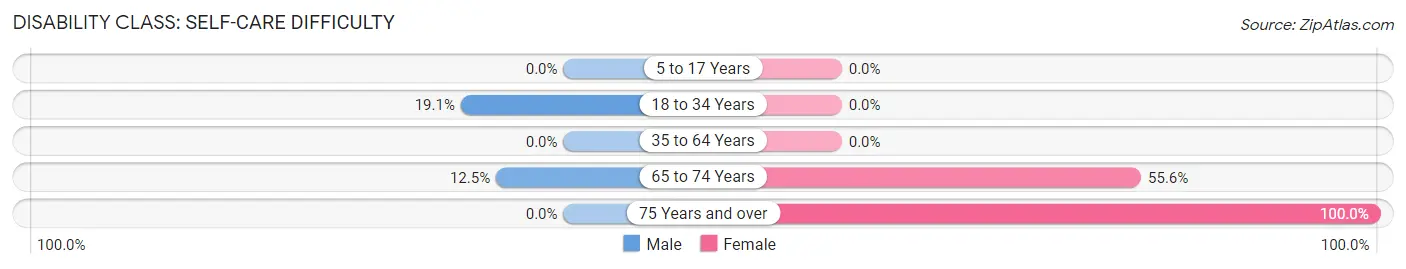
| Age Bracket | Male | Female |
| 5 to 17 Years | 0 (0.0%) | 0 (0.0%) |
| 18 to 34 Years | 4 (19.1%) | 0 (0.0%) |
| 35 to 64 Years | 0 (0.0%) | 0 (0.0%) |
| 65 to 74 Years | 2 (12.5%) | 5 (55.6%) |
| 75 Years and over | 0 (0.0%) | 4 (100.0%) |
Technology Access in Haynes
Computing Device Access in Haynes
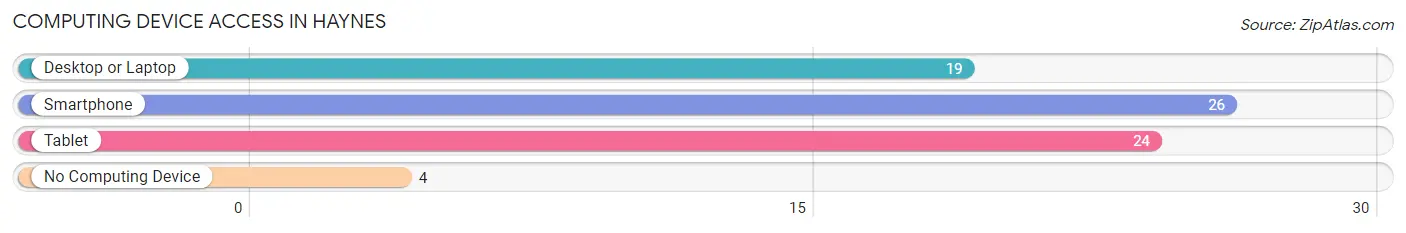
| Device Type | # Households | % Households |
| Desktop or Laptop | 19 | 50.0% |
| Smartphone | 26 | 68.4% |
| Tablet | 24 | 63.2% |
| No Computing Device | 4 | 10.5% |
| Total | 38 | 100.0% |
Internet Access in Haynes
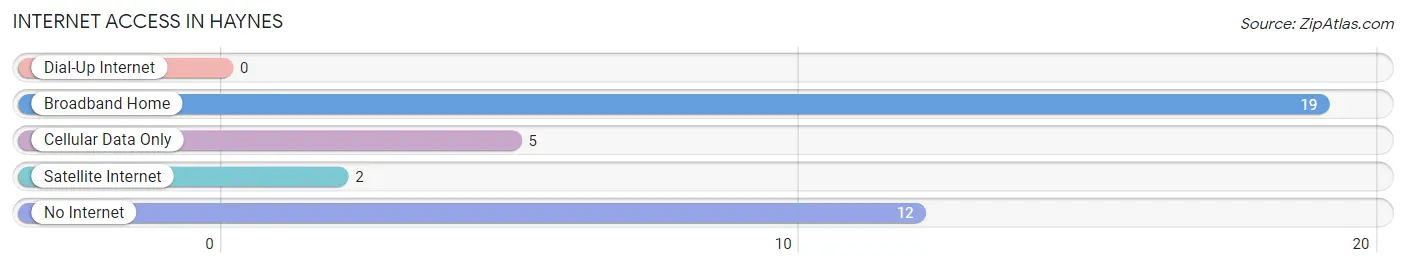
| Internet Type | # Households | % Households |
| Dial-Up Internet | 0 | 0.0% |
| Broadband Home | 19 | 50.0% |
| Cellular Data Only | 5 | 13.2% |
| Satellite Internet | 2 | 5.3% |
| No Internet | 12 | 31.6% |
| Total | 38 | 100.0% |
Haynes Summary
Haynes, Arkansas is a small town located in the northwest corner of the state, near the Oklahoma border. It is part of the Fort Smith metropolitan area and is situated in the Arkansas River Valley. The town was founded in 1883 and has a population of approximately 1,000 people.
Geography
Haynes is located in the northwest corner of Arkansas, near the Oklahoma border. It is situated in the Arkansas River Valley, which is part of the Ozark Mountains. The town is located on the banks of the Arkansas River, which provides a natural border between Arkansas and Oklahoma. The town is surrounded by rolling hills and forests, and is home to a variety of wildlife.
The climate in Haynes is humid subtropical, with hot summers and mild winters. The average annual temperature is around 64 degrees Fahrenheit, with an average high of around 90 degrees in the summer and an average low of around 40 degrees in the winter. The town receives an average of 48 inches of precipitation per year, with most of it falling in the spring and summer months.
Economy
The economy of Haynes is largely based on agriculture and tourism. The town is home to several farms, which produce a variety of crops, including corn, soybeans, wheat, and hay. The town also has a number of small businesses, including restaurants, shops, and services.
Tourism is an important part of the economy in Haynes. The town is home to several attractions, including the Arkansas River Valley Museum, which showcases the history of the area, and the Haynes Historic District, which features a variety of historic buildings. The town also hosts a number of festivals and events throughout the year, including the Haynes Harvest Festival and the Haynes Christmas Parade.
Demographics
As of the 2010 census, the population of Haynes was 1,000 people. The racial makeup of the town was 95.2% White, 0.7% African American, 0.7% Native American, 0.3% Asian, and 2.9% from other races. The median household income was $35,000, and the median age was 38.
The town is served by the Fort Smith Public School District, which includes two elementary schools, one middle school, and one high school. The town also has a number of churches, including the First Baptist Church of Haynes, the First United Methodist Church of Haynes, and the Haynes Church of Christ.
Conclusion
Haynes, Arkansas is a small town located in the northwest corner of the state, near the Oklahoma border. It is part of the Fort Smith metropolitan area and is situated in the Arkansas River Valley. The town was founded in 1883 and has a population of approximately 1,000 people. The economy of Haynes is largely based on agriculture and tourism, and the town is home to several attractions, including the Arkansas River Valley Museum and the Haynes Historic District. The town is served by the Fort Smith Public School District, and has a number of churches. The population of Haynes is mostly White, with a small percentage of African American, Native American, and Asian residents.
Common Questions
What is Per Capita Income in Haynes?
Per Capita income in Haynes is $22,151.
What is the Median Family Income in Haynes?
Median Family Income in Haynes is $40,625.
What is the Median Household income in Haynes?
Median Household Income in Haynes is $42,000.
What is Inequality or Gini Index in Haynes?
Inequality or Gini Index in Haynes is 0.41.
What is the Total Population of Haynes?
Total Population of Haynes is 113.
What is the Total Male Population of Haynes?
Total Male Population of Haynes is 79.
What is the Total Female Population of Haynes?
Total Female Population of Haynes is 34.
What is the Ratio of Males per 100 Females in Haynes?
There are 232.35 Males per 100 Females in Haynes.
What is the Ratio of Females per 100 Males in Haynes?
There are 43.04 Females per 100 Males in Haynes.
What is the Median Population Age in Haynes?
Median Population Age in Haynes is 43.5 Years.
What is the Average Family Size in Haynes
Average Family Size in Haynes is 3.3 People.
What is the Average Household Size in Haynes
Average Household Size in Haynes is 3.0 People.
How Large is the Labor Force in Haynes?
There are 50 People in the Labor Forcein in Haynes.
What is the Percentage of People in the Labor Force in Haynes?
47.2% of People are in the Labor Force in Haynes.
What is the Unemployment Rate in Haynes?
Unemployment Rate in Haynes is 28.0%.