Puerto Rican vs Hispanic or Latino No Vehicles in Household
COMPARE
Puerto Rican
Hispanic or Latino
No Vehicles in Household
No Vehicles in Household Comparison
Puerto Ricans
Hispanics or Latinos
15.5%
NO VEHICLES IN HOUSEHOLD
0.0/ 100
METRIC RATING
309th/ 347
METRIC RANK
9.1%
NO VEHICLES IN HOUSEHOLD
97.7/ 100
METRIC RATING
107th/ 347
METRIC RANK
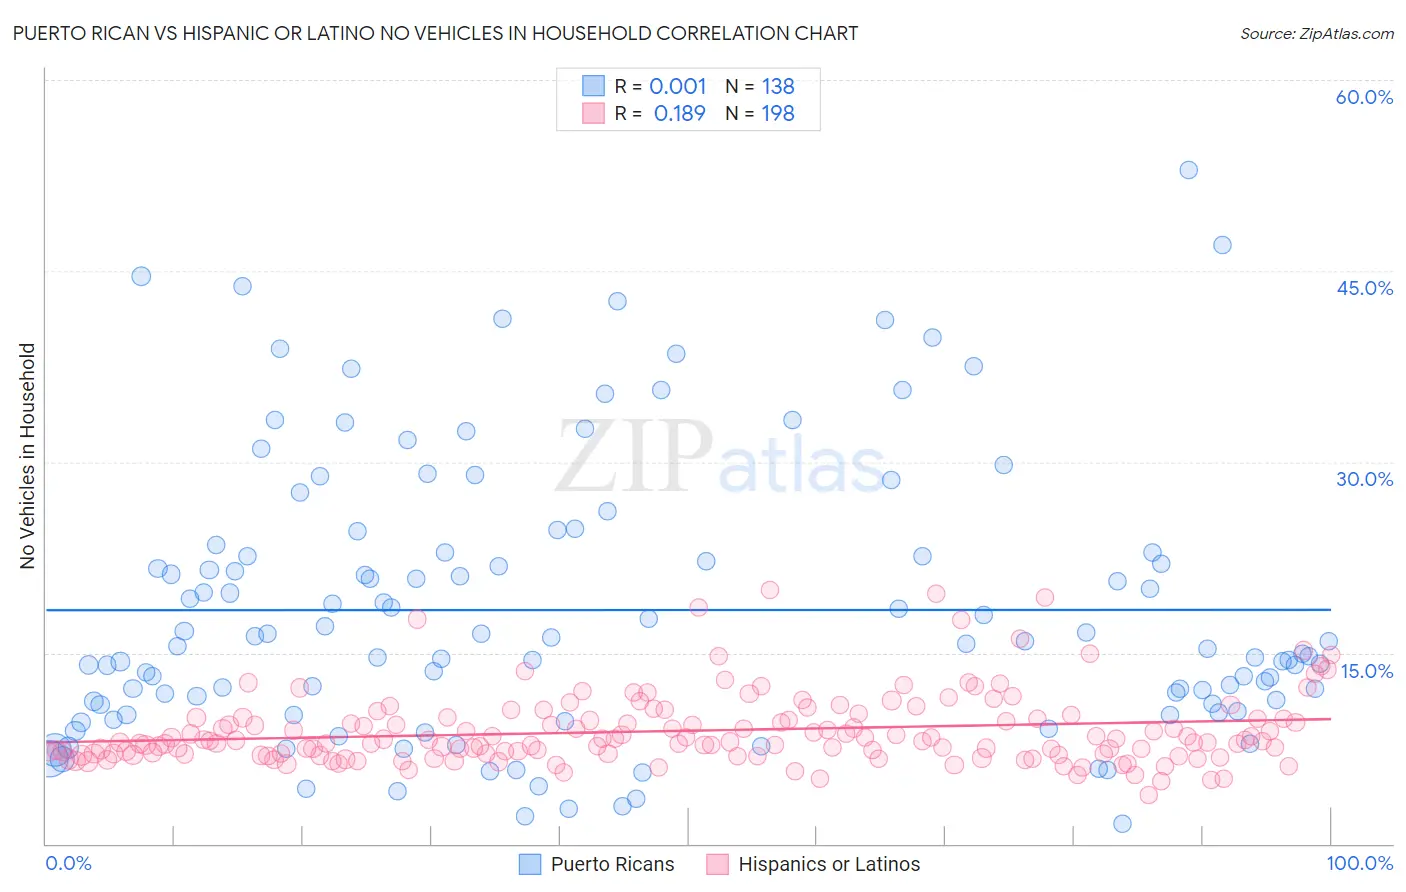
Puerto Rican vs Hispanic or Latino No Vehicles in Household Correlation Chart
The statistical analysis conducted on geographies consisting of 525,427,776 people shows no correlation between the proportion of Puerto Ricans and percentage of households with no vehicle available in the United States with a correlation coefficient (R) of 0.001 and weighted average of 15.5%. Similarly, the statistical analysis conducted on geographies consisting of 558,633,486 people shows a poor positive correlation between the proportion of Hispanics or Latinos and percentage of households with no vehicle available in the United States with a correlation coefficient (R) of 0.189 and weighted average of 9.1%, a difference of 70.5%.
No Vehicles in Household Correlation Summary
| Measurement | Puerto Rican | Hispanic or Latino |
| Minimum | 1.5% | 3.8% |
| Maximum | 53.0% | 19.9% |
| Range | 51.4% | 16.1% |
| Mean | 18.4% | 8.9% |
| Median | 15.6% | 8.1% |
| Interquartile 25% (IQ1) | 10.9% | 7.0% |
| Interquartile 75% (IQ3) | 22.8% | 9.9% |
| Interquartile Range (IQR) | 11.9% | 2.9% |
| Standard Deviation (Sample) | 10.8% | 2.8% |
| Standard Deviation (Population) | 10.8% | 2.8% |
Similar Demographics by No Vehicles in Household
Demographics Similar to Puerto Ricans by No Vehicles in Household
In terms of no vehicles in household, the demographic groups most similar to Puerto Ricans are Cape Verdean (15.6%, a difference of 0.56%), Immigrants from Israel (15.6%, a difference of 0.57%), U.S. Virgin Islander (15.4%, a difference of 0.65%), Immigrants from Haiti (15.4%, a difference of 0.69%), and Alaskan Athabascan (15.6%, a difference of 0.72%).
| Demographics | Rating | Rank | No Vehicles in Household |
| Haitians | 0.0 /100 | #302 | Tragic 14.9% |
| Immigrants | Western Africa | 0.0 /100 | #303 | Tragic 15.0% |
| Immigrants | Russia | 0.0 /100 | #304 | Tragic 15.1% |
| Immigrants | China | 0.0 /100 | #305 | Tragic 15.2% |
| Immigrants | Belize | 0.0 /100 | #306 | Tragic 15.4% |
| Immigrants | Haiti | 0.0 /100 | #307 | Tragic 15.4% |
| U.S. Virgin Islanders | 0.0 /100 | #308 | Tragic 15.4% |
| Puerto Ricans | 0.0 /100 | #309 | Tragic 15.5% |
| Cape Verdeans | 0.0 /100 | #310 | Tragic 15.6% |
| Immigrants | Israel | 0.0 /100 | #311 | Tragic 15.6% |
| Alaskan Athabascans | 0.0 /100 | #312 | Tragic 15.6% |
| Tohono O'odham | 0.0 /100 | #313 | Tragic 15.6% |
| Albanians | 0.0 /100 | #314 | Tragic 15.6% |
| Cypriots | 0.0 /100 | #315 | Tragic 15.7% |
| Ghanaians | 0.0 /100 | #316 | Tragic 16.4% |
Demographics Similar to Hispanics or Latinos by No Vehicles in Household
In terms of no vehicles in household, the demographic groups most similar to Hispanics or Latinos are Mexican American Indian (9.1%, a difference of 0.080%), Maltese (9.1%, a difference of 0.21%), Laotian (9.1%, a difference of 0.26%), Spanish American (9.1%, a difference of 0.36%), and Zimbabwean (9.0%, a difference of 0.52%).
| Demographics | Rating | Rank | No Vehicles in Household |
| Asians | 98.3 /100 | #100 | Exceptional 9.0% |
| Pakistanis | 98.3 /100 | #101 | Exceptional 9.0% |
| Yugoslavians | 98.3 /100 | #102 | Exceptional 9.0% |
| Seminole | 98.3 /100 | #103 | Exceptional 9.0% |
| Zimbabweans | 98.0 /100 | #104 | Exceptional 9.0% |
| Spanish Americans | 97.9 /100 | #105 | Exceptional 9.1% |
| Laotians | 97.8 /100 | #106 | Exceptional 9.1% |
| Hispanics or Latinos | 97.7 /100 | #107 | Exceptional 9.1% |
| Mexican American Indians | 97.6 /100 | #108 | Exceptional 9.1% |
| Maltese | 97.6 /100 | #109 | Exceptional 9.1% |
| Delaware | 97.2 /100 | #110 | Exceptional 9.2% |
| Immigrants | Kuwait | 95.1 /100 | #111 | Exceptional 9.4% |
| Armenians | 95.0 /100 | #112 | Exceptional 9.4% |
| Immigrants | Netherlands | 94.8 /100 | #113 | Exceptional 9.4% |
| Serbians | 94.3 /100 | #114 | Exceptional 9.4% |