Tohono O'odham vs Liberian 1 or more Vehicles in Household
COMPARE
Tohono O'odham
Liberian
1 or more Vehicles in Household
1 or more Vehicles in Household Comparison
Tohono O'odham
Liberians
84.7%
1 OR MORE VEHICLES IN HOUSEHOLD
0.0/ 100
METRIC RATING
307th/ 347
METRIC RANK
88.0%
1 OR MORE VEHICLES IN HOUSEHOLD
0.9/ 100
METRIC RATING
257th/ 347
METRIC RANK
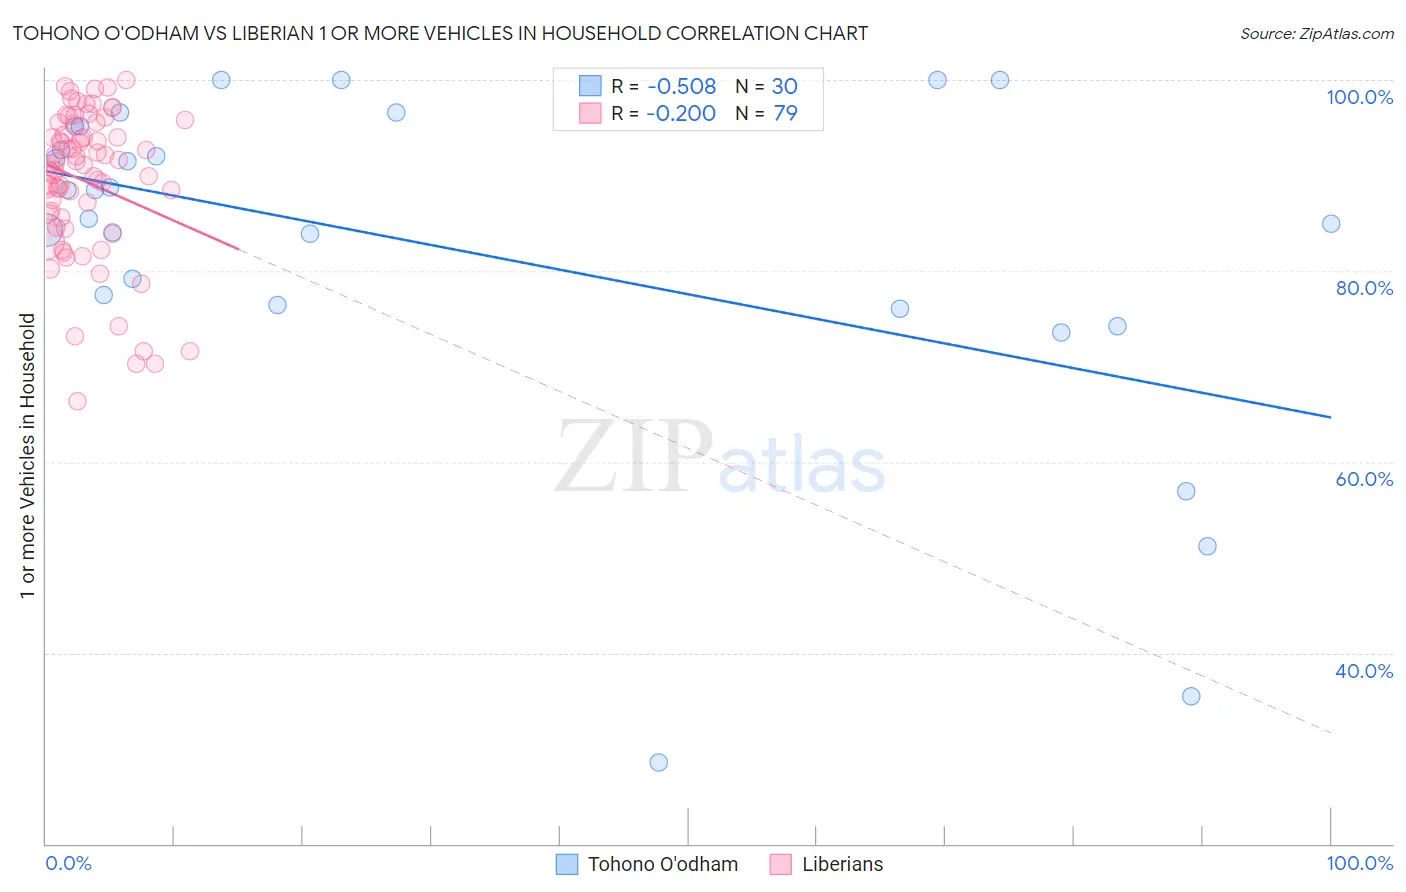
Tohono O'odham vs Liberian 1 or more Vehicles in Household Correlation Chart
The statistical analysis conducted on geographies consisting of 58,718,905 people shows a substantial negative correlation between the proportion of Tohono O'odham and percentage of households with 1 or more vehicles available in the United States with a correlation coefficient (R) of -0.508 and weighted average of 84.7%. Similarly, the statistical analysis conducted on geographies consisting of 118,045,593 people shows a poor negative correlation between the proportion of Liberians and percentage of households with 1 or more vehicles available in the United States with a correlation coefficient (R) of -0.200 and weighted average of 88.0%, a difference of 3.9%.
1 or more Vehicles in Household Correlation Summary
| Measurement | Tohono O'odham | Liberian |
| Minimum | 28.6% | 66.4% |
| Maximum | 100.0% | 100.0% |
| Range | 71.4% | 33.6% |
| Mean | 82.3% | 89.3% |
| Median | 86.9% | 91.2% |
| Interquartile 25% (IQ1) | 76.4% | 85.6% |
| Interquartile 75% (IQ3) | 95.1% | 95.4% |
| Interquartile Range (IQR) | 18.7% | 9.8% |
| Standard Deviation (Sample) | 18.1% | 7.7% |
| Standard Deviation (Population) | 17.8% | 7.7% |
Similar Demographics by 1 or more Vehicles in Household
Demographics Similar to Tohono O'odham by 1 or more Vehicles in Household
In terms of 1 or more vehicles in household, the demographic groups most similar to Tohono O'odham are Immigrants from Belize (84.7%, a difference of 0.030%), Immigrants from Haiti (84.7%, a difference of 0.040%), U.S. Virgin Islander (84.6%, a difference of 0.070%), Puerto Rican (84.6%, a difference of 0.11%), and Cape Verdean (84.5%, a difference of 0.22%).
| Demographics | Rating | Rank | 1 or more Vehicles in Household |
| Immigrants | Russia | 0.0 /100 | #300 | Tragic 85.4% |
| Immigrants | Panama | 0.0 /100 | #301 | Tragic 85.4% |
| Moroccans | 0.0 /100 | #302 | Tragic 85.4% |
| Immigrants | Greece | 0.0 /100 | #303 | Tragic 85.4% |
| Immigrants | Ukraine | 0.0 /100 | #304 | Tragic 85.2% |
| Immigrants | China | 0.0 /100 | #305 | Tragic 84.9% |
| Immigrants | Western Africa | 0.0 /100 | #306 | Tragic 84.9% |
| Tohono O'odham | 0.0 /100 | #307 | Tragic 84.7% |
| Immigrants | Belize | 0.0 /100 | #308 | Tragic 84.7% |
| Immigrants | Haiti | 0.0 /100 | #309 | Tragic 84.7% |
| U.S. Virgin Islanders | 0.0 /100 | #310 | Tragic 84.6% |
| Puerto Ricans | 0.0 /100 | #311 | Tragic 84.6% |
| Cape Verdeans | 0.0 /100 | #312 | Tragic 84.5% |
| Immigrants | Israel | 0.0 /100 | #313 | Tragic 84.5% |
| Albanians | 0.0 /100 | #314 | Tragic 84.4% |
Demographics Similar to Liberians by 1 or more Vehicles in Household
In terms of 1 or more vehicles in household, the demographic groups most similar to Liberians are Colombian (88.0%, a difference of 0.0%), South American Indian (88.0%, a difference of 0.0%), Immigrants from Latvia (88.1%, a difference of 0.010%), Haitian (88.1%, a difference of 0.030%), and Nigerian (88.0%, a difference of 0.030%).
| Demographics | Rating | Rank | 1 or more Vehicles in Household |
| Egyptians | 1.2 /100 | #250 | Tragic 88.2% |
| Immigrants | Serbia | 1.2 /100 | #251 | Tragic 88.2% |
| Immigrants | Uruguay | 1.1 /100 | #252 | Tragic 88.1% |
| Hondurans | 1.0 /100 | #253 | Tragic 88.1% |
| Haitians | 0.9 /100 | #254 | Tragic 88.1% |
| Immigrants | Latvia | 0.9 /100 | #255 | Tragic 88.1% |
| Colombians | 0.9 /100 | #256 | Tragic 88.0% |
| Liberians | 0.9 /100 | #257 | Tragic 88.0% |
| South American Indians | 0.9 /100 | #258 | Tragic 88.0% |
| Nigerians | 0.8 /100 | #259 | Tragic 88.0% |
| Macedonians | 0.6 /100 | #260 | Tragic 87.9% |
| Immigrants | Switzerland | 0.6 /100 | #261 | Tragic 87.9% |
| Sub-Saharan Africans | 0.5 /100 | #262 | Tragic 87.9% |
| Immigrants | Egypt | 0.5 /100 | #263 | Tragic 87.8% |
| Immigrants | Liberia | 0.4 /100 | #264 | Tragic 87.8% |