Paraguayan vs Kenyan No Vehicles in Household
COMPARE
Paraguayan
Kenyan
No Vehicles in Household
No Vehicles in Household Comparison
Paraguayans
Kenyans
14.4%
NO VEHICLES IN HOUSEHOLD
0.0/ 100
METRIC RATING
295th/ 347
METRIC RANK
9.7%
NO VEHICLES IN HOUSEHOLD
88.0/ 100
METRIC RATING
132nd/ 347
METRIC RANK
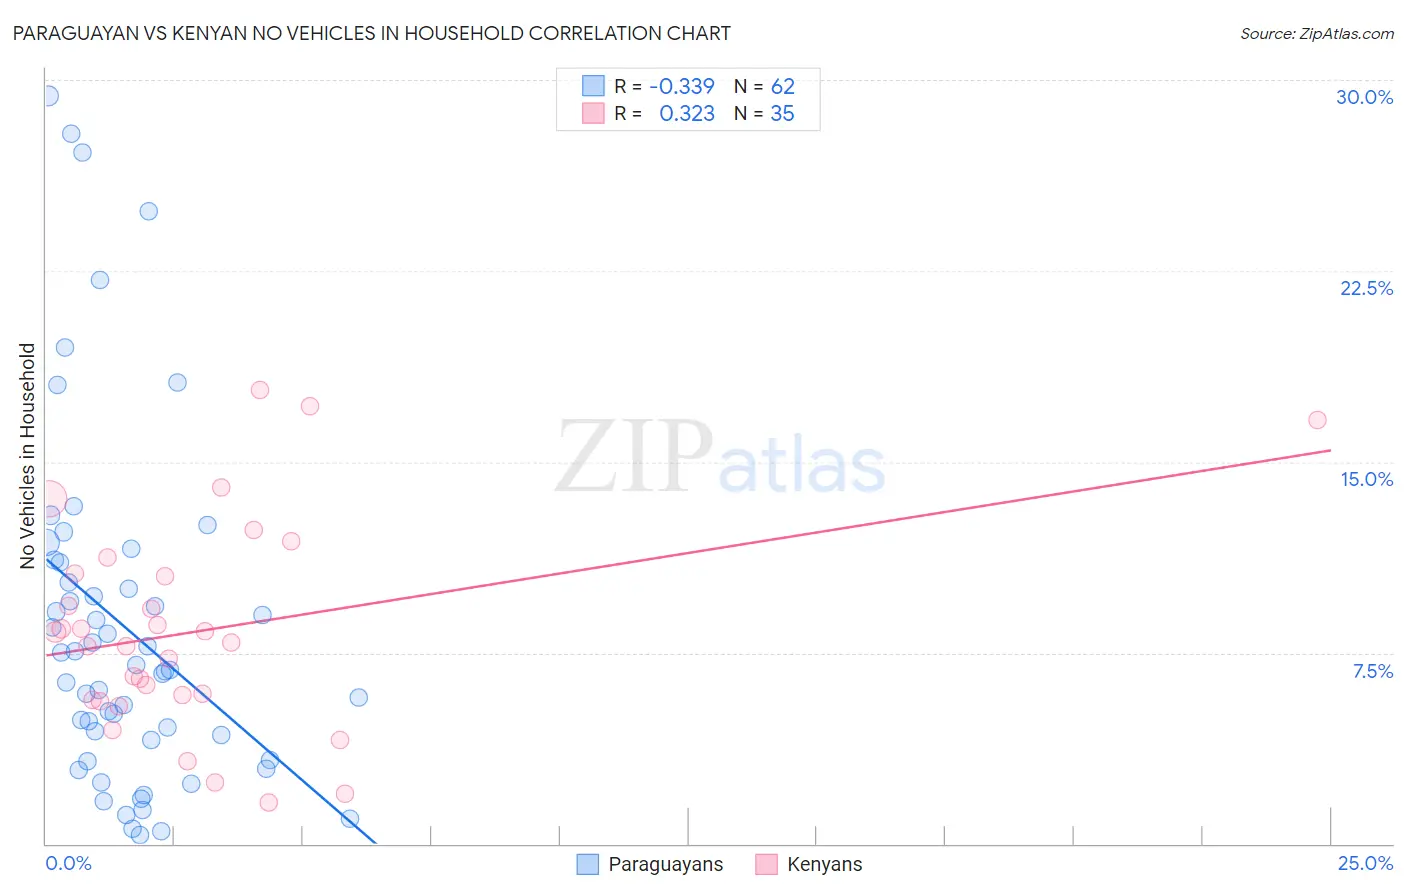
Paraguayan vs Kenyan No Vehicles in Household Correlation Chart
The statistical analysis conducted on geographies consisting of 94,954,022 people shows a mild negative correlation between the proportion of Paraguayans and percentage of households with no vehicle available in the United States with a correlation coefficient (R) of -0.339 and weighted average of 14.4%. Similarly, the statistical analysis conducted on geographies consisting of 168,125,238 people shows a mild positive correlation between the proportion of Kenyans and percentage of households with no vehicle available in the United States with a correlation coefficient (R) of 0.323 and weighted average of 9.7%, a difference of 47.9%.
No Vehicles in Household Correlation Summary
| Measurement | Paraguayan | Kenyan |
| Minimum | 0.32% | 1.6% |
| Maximum | 29.4% | 17.8% |
| Range | 29.0% | 16.2% |
| Mean | 8.5% | 8.4% |
| Median | 6.9% | 7.9% |
| Interquartile 25% (IQ1) | 4.1% | 5.6% |
| Interquartile 75% (IQ3) | 11.1% | 10.6% |
| Interquartile Range (IQR) | 7.0% | 5.0% |
| Standard Deviation (Sample) | 6.9% | 4.1% |
| Standard Deviation (Population) | 6.8% | 4.0% |
Similar Demographics by No Vehicles in Household
Demographics Similar to Paraguayans by No Vehicles in Household
In terms of no vehicles in household, the demographic groups most similar to Paraguayans are Belizean (14.3%, a difference of 0.13%), Immigrants from Jamaica (14.2%, a difference of 0.91%), Immigrants from Spain (14.5%, a difference of 1.3%), Pima (14.1%, a difference of 1.6%), and Immigrants from Panama (14.6%, a difference of 2.0%).
| Demographics | Rating | Rank | No Vehicles in Household |
| Hopi | 0.0 /100 | #288 | Tragic 13.7% |
| Immigrants | Australia | 0.0 /100 | #289 | Tragic 13.8% |
| Indians (Asian) | 0.0 /100 | #290 | Tragic 14.1% |
| Okinawans | 0.0 /100 | #291 | Tragic 14.1% |
| Pima | 0.0 /100 | #292 | Tragic 14.1% |
| Immigrants | Jamaica | 0.0 /100 | #293 | Tragic 14.2% |
| Belizeans | 0.0 /100 | #294 | Tragic 14.3% |
| Paraguayans | 0.0 /100 | #295 | Tragic 14.4% |
| Immigrants | Spain | 0.0 /100 | #296 | Tragic 14.5% |
| Immigrants | Panama | 0.0 /100 | #297 | Tragic 14.6% |
| Moroccans | 0.0 /100 | #298 | Tragic 14.7% |
| Immigrants | Greece | 0.0 /100 | #299 | Tragic 14.7% |
| Yuman | 0.0 /100 | #300 | Tragic 14.9% |
| Immigrants | Ukraine | 0.0 /100 | #301 | Tragic 14.9% |
| Haitians | 0.0 /100 | #302 | Tragic 14.9% |
Demographics Similar to Kenyans by No Vehicles in Household
In terms of no vehicles in household, the demographic groups most similar to Kenyans are Immigrants from the Azores (9.7%, a difference of 0.070%), Burmese (9.7%, a difference of 0.28%), Immigrants from Oceania (9.7%, a difference of 0.30%), Syrian (9.7%, a difference of 0.32%), and Nicaraguan (9.7%, a difference of 0.53%).
| Demographics | Rating | Rank | No Vehicles in Household |
| Immigrants | Cameroon | 90.6 /100 | #125 | Exceptional 9.6% |
| Icelanders | 90.2 /100 | #126 | Exceptional 9.6% |
| Immigrants | Kenya | 89.7 /100 | #127 | Excellent 9.6% |
| Immigrants | Syria | 89.5 /100 | #128 | Excellent 9.6% |
| Nicaraguans | 89.5 /100 | #129 | Excellent 9.7% |
| Burmese | 88.8 /100 | #130 | Excellent 9.7% |
| Immigrants | Azores | 88.2 /100 | #131 | Excellent 9.7% |
| Kenyans | 88.0 /100 | #132 | Excellent 9.7% |
| Immigrants | Oceania | 87.1 /100 | #133 | Excellent 9.7% |
| Syrians | 87.1 /100 | #134 | Excellent 9.7% |
| Latvians | 85.1 /100 | #135 | Excellent 9.8% |
| Immigrants | South Africa | 85.0 /100 | #136 | Excellent 9.8% |
| Immigrants | Moldova | 84.6 /100 | #137 | Excellent 9.8% |
| Estonians | 84.2 /100 | #138 | Excellent 9.8% |
| Marshallese | 84.0 /100 | #139 | Excellent 9.8% |