Slovak vs Danish 1 or more Vehicles in Household

COMPARE

Slovak
Race
Ancestry
AfghanAfricanAlaska NativeAlaskan AthabascanAlbanianAleutAlsatianAmericanApacheArabArapahoArgentineanArmenianAssyrian/Chaldean/SyriacAustralianAustrianBahamianBangladeshiBarbadianBasqueBelgianBelizeanBermudanBhutaneseBlackfeetBolivianBrazilianBritishBritish West IndianBulgarianBurmeseCajunCambodianCanadianCape VerdeanCarpatho RusynCelticCentral AmericanCentral American IndianCherokeeCheyenneChickasawChileanChineseChippewaChoctawColombianColvilleComancheCosta RicanCreeCreekCroatianCrowCubanCypriotCzechCzechoslovakianDelawareDominicanDutchDutch West IndianEastern EuropeanEcuadorianEgyptianEnglishEstonianEthiopianEuropeanFijianFilipinoFinnishFrenchFrench American IndianFrench CanadianGermanGerman RussianGhanaianGreekGuamanian/ChamorroGuatemalanGuyaneseHaitianHmongHonduranHopiHoumaHungarianIcelanderIndian (Asian)IndonesianInupiatIranianIraqiIrishIroquoisIsraeliItalianJamaicanJapaneseJordanianKenyanKiowaKoreanLaotianLatvianLebaneseLiberianLithuanianLumbeeLuxembourgerMacedonianMalaysianMalteseMarshalleseMenomineeMexicanMexican American IndianMongolianMoroccanNative HawaiianNavajoNepaleseNew ZealanderNicaraguanNigerianNorthern EuropeanNorwegianOkinawanOsageOttawaPaiutePakistaniPalestinianPanamanianParaguayanPennsylvania GermanPeruvianPimaPolishPortuguesePotawatomiPuebloPuerto RicanPuget Sound SalishRomanianRussianSalvadoranSamoanScandinavianScotch-IrishScottishSeminoleSenegaleseSerbianShoshoneSierra LeoneanSiouxSlavicSlovakSloveneSomaliSouth AfricanSouth AmericanSouth American IndianSoviet UnionSpaniardSpanishSpanish AmericanSpanish American IndianSri LankanSubsaharan AfricanSudaneseSwedishSwissSyrianTaiwaneseThaiTlingit-HaidaTohono O'OdhamTonganTrinidadian and TobagonianTsimshianTurkishU.S. Virgin IslanderUgandanUkrainianUruguayanUteVenezuelanVietnameseWelshWest IndianYakamaYaquiYugoslavianYumanYup'ikZimbabwean
Immigration
NonimmigrantsImmigrantsAfghanistanAfricaAlbaniaArgentinaArmeniaAsiaAustraliaAustriaBahamasBangladeshBarbadosBelarusBelgiumBelizeBoliviaBosnia and HerzegovinaBrazilBulgariaBurma/MyanmarCabo VerdeCambodiaCameroonCanadaCaribbeanCentral AmericaChileChinaColombiaCongoCosta RicaCroatiaCubaCzechoslovakiaDenmarkDominicaDominican RepublicEastern AfricaEastern AsiaEastern EuropeEcuadorEgyptEl SalvadorEnglandEritreaEthiopiaEuropeFijiFranceGermanyGhanaGreeceGrenadaGuatemalaGuyanaHaitiHondurasHong KongHungaryIndiaIndonesiaIranIraqIrelandIsraelItalyJamaicaJapanJordanKazakhstanKenyaKoreaKuwaitLaosLatin AmericaLatviaLebanonLiberiaLithuaniaMalaysiaMexicoMicronesiaMiddle AfricaMoldovaMoroccoNepalNetherlandsNicaraguaNigeriaNorth AmericaNorth MacedoniaNorthern AfricaNorthern EuropeNorwayOceaniaPakistanPanamaPeruPhilippinesPolandPortugalRomaniaRussiaSaudi ArabiaScotlandSenegalSerbiaSierra LeoneSingaporeSomaliaSouth AfricaSouth AmericaSouth Central AsiaSouth Eastern AsiaSouthern EuropeSpainSri LankaSt. Vincent and the GrenadinesSudanSwedenSwitzerlandSyriaTaiwanThailandTrinidad and TobagoTurkeyUgandaUkraineUruguayUzbekistanVenezuelaVietnamWest IndiesWestern AfricaWestern AsiaWestern EuropeYemenZaireZimbabweAzores
Danish
Race
Ancestry
AfghanAfricanAlaska NativeAlaskan AthabascanAlbanianAleutAlsatianAmericanApacheArabArapahoArgentineanArmenianAssyrian/Chaldean/SyriacAustralianAustrianBahamianBangladeshiBarbadianBasqueBelgianBelizeanBermudanBhutaneseBlackfeetBolivianBrazilianBritishBritish West IndianBulgarianBurmeseCajunCambodianCanadianCape VerdeanCarpatho RusynCelticCentral AmericanCentral American IndianCherokeeCheyenneChickasawChileanChineseChippewaChoctawColombianColvilleComancheCosta RicanCreeCreekCroatianCrowCubanCypriotCzechCzechoslovakianDanishDelawareDominicanDutchDutch West IndianEastern EuropeanEcuadorianEgyptianEnglishEstonianEthiopianEuropeanFijianFilipinoFinnishFrenchFrench American IndianFrench CanadianGermanGerman RussianGhanaianGreekGuamanian/ChamorroGuatemalanGuyaneseHaitianHmongHonduranHopiHoumaHungarianIcelanderIndian (Asian)IndonesianInupiatIranianIraqiIrishIroquoisIsraeliItalianJamaicanJapaneseJordanianKenyanKiowaKoreanLaotianLatvianLebaneseLiberianLithuanianLumbeeLuxembourgerMacedonianMalaysianMalteseMarshalleseMenomineeMexicanMexican American IndianMongolianMoroccanNative HawaiianNavajoNepaleseNew ZealanderNicaraguanNigerianNorthern EuropeanNorwegianOkinawanOsageOttawaPaiutePakistaniPalestinianPanamanianParaguayanPennsylvania GermanPeruvianPimaPolishPortuguesePotawatomiPuebloPuerto RicanPuget Sound SalishRomanianRussianSalvadoranSamoanScandinavianScotch-IrishScottishSeminoleSenegaleseSerbianShoshoneSierra LeoneanSiouxSlavicSloveneSomaliSouth AfricanSouth AmericanSouth American IndianSoviet UnionSpaniardSpanishSpanish AmericanSpanish American IndianSri LankanSubsaharan AfricanSudaneseSwedishSwissSyrianTaiwaneseThaiTlingit-HaidaTohono O'OdhamTonganTrinidadian and TobagonianTsimshianTurkishU.S. Virgin IslanderUgandanUkrainianUruguayanUteVenezuelanVietnameseWelshWest IndianYakamaYaquiYugoslavianYumanYup'ikZimbabwean
Immigration
NonimmigrantsImmigrantsAfghanistanAfricaAlbaniaArgentinaArmeniaAsiaAustraliaAustriaBahamasBangladeshBarbadosBelarusBelgiumBelizeBoliviaBosnia and HerzegovinaBrazilBulgariaBurma/MyanmarCabo VerdeCambodiaCameroonCanadaCaribbeanCentral AmericaChileChinaColombiaCongoCosta RicaCroatiaCubaCzechoslovakiaDenmarkDominicaDominican RepublicEastern AfricaEastern AsiaEastern EuropeEcuadorEgyptEl SalvadorEnglandEritreaEthiopiaEuropeFijiFranceGermanyGhanaGreeceGrenadaGuatemalaGuyanaHaitiHondurasHong KongHungaryIndiaIndonesiaIranIraqIrelandIsraelItalyJamaicaJapanJordanKazakhstanKenyaKoreaKuwaitLaosLatin AmericaLatviaLebanonLiberiaLithuaniaMalaysiaMexicoMicronesiaMiddle AfricaMoldovaMoroccoNepalNetherlandsNicaraguaNigeriaNorth AmericaNorth MacedoniaNorthern AfricaNorthern EuropeNorwayOceaniaPakistanPanamaPeruPhilippinesPolandPortugalRomaniaRussiaSaudi ArabiaScotlandSenegalSerbiaSierra LeoneSingaporeSomaliaSouth AfricaSouth AmericaSouth Central AsiaSouth Eastern AsiaSouthern EuropeSpainSri LankaSt. Vincent and the GrenadinesSudanSwedenSwitzerlandSyriaTaiwanThailandTrinidad and TobagoTurkeyUgandaUkraineUruguayUzbekistanVenezuelaVietnamWest IndiesWestern AfricaWestern AsiaWestern EuropeYemenZaireZimbabweAzores
1 or more Vehicles in Household
Income
Poverty
Unemployment
Labor Participation
Family Structure
Vehicle Availability
Education Level
Disability

1 or more Vehicles in Household Comparison

Slovaks

Danes

Exceptional
Exceptional
91.9%
1 OR MORE VEHICLES IN HOUSEHOLD
99.8/ 100
METRIC RATING
60th/ 347
METRIC RANK
93.5%
1 OR MORE VEHICLES IN HOUSEHOLD
100.0/ 100
METRIC RATING
6th/ 347
METRIC RANK

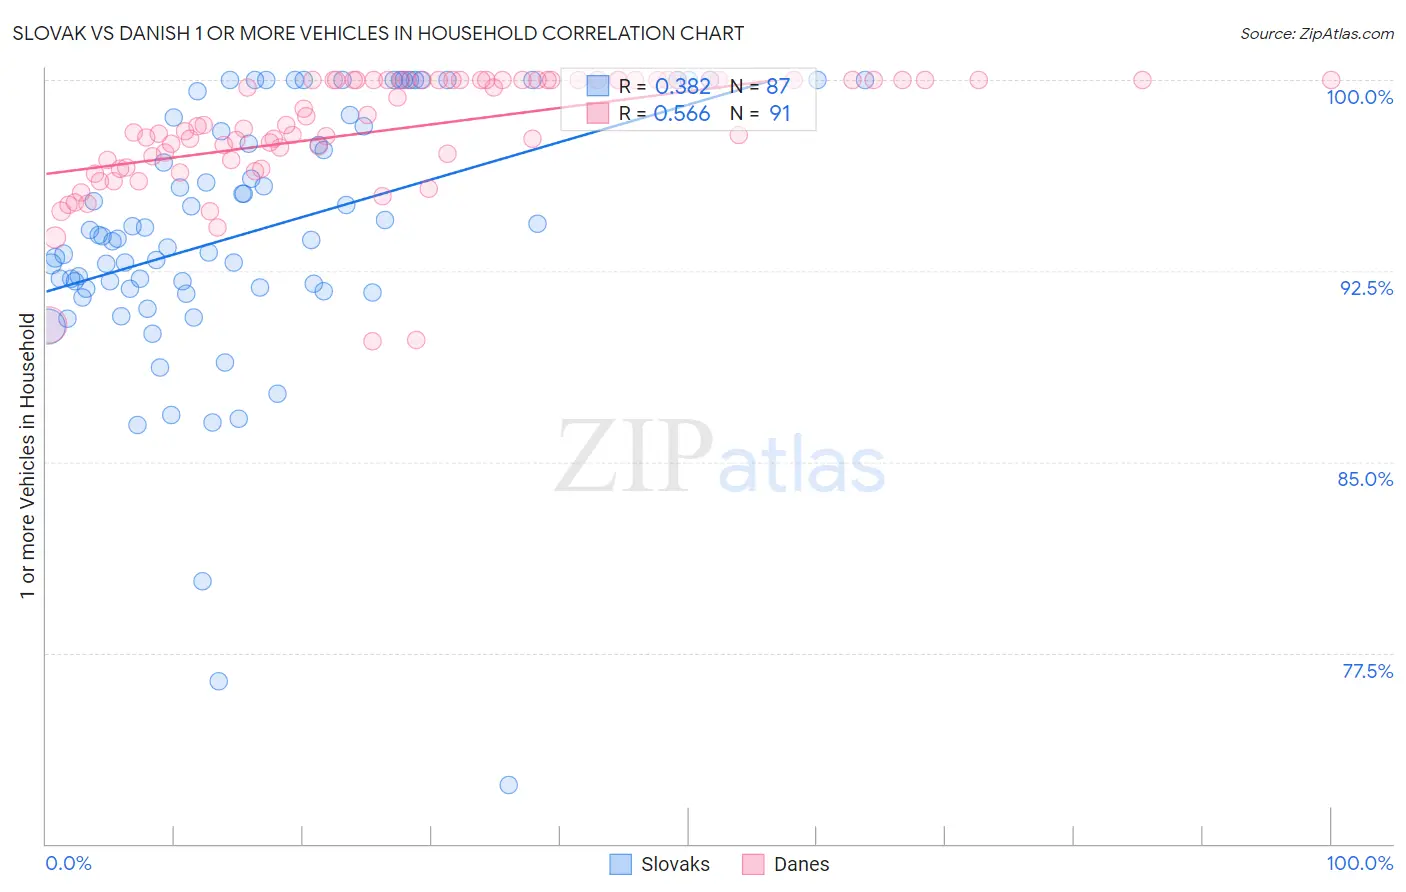
Slovak vs Danish 1 or more Vehicles in Household Correlation Chart

The statistical analysis conducted on geographies consisting of 397,723,314 people shows a mild positive correlation between the proportion of Slovaks and percentage of households with 1 or more vehicles available in the United States with a correlation coefficient (R) of 0.382 and weighted average of 91.9%. Similarly, the statistical analysis conducted on geographies consisting of 473,956,098 people shows a substantial positive correlation between the proportion of Danes and percentage of households with 1 or more vehicles available in the United States with a correlation coefficient (R) of 0.566 and weighted average of 93.5%, a difference of 1.8%.
Slovak vs Danish 1 or more Vehicles in Household

1 or more Vehicles in Household Correlation Summary

MeasurementSlovakDanish
Minimum72.3%89.7%
Maximum100.0%100.0%
Range27.7%10.3%
Mean94.1%98.0%
Median93.8%98.2%
Interquartile 25% (IQ1)91.8%96.9%
Interquartile 75% (IQ3)98.5%100.0%
Interquartile Range (IQR)6.7%3.1%
Standard Deviation (Sample)5.2%2.3%
Standard Deviation (Population)5.1%2.3%

Similar Demographics by 1 or more Vehicles in Household

Demographics Similar to Slovaks by 1 or more Vehicles in Household

In terms of 1 or more vehicles in household, the demographic groups most similar to Slovaks are Immigrants from India (91.9%, a difference of 0.010%), Thai (91.9%, a difference of 0.020%), Venezuelan (91.9%, a difference of 0.030%), Immigrants from Mexico (91.9%, a difference of 0.040%), and Chinese (91.9%, a difference of 0.040%).
DemographicsRating | Rank1 or more Vehicles in Household
Hawaiians
99.9
/100
|
#53
Exceptional
92.0%
Slovenes
99.9
/100
|
#54
Exceptional
92.0%
Immigrants | Afghanistan
99.9
/100
|
#55
Exceptional
92.0%
Immigrants | Venezuela
99.9
/100
|
#56
Exceptional
92.0%
Iraqis
99.8
/100
|
#57
Exceptional
91.9%
Immigrants | Mexico
99.8
/100
|
#58
Exceptional
91.9%
Venezuelans
99.8
/100
|
#59
Exceptional
91.9%
Slovaks
99.8
/100
|
#60
Exceptional
91.9%
Immigrants | India
99.8
/100
|
#61
Exceptional
91.9%
Thais
99.8
/100
|
#62
Exceptional
91.9%
Chinese
99.8
/100
|
#63
Exceptional
91.9%
Croatians
99.8
/100
|
#64
Exceptional
91.9%
Immigrants | Laos
99.8
/100
|
#65
Exceptional
91.8%
Canadians
99.8
/100
|
#66
Exceptional
91.8%
Spaniards
99.8
/100
|
#67
Exceptional
91.8%

Demographics Similar to Danes by 1 or more Vehicles in Household

In terms of 1 or more vehicles in household, the demographic groups most similar to Danes are Yakama (93.6%, a difference of 0.020%), German (93.6%, a difference of 0.12%), Norwegian (93.7%, a difference of 0.16%), Scottish (93.4%, a difference of 0.19%), and Swedish (93.3%, a difference of 0.23%).
DemographicsRating | Rank1 or more Vehicles in Household
Luxembourgers
100.0
/100
|
#1
Exceptional
94.8%
English
100.0
/100
|
#2
Exceptional
93.8%
Norwegians
100.0
/100
|
#3
Exceptional
93.7%
Germans
100.0
/100
|
#4
Exceptional
93.6%
Yakama
100.0
/100
|
#5
Exceptional
93.6%
Danes
100.0
/100
|
#6
Exceptional
93.5%
Scottish
100.0
/100
|
#7
Exceptional
93.4%
Swedes
100.0
/100
|
#8
Exceptional
93.3%
Scotch-Irish
100.0
/100
|
#9
Exceptional
93.3%
Dutch
100.0
/100
|
#10
Exceptional
93.3%
Czechs
100.0
/100
|
#11
Exceptional
93.3%
Scandinavians
100.0
/100
|
#12
Exceptional
93.1%
Whites/Caucasians
100.0
/100
|
#13
Exceptional
93.1%
Irish
100.0
/100
|
#14
Exceptional
93.1%
Mexicans
100.0
/100
|
#15
Exceptional
93.0%