Samoan vs Norwegian No Vehicles in Household
COMPARE
Samoan
Norwegian
No Vehicles in Household
No Vehicles in Household Comparison
Samoans
Norwegians
7.6%
NO VEHICLES IN HOUSEHOLD
100.0/ 100
METRIC RATING
28th/ 347
METRIC RANK
6.4%
NO VEHICLES IN HOUSEHOLD
100.0/ 100
METRIC RATING
2nd/ 347
METRIC RANK
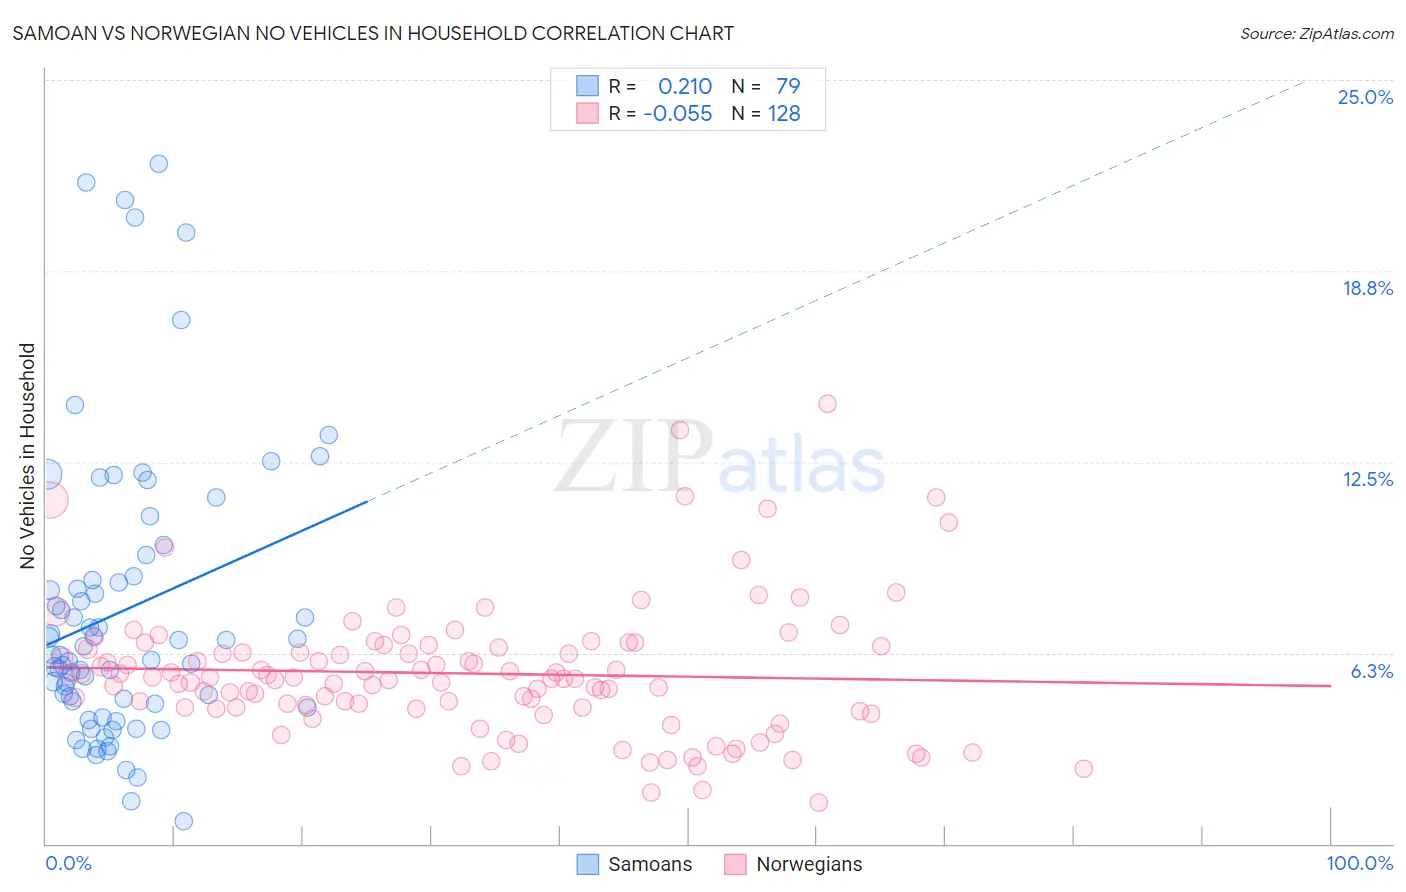
Samoan vs Norwegian No Vehicles in Household Correlation Chart
The statistical analysis conducted on geographies consisting of 224,864,894 people shows a weak positive correlation between the proportion of Samoans and percentage of households with no vehicle available in the United States with a correlation coefficient (R) of 0.210 and weighted average of 7.6%. Similarly, the statistical analysis conducted on geographies consisting of 529,211,633 people shows a slight negative correlation between the proportion of Norwegians and percentage of households with no vehicle available in the United States with a correlation coefficient (R) of -0.055 and weighted average of 6.4%, a difference of 18.5%.
No Vehicles in Household Correlation Summary
| Measurement | Samoan | Norwegian |
| Minimum | 0.73% | 1.4% |
| Maximum | 22.3% | 14.4% |
| Range | 21.5% | 13.0% |
| Mean | 7.6% | 5.6% |
| Median | 6.2% | 5.4% |
| Interquartile 25% (IQ1) | 4.6% | 4.4% |
| Interquartile 75% (IQ3) | 8.8% | 6.4% |
| Interquartile Range (IQR) | 4.2% | 2.0% |
| Standard Deviation (Sample) | 4.8% | 2.2% |
| Standard Deviation (Population) | 4.7% | 2.2% |
Similar Demographics by No Vehicles in Household
Demographics Similar to Samoans by No Vehicles in Household
In terms of no vehicles in household, the demographic groups most similar to Samoans are American (7.7%, a difference of 0.29%), British (7.6%, a difference of 0.55%), Finnish (7.7%, a difference of 0.59%), Sri Lankan (7.6%, a difference of 0.60%), and Native Hawaiian (7.7%, a difference of 0.74%).
| Demographics | Rating | Rank | No Vehicles in Household |
| Nepalese | 100.0 /100 | #21 | Exceptional 7.4% |
| Irish | 100.0 /100 | #22 | Exceptional 7.4% |
| French | 100.0 /100 | #23 | Exceptional 7.4% |
| Immigrants | Iraq | 100.0 /100 | #24 | Exceptional 7.5% |
| Yaqui | 100.0 /100 | #25 | Exceptional 7.5% |
| Sri Lankans | 100.0 /100 | #26 | Exceptional 7.6% |
| British | 100.0 /100 | #27 | Exceptional 7.6% |
| Samoans | 100.0 /100 | #28 | Exceptional 7.6% |
| Americans | 100.0 /100 | #29 | Exceptional 7.7% |
| Finns | 100.0 /100 | #30 | Exceptional 7.7% |
| Native Hawaiians | 100.0 /100 | #31 | Exceptional 7.7% |
| Malaysians | 100.0 /100 | #32 | Exceptional 7.7% |
| Immigrants | Taiwan | 100.0 /100 | #33 | Exceptional 7.7% |
| Immigrants | Vietnam | 100.0 /100 | #34 | Exceptional 7.7% |
| Cherokee | 99.9 /100 | #35 | Exceptional 7.7% |
Demographics Similar to Norwegians by No Vehicles in Household
In terms of no vehicles in household, the demographic groups most similar to Norwegians are English (6.5%, a difference of 1.1%), Danish (6.6%, a difference of 2.3%), Yakama (6.6%, a difference of 2.7%), German (6.7%, a difference of 3.7%), and Scottish (6.8%, a difference of 5.1%).
| Demographics | Rating | Rank | No Vehicles in Household |
| Luxembourgers | 100.0 /100 | #1 | Exceptional 5.4% |
| Norwegians | 100.0 /100 | #2 | Exceptional 6.4% |
| English | 100.0 /100 | #3 | Exceptional 6.5% |
| Danes | 100.0 /100 | #4 | Exceptional 6.6% |
| Yakama | 100.0 /100 | #5 | Exceptional 6.6% |
| Germans | 100.0 /100 | #6 | Exceptional 6.7% |
| Scottish | 100.0 /100 | #7 | Exceptional 6.8% |
| Swedes | 100.0 /100 | #8 | Exceptional 6.8% |
| Scotch-Irish | 100.0 /100 | #9 | Exceptional 6.8% |
| Dutch | 100.0 /100 | #10 | Exceptional 6.8% |
| Czechs | 100.0 /100 | #11 | Exceptional 6.9% |
| Assyrians/Chaldeans/Syriacs | 100.0 /100 | #12 | Exceptional 7.0% |
| Scandinavians | 100.0 /100 | #13 | Exceptional 7.0% |
| Mexicans | 100.0 /100 | #14 | Exceptional 7.0% |
| Whites/Caucasians | 100.0 /100 | #15 | Exceptional 7.0% |