Pakistani vs Norwegian No Vehicles in Household
COMPARE
Pakistani
Norwegian
No Vehicles in Household
No Vehicles in Household Comparison
Pakistanis
Norwegians
9.0%
NO VEHICLES IN HOUSEHOLD
98.3/ 100
METRIC RATING
101st/ 347
METRIC RANK
6.4%
NO VEHICLES IN HOUSEHOLD
100.0/ 100
METRIC RATING
2nd/ 347
METRIC RANK
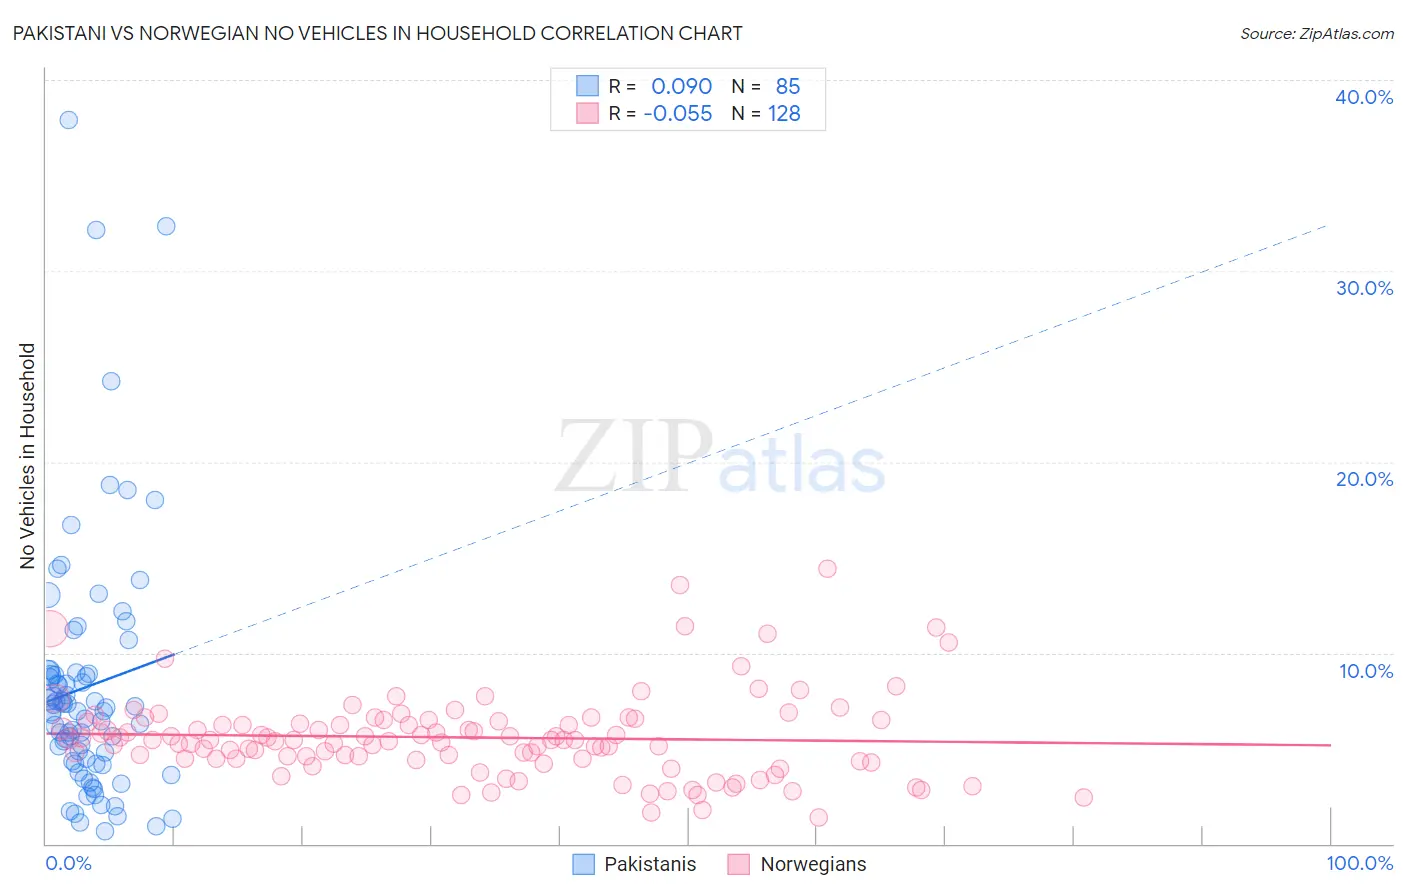
Pakistani vs Norwegian No Vehicles in Household Correlation Chart
The statistical analysis conducted on geographies consisting of 334,782,666 people shows a slight positive correlation between the proportion of Pakistanis and percentage of households with no vehicle available in the United States with a correlation coefficient (R) of 0.090 and weighted average of 9.0%. Similarly, the statistical analysis conducted on geographies consisting of 529,211,633 people shows a slight negative correlation between the proportion of Norwegians and percentage of households with no vehicle available in the United States with a correlation coefficient (R) of -0.055 and weighted average of 6.4%, a difference of 39.5%.
No Vehicles in Household Correlation Summary
| Measurement | Pakistani | Norwegian |
| Minimum | 0.66% | 1.4% |
| Maximum | 37.9% | 14.4% |
| Range | 37.2% | 13.0% |
| Mean | 8.2% | 5.6% |
| Median | 6.9% | 5.4% |
| Interquartile 25% (IQ1) | 4.3% | 4.4% |
| Interquartile 75% (IQ3) | 8.9% | 6.4% |
| Interquartile Range (IQR) | 4.7% | 2.0% |
| Standard Deviation (Sample) | 6.7% | 2.2% |
| Standard Deviation (Population) | 6.6% | 2.2% |
Similar Demographics by No Vehicles in Household
Demographics Similar to Pakistanis by No Vehicles in Household
In terms of no vehicles in household, the demographic groups most similar to Pakistanis are Asian (9.0%, a difference of 0.040%), Yugoslavian (9.0%, a difference of 0.050%), Seminole (9.0%, a difference of 0.050%), Bulgarian (9.0%, a difference of 0.22%), and Slavic (9.0%, a difference of 0.28%).
| Demographics | Rating | Rank | No Vehicles in Household |
| Austrians | 98.9 /100 | #94 | Exceptional 8.8% |
| Potawatomi | 98.8 /100 | #95 | Exceptional 8.8% |
| Immigrants | Bolivia | 98.7 /100 | #96 | Exceptional 8.9% |
| Immigrants | Central America | 98.5 /100 | #97 | Exceptional 8.9% |
| Slavs | 98.4 /100 | #98 | Exceptional 9.0% |
| Bulgarians | 98.4 /100 | #99 | Exceptional 9.0% |
| Asians | 98.3 /100 | #100 | Exceptional 9.0% |
| Pakistanis | 98.3 /100 | #101 | Exceptional 9.0% |
| Yugoslavians | 98.3 /100 | #102 | Exceptional 9.0% |
| Seminole | 98.3 /100 | #103 | Exceptional 9.0% |
| Zimbabweans | 98.0 /100 | #104 | Exceptional 9.0% |
| Spanish Americans | 97.9 /100 | #105 | Exceptional 9.1% |
| Laotians | 97.8 /100 | #106 | Exceptional 9.1% |
| Hispanics or Latinos | 97.7 /100 | #107 | Exceptional 9.1% |
| Mexican American Indians | 97.6 /100 | #108 | Exceptional 9.1% |
Demographics Similar to Norwegians by No Vehicles in Household
In terms of no vehicles in household, the demographic groups most similar to Norwegians are English (6.5%, a difference of 1.1%), Danish (6.6%, a difference of 2.3%), Yakama (6.6%, a difference of 2.7%), German (6.7%, a difference of 3.7%), and Scottish (6.8%, a difference of 5.1%).
| Demographics | Rating | Rank | No Vehicles in Household |
| Luxembourgers | 100.0 /100 | #1 | Exceptional 5.4% |
| Norwegians | 100.0 /100 | #2 | Exceptional 6.4% |
| English | 100.0 /100 | #3 | Exceptional 6.5% |
| Danes | 100.0 /100 | #4 | Exceptional 6.6% |
| Yakama | 100.0 /100 | #5 | Exceptional 6.6% |
| Germans | 100.0 /100 | #6 | Exceptional 6.7% |
| Scottish | 100.0 /100 | #7 | Exceptional 6.8% |
| Swedes | 100.0 /100 | #8 | Exceptional 6.8% |
| Scotch-Irish | 100.0 /100 | #9 | Exceptional 6.8% |
| Dutch | 100.0 /100 | #10 | Exceptional 6.8% |
| Czechs | 100.0 /100 | #11 | Exceptional 6.9% |
| Assyrians/Chaldeans/Syriacs | 100.0 /100 | #12 | Exceptional 7.0% |
| Scandinavians | 100.0 /100 | #13 | Exceptional 7.0% |
| Mexicans | 100.0 /100 | #14 | Exceptional 7.0% |
| Whites/Caucasians | 100.0 /100 | #15 | Exceptional 7.0% |