Portuguese vs Immigrants from Poland 4 or more Vehicles in Household
COMPARE
Portuguese
Immigrants from Poland
4 or more Vehicles in Household
4 or more Vehicles in Household Comparison
Portuguese
Immigrants from Poland
7.4%
4 OR MORE VEHICLES IN HOUSEHOLD
99.9/ 100
METRIC RATING
73rd/ 347
METRIC RANK
5.8%
4 OR MORE VEHICLES IN HOUSEHOLD
3.8/ 100
METRIC RATING
240th/ 347
METRIC RANK
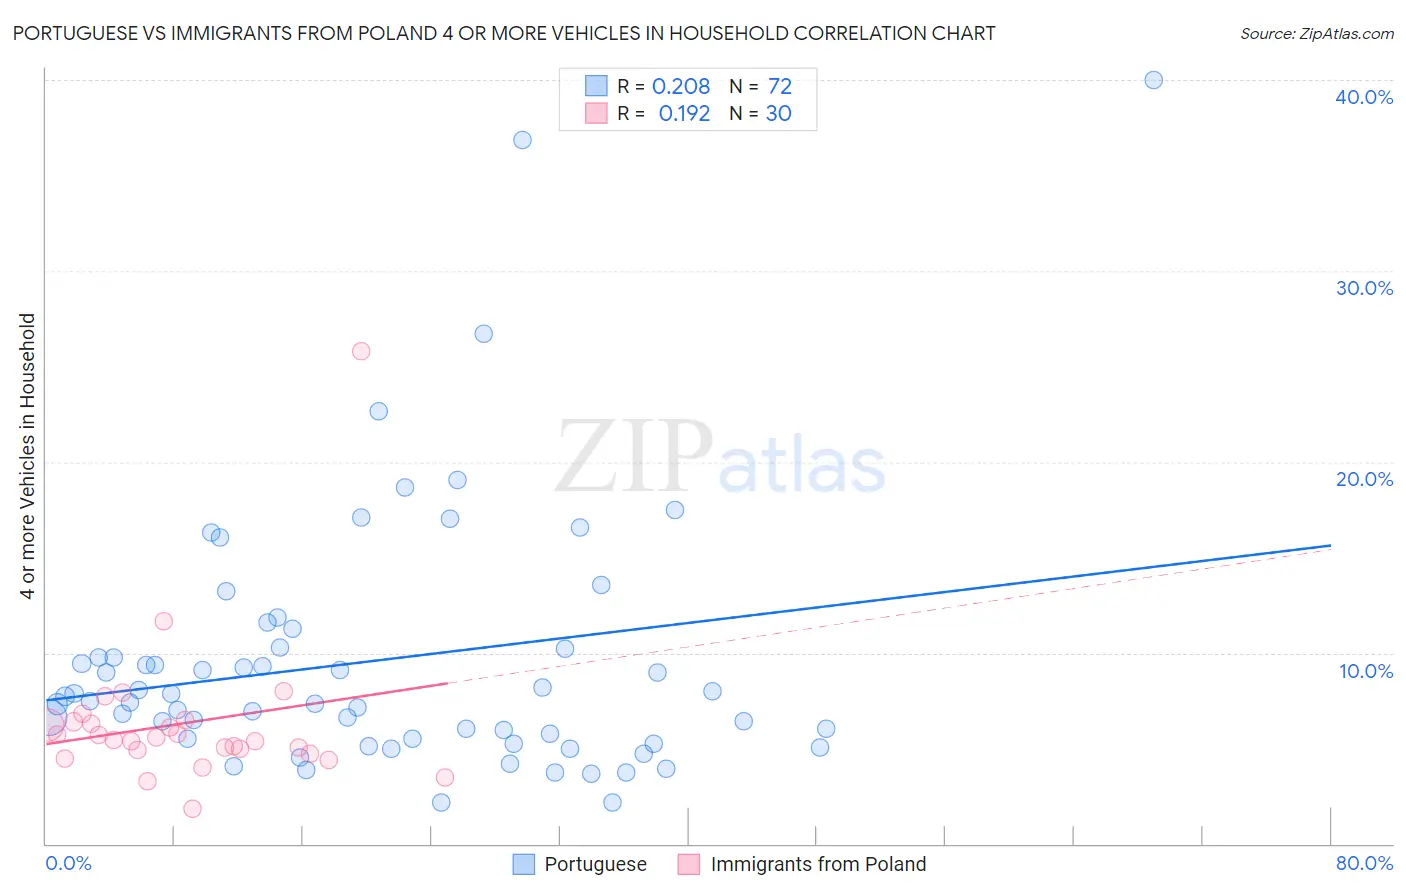
Portuguese vs Immigrants from Poland 4 or more Vehicles in Household Correlation Chart
The statistical analysis conducted on geographies consisting of 448,080,831 people shows a weak positive correlation between the proportion of Portuguese and percentage of households with 4 or more vehicles available in the United States with a correlation coefficient (R) of 0.208 and weighted average of 7.4%. Similarly, the statistical analysis conducted on geographies consisting of 303,514,746 people shows a poor positive correlation between the proportion of Immigrants from Poland and percentage of households with 4 or more vehicles available in the United States with a correlation coefficient (R) of 0.192 and weighted average of 5.8%, a difference of 27.6%.
4 or more Vehicles in Household Correlation Summary
| Measurement | Portuguese | Immigrants from Poland |
| Minimum | 2.1% | 1.8% |
| Maximum | 40.0% | 25.8% |
| Range | 37.9% | 24.0% |
| Mean | 9.6% | 6.3% |
| Median | 7.6% | 5.5% |
| Interquartile 25% (IQ1) | 5.5% | 4.9% |
| Interquartile 75% (IQ3) | 10.2% | 6.4% |
| Interquartile Range (IQR) | 4.8% | 1.5% |
| Standard Deviation (Sample) | 6.9% | 4.1% |
| Standard Deviation (Population) | 6.8% | 4.0% |
Similar Demographics by 4 or more Vehicles in Household
Demographics Similar to Portuguese by 4 or more Vehicles in Household
In terms of 4 or more vehicles in household, the demographic groups most similar to Portuguese are Scotch-Irish (7.4%, a difference of 0.090%), Icelander (7.4%, a difference of 0.30%), Immigrants from Cambodia (7.4%, a difference of 0.31%), Laotian (7.4%, a difference of 0.36%), and Chickasaw (7.4%, a difference of 0.39%).
| Demographics | Rating | Rank | 4 or more Vehicles in Household |
| Immigrants | Taiwan | 99.9 /100 | #66 | Exceptional 7.5% |
| Americans | 99.9 /100 | #67 | Exceptional 7.5% |
| Welsh | 99.9 /100 | #68 | Exceptional 7.5% |
| Germans | 99.9 /100 | #69 | Exceptional 7.5% |
| Scottish | 99.9 /100 | #70 | Exceptional 7.4% |
| Chickasaw | 99.9 /100 | #71 | Exceptional 7.4% |
| Scotch-Irish | 99.9 /100 | #72 | Exceptional 7.4% |
| Portuguese | 99.9 /100 | #73 | Exceptional 7.4% |
| Icelanders | 99.9 /100 | #74 | Exceptional 7.4% |
| Immigrants | Cambodia | 99.9 /100 | #75 | Exceptional 7.4% |
| Laotians | 99.9 /100 | #76 | Exceptional 7.4% |
| Apache | 99.9 /100 | #77 | Exceptional 7.4% |
| Whites/Caucasians | 99.8 /100 | #78 | Exceptional 7.4% |
| Czechs | 99.8 /100 | #79 | Exceptional 7.4% |
| Alaska Natives | 99.8 /100 | #80 | Exceptional 7.3% |
Demographics Similar to Immigrants from Poland by 4 or more Vehicles in Household
In terms of 4 or more vehicles in household, the demographic groups most similar to Immigrants from Poland are Immigrants from Australia (5.8%, a difference of 0.040%), Mongolian (5.8%, a difference of 0.090%), Immigrants from Belgium (5.8%, a difference of 0.13%), Turkish (5.8%, a difference of 0.26%), and Immigrants from Middle Africa (5.8%, a difference of 0.30%).
| Demographics | Rating | Rank | 4 or more Vehicles in Household |
| Sierra Leoneans | 6.0 /100 | #233 | Tragic 5.9% |
| Africans | 4.6 /100 | #234 | Tragic 5.8% |
| Immigrants | Hungary | 4.6 /100 | #235 | Tragic 5.8% |
| Immigrants | Eritrea | 4.5 /100 | #236 | Tragic 5.8% |
| Turks | 4.1 /100 | #237 | Tragic 5.8% |
| Immigrants | Belgium | 4.0 /100 | #238 | Tragic 5.8% |
| Immigrants | Australia | 3.8 /100 | #239 | Tragic 5.8% |
| Immigrants | Poland | 3.8 /100 | #240 | Tragic 5.8% |
| Mongolians | 3.7 /100 | #241 | Tragic 5.8% |
| Immigrants | Middle Africa | 3.4 /100 | #242 | Tragic 5.8% |
| Immigrants | Czechoslovakia | 3.2 /100 | #243 | Tragic 5.8% |
| Ethiopians | 3.2 /100 | #244 | Tragic 5.8% |
| Bulgarians | 3.1 /100 | #245 | Tragic 5.8% |
| Immigrants | North Macedonia | 2.5 /100 | #246 | Tragic 5.7% |
| Immigrants | Ethiopia | 2.4 /100 | #247 | Tragic 5.7% |