Osage vs Immigrants from Israel 4 or more Vehicles in Household
COMPARE
Osage
Immigrants from Israel
4 or more Vehicles in Household
4 or more Vehicles in Household Comparison
Osage
Immigrants from Israel
7.8%
4 OR MORE VEHICLES IN HOUSEHOLD
100.0/ 100
METRIC RATING
47th/ 347
METRIC RANK
4.8%
4 OR MORE VEHICLES IN HOUSEHOLD
0.0/ 100
METRIC RATING
313th/ 347
METRIC RANK
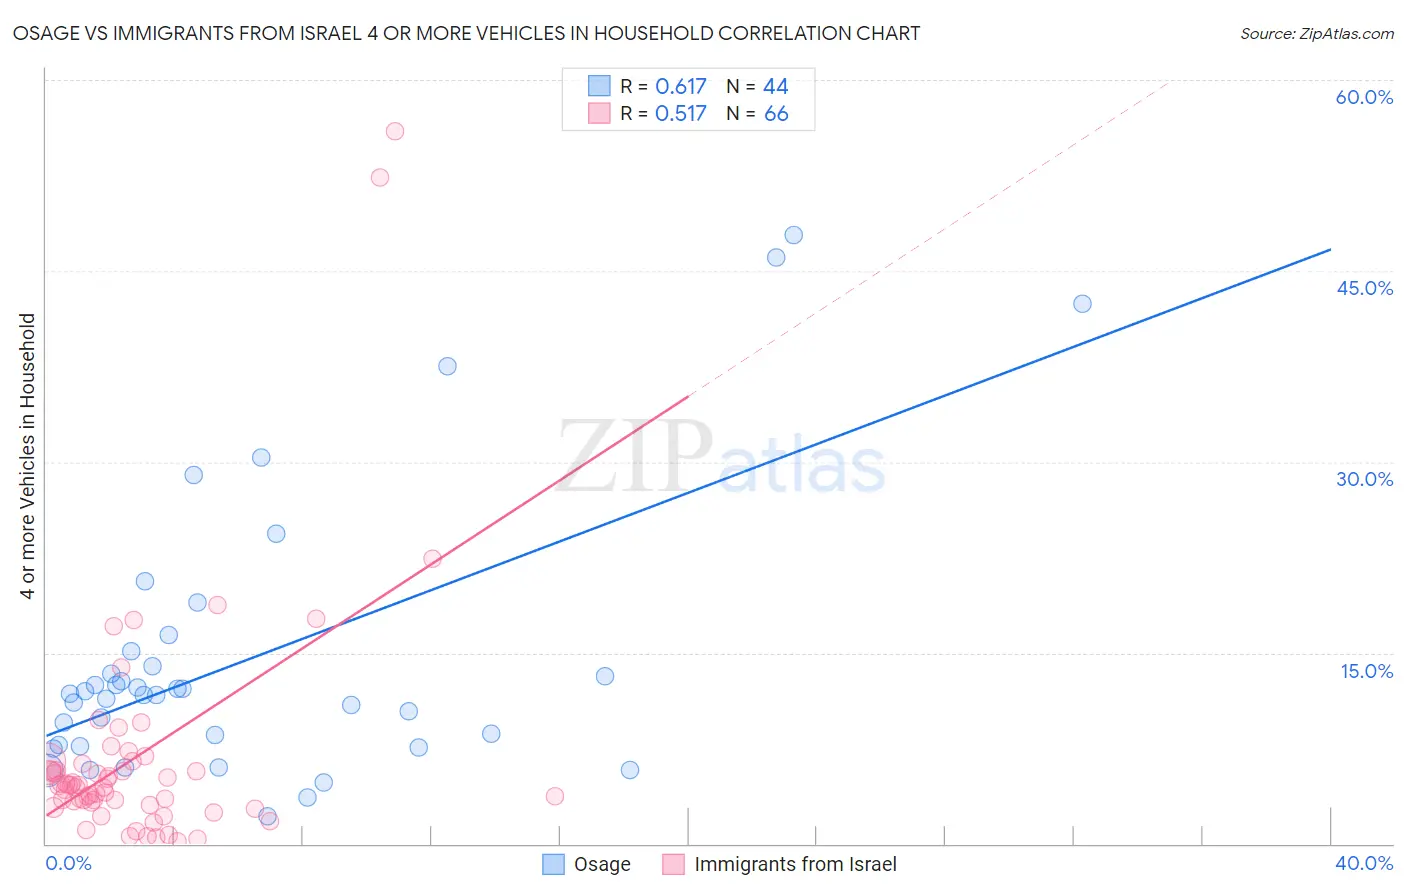
Osage vs Immigrants from Israel 4 or more Vehicles in Household Correlation Chart
The statistical analysis conducted on geographies consisting of 91,747,496 people shows a significant positive correlation between the proportion of Osage and percentage of households with 4 or more vehicles available in the United States with a correlation coefficient (R) of 0.617 and weighted average of 7.8%. Similarly, the statistical analysis conducted on geographies consisting of 208,870,296 people shows a substantial positive correlation between the proportion of Immigrants from Israel and percentage of households with 4 or more vehicles available in the United States with a correlation coefficient (R) of 0.517 and weighted average of 4.8%, a difference of 62.4%.
4 or more Vehicles in Household Correlation Summary
| Measurement | Osage | Immigrants from Israel |
| Minimum | 2.2% | 0.22% |
| Maximum | 47.8% | 55.9% |
| Range | 45.7% | 55.7% |
| Mean | 14.6% | 6.9% |
| Median | 11.7% | 4.6% |
| Interquartile 25% (IQ1) | 7.7% | 3.3% |
| Interquartile 75% (IQ3) | 14.6% | 6.3% |
| Interquartile Range (IQR) | 6.8% | 3.0% |
| Standard Deviation (Sample) | 11.0% | 9.6% |
| Standard Deviation (Population) | 10.9% | 9.5% |
Similar Demographics by 4 or more Vehicles in Household
Demographics Similar to Osage by 4 or more Vehicles in Household
In terms of 4 or more vehicles in household, the demographic groups most similar to Osage are Crow (7.8%, a difference of 0.16%), Swiss (7.8%, a difference of 0.17%), Choctaw (7.8%, a difference of 0.33%), Cherokee (7.7%, a difference of 0.36%), and Bhutanese (7.8%, a difference of 0.38%).
| Demographics | Rating | Rank | 4 or more Vehicles in Household |
| Spanish | 100.0 /100 | #40 | Exceptional 7.9% |
| Pima | 100.0 /100 | #41 | Exceptional 7.9% |
| Salvadorans | 100.0 /100 | #42 | Exceptional 7.8% |
| Fijians | 100.0 /100 | #43 | Exceptional 7.8% |
| Bhutanese | 100.0 /100 | #44 | Exceptional 7.8% |
| Choctaw | 100.0 /100 | #45 | Exceptional 7.8% |
| Crow | 100.0 /100 | #46 | Exceptional 7.8% |
| Osage | 100.0 /100 | #47 | Exceptional 7.8% |
| Swiss | 100.0 /100 | #48 | Exceptional 7.8% |
| Cherokee | 100.0 /100 | #49 | Exceptional 7.7% |
| Immigrants | El Salvador | 100.0 /100 | #50 | Exceptional 7.7% |
| Immigrants | Laos | 100.0 /100 | #51 | Exceptional 7.7% |
| Japanese | 100.0 /100 | #52 | Exceptional 7.7% |
| Malaysians | 100.0 /100 | #53 | Exceptional 7.7% |
| Dutch | 100.0 /100 | #54 | Exceptional 7.7% |
Demographics Similar to Immigrants from Israel by 4 or more Vehicles in Household
In terms of 4 or more vehicles in household, the demographic groups most similar to Immigrants from Israel are Albanian (4.8%, a difference of 0.010%), Immigrants from West Indies (4.7%, a difference of 0.79%), Immigrants from Belarus (4.7%, a difference of 0.88%), Puerto Rican (4.7%, a difference of 1.3%), and Houma (4.9%, a difference of 2.7%).
| Demographics | Rating | Rank | 4 or more Vehicles in Household |
| Immigrants | Serbia | 0.0 /100 | #306 | Tragic 5.0% |
| Menominee | 0.0 /100 | #307 | Tragic 5.0% |
| Paraguayans | 0.0 /100 | #308 | Tragic 4.9% |
| Immigrants | Somalia | 0.0 /100 | #309 | Tragic 4.9% |
| Moroccans | 0.0 /100 | #310 | Tragic 4.9% |
| Houma | 0.0 /100 | #311 | Tragic 4.9% |
| Albanians | 0.0 /100 | #312 | Tragic 4.8% |
| Immigrants | Israel | 0.0 /100 | #313 | Tragic 4.8% |
| Immigrants | West Indies | 0.0 /100 | #314 | Tragic 4.7% |
| Immigrants | Belarus | 0.0 /100 | #315 | Tragic 4.7% |
| Puerto Ricans | 0.0 /100 | #316 | Tragic 4.7% |
| U.S. Virgin Islanders | 0.0 /100 | #317 | Tragic 4.6% |
| Jamaicans | 0.0 /100 | #318 | Tragic 4.6% |
| Haitians | 0.0 /100 | #319 | Tragic 4.6% |
| Immigrants | Haiti | 0.0 /100 | #320 | Tragic 4.5% |