Northern European vs Osage 1 or more Vehicles in Household
COMPARE
Northern European
Osage
1 or more Vehicles in Household
1 or more Vehicles in Household Comparison
Northern Europeans
Osage
92.2%
1 OR MORE VEHICLES IN HOUSEHOLD
99.9/ 100
METRIC RATING
47th/ 347
METRIC RANK
91.4%
1 OR MORE VEHICLES IN HOUSEHOLD
99.2/ 100
METRIC RATING
86th/ 347
METRIC RANK
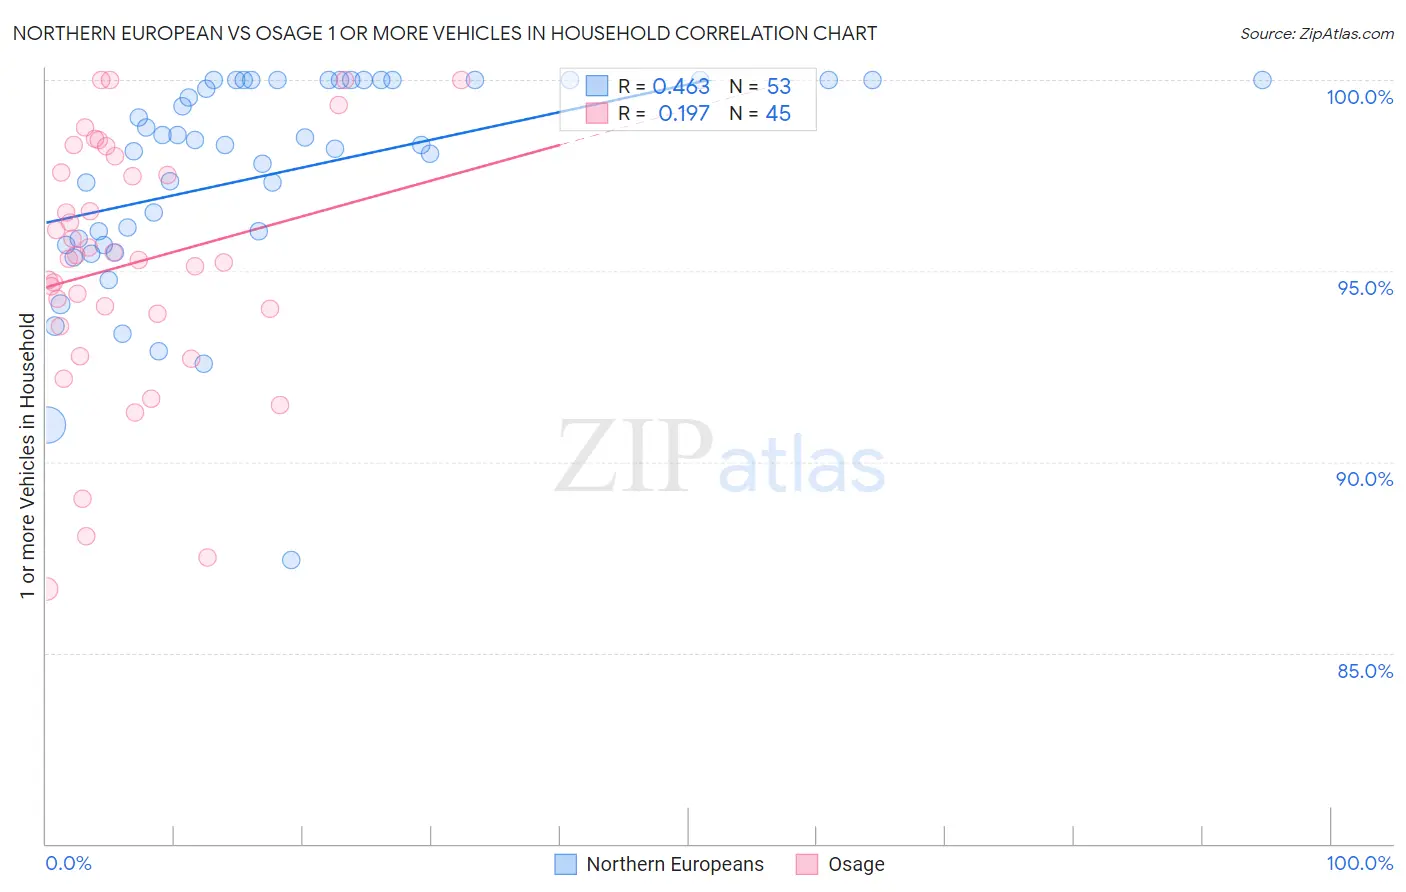
Northern European vs Osage 1 or more Vehicles in Household Correlation Chart
The statistical analysis conducted on geographies consisting of 405,964,648 people shows a moderate positive correlation between the proportion of Northern Europeans and percentage of households with 1 or more vehicles available in the United States with a correlation coefficient (R) of 0.463 and weighted average of 92.2%. Similarly, the statistical analysis conducted on geographies consisting of 91,799,602 people shows a poor positive correlation between the proportion of Osage and percentage of households with 1 or more vehicles available in the United States with a correlation coefficient (R) of 0.197 and weighted average of 91.4%, a difference of 0.88%.
1 or more Vehicles in Household Correlation Summary
| Measurement | Northern European | Osage |
| Minimum | 87.4% | 86.7% |
| Maximum | 100.0% | 100.0% |
| Range | 12.6% | 13.3% |
| Mean | 97.5% | 95.2% |
| Median | 98.3% | 95.3% |
| Interquartile 25% (IQ1) | 95.8% | 93.7% |
| Interquartile 75% (IQ3) | 100.0% | 97.8% |
| Interquartile Range (IQR) | 4.2% | 4.1% |
| Standard Deviation (Sample) | 2.8% | 3.3% |
| Standard Deviation (Population) | 2.7% | 3.3% |
Similar Demographics by 1 or more Vehicles in Household
Demographics Similar to Northern Europeans by 1 or more Vehicles in Household
In terms of 1 or more vehicles in household, the demographic groups most similar to Northern Europeans are Immigrants from Fiji (92.2%, a difference of 0.010%), Nonimmigrants (92.2%, a difference of 0.030%), Choctaw (92.2%, a difference of 0.050%), Chickasaw (92.3%, a difference of 0.070%), and Spanish (92.3%, a difference of 0.070%).
| Demographics | Rating | Rank | 1 or more Vehicles in Household |
| Creek | 99.9 /100 | #40 | Exceptional 92.3% |
| Immigrants | Taiwan | 99.9 /100 | #41 | Exceptional 92.3% |
| Chickasaw | 99.9 /100 | #42 | Exceptional 92.3% |
| Spanish | 99.9 /100 | #43 | Exceptional 92.3% |
| Choctaw | 99.9 /100 | #44 | Exceptional 92.2% |
| Immigrants | Nonimmigrants | 99.9 /100 | #45 | Exceptional 92.2% |
| Immigrants | Fiji | 99.9 /100 | #46 | Exceptional 92.2% |
| Northern Europeans | 99.9 /100 | #47 | Exceptional 92.2% |
| Belgians | 99.9 /100 | #48 | Exceptional 92.1% |
| Afghans | 99.9 /100 | #49 | Exceptional 92.1% |
| Guamanians/Chamorros | 99.9 /100 | #50 | Exceptional 92.1% |
| Celtics | 99.9 /100 | #51 | Exceptional 92.1% |
| Koreans | 99.9 /100 | #52 | Exceptional 92.1% |
| Hawaiians | 99.9 /100 | #53 | Exceptional 92.0% |
| Slovenes | 99.9 /100 | #54 | Exceptional 92.0% |
Demographics Similar to Osage by 1 or more Vehicles in Household
In terms of 1 or more vehicles in household, the demographic groups most similar to Osage are Immigrants from Germany (91.4%, a difference of 0.010%), Spanish American (91.4%, a difference of 0.010%), Bangladeshi (91.4%, a difference of 0.010%), Tsimshian (91.4%, a difference of 0.020%), and Immigrants from Canada (91.4%, a difference of 0.020%).
| Demographics | Rating | Rank | 1 or more Vehicles in Household |
| Immigrants | South Central Asia | 99.4 /100 | #79 | Exceptional 91.5% |
| Bolivians | 99.4 /100 | #80 | Exceptional 91.5% |
| Immigrants | South Eastern Asia | 99.3 /100 | #81 | Exceptional 91.4% |
| Lebanese | 99.3 /100 | #82 | Exceptional 91.4% |
| Immigrants | England | 99.3 /100 | #83 | Exceptional 91.4% |
| Jordanians | 99.3 /100 | #84 | Exceptional 91.4% |
| Tsimshian | 99.3 /100 | #85 | Exceptional 91.4% |
| Osage | 99.2 /100 | #86 | Exceptional 91.4% |
| Immigrants | Germany | 99.2 /100 | #87 | Exceptional 91.4% |
| Spanish Americans | 99.2 /100 | #88 | Exceptional 91.4% |
| Bangladeshis | 99.2 /100 | #89 | Exceptional 91.4% |
| Immigrants | Canada | 99.2 /100 | #90 | Exceptional 91.4% |
| Immigrants | Jordan | 99.2 /100 | #91 | Exceptional 91.4% |
| Bhutanese | 99.2 /100 | #92 | Exceptional 91.4% |
| Immigrants | North America | 99.2 /100 | #93 | Exceptional 91.4% |