Nonimmigrants vs Immigrants from Malaysia No Vehicles in Household
COMPARE
Nonimmigrants
Immigrants from Malaysia
No Vehicles in Household
No Vehicles in Household Comparison
Nonimmigrants
Immigrants from Malaysia
7.9%
NO VEHICLES IN HOUSEHOLD
99.9/ 100
METRIC RATING
45th/ 347
METRIC RANK
13.6%
NO VEHICLES IN HOUSEHOLD
0.0/ 100
METRIC RATING
284th/ 347
METRIC RANK
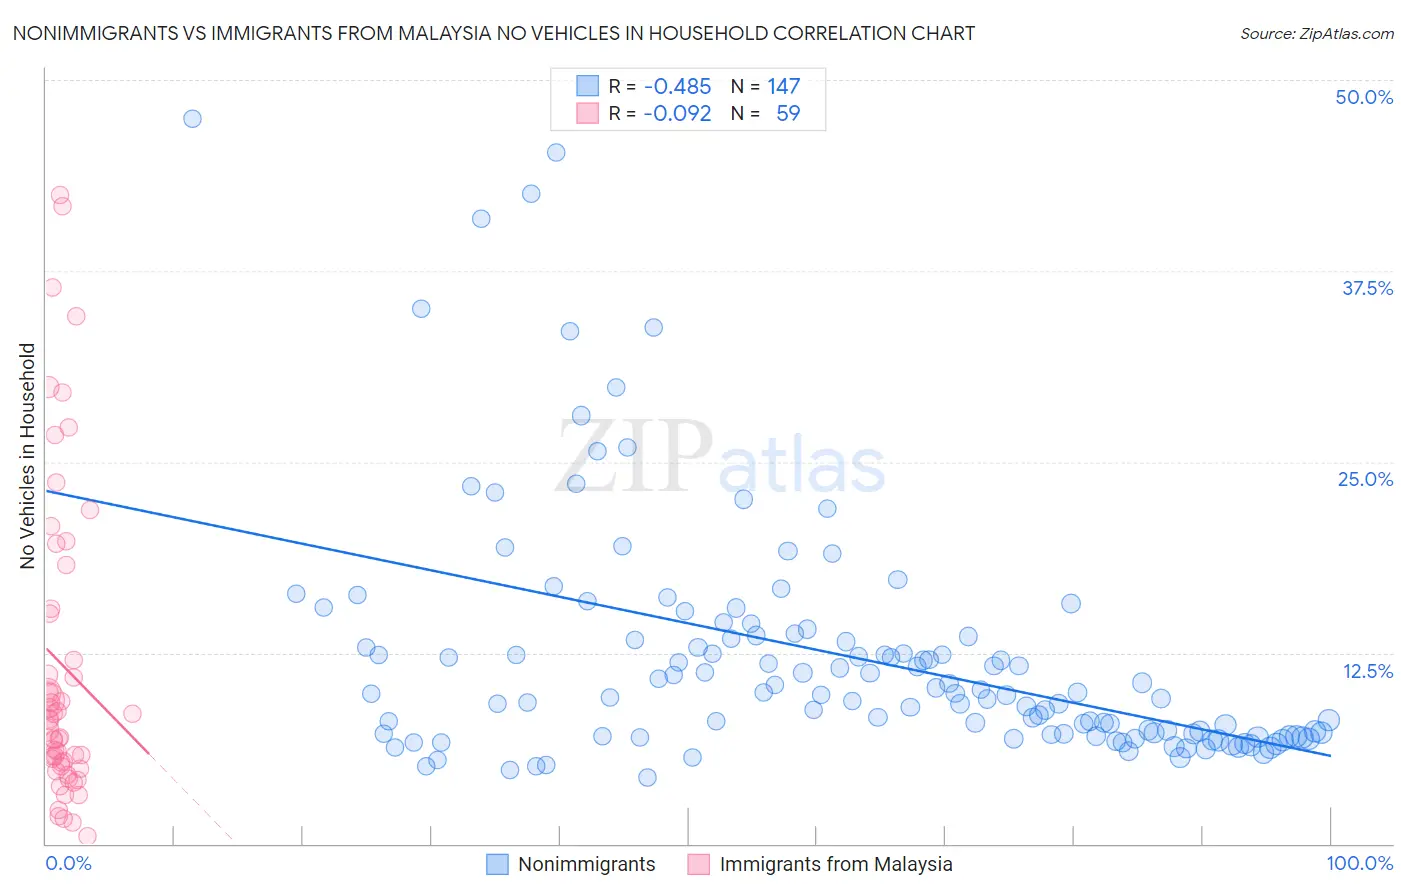
Nonimmigrants vs Immigrants from Malaysia No Vehicles in Household Correlation Chart
The statistical analysis conducted on geographies consisting of 566,903,421 people shows a moderate negative correlation between the proportion of Nonimmigrants and percentage of households with no vehicle available in the United States with a correlation coefficient (R) of -0.485 and weighted average of 7.9%. Similarly, the statistical analysis conducted on geographies consisting of 197,816,578 people shows a slight negative correlation between the proportion of Immigrants from Malaysia and percentage of households with no vehicle available in the United States with a correlation coefficient (R) of -0.092 and weighted average of 13.6%, a difference of 72.0%.
No Vehicles in Household Correlation Summary
| Measurement | Nonimmigrants | Immigrants from Malaysia |
| Minimum | 4.3% | 0.50% |
| Maximum | 47.4% | 42.5% |
| Range | 43.1% | 42.0% |
| Mean | 12.3% | 11.7% |
| Median | 9.8% | 8.1% |
| Interquartile 25% (IQ1) | 7.1% | 5.1% |
| Interquartile 75% (IQ3) | 13.6% | 15.4% |
| Interquartile Range (IQR) | 6.5% | 10.3% |
| Standard Deviation (Sample) | 8.0% | 10.4% |
| Standard Deviation (Population) | 8.0% | 10.3% |
Similar Demographics by No Vehicles in Household
Demographics Similar to Nonimmigrants by No Vehicles in Household
In terms of no vehicles in household, the demographic groups most similar to Nonimmigrants are Choctaw (7.9%, a difference of 0.17%), Spanish (7.9%, a difference of 0.26%), Northern European (7.9%, a difference of 0.38%), Chickasaw (7.9%, a difference of 0.53%), and Swiss (7.9%, a difference of 0.61%).
| Demographics | Rating | Rank | No Vehicles in Household |
| Creek | 99.9 /100 | #38 | Exceptional 7.8% |
| Immigrants | Fiji | 99.9 /100 | #39 | Exceptional 7.8% |
| Czechoslovakians | 99.9 /100 | #40 | Exceptional 7.8% |
| French Canadians | 99.9 /100 | #41 | Exceptional 7.8% |
| Swiss | 99.9 /100 | #42 | Exceptional 7.9% |
| Chickasaw | 99.9 /100 | #43 | Exceptional 7.9% |
| Choctaw | 99.9 /100 | #44 | Exceptional 7.9% |
| Immigrants | Nonimmigrants | 99.9 /100 | #45 | Exceptional 7.9% |
| Spanish | 99.9 /100 | #46 | Exceptional 7.9% |
| Northern Europeans | 99.9 /100 | #47 | Exceptional 7.9% |
| Afghans | 99.9 /100 | #48 | Exceptional 8.0% |
| Guamanians/Chamorros | 99.9 /100 | #49 | Exceptional 8.0% |
| Belgians | 99.9 /100 | #50 | Exceptional 8.0% |
| Koreans | 99.9 /100 | #51 | Exceptional 8.0% |
| Hawaiians | 99.9 /100 | #52 | Exceptional 8.0% |
Demographics Similar to Immigrants from Malaysia by No Vehicles in Household
In terms of no vehicles in household, the demographic groups most similar to Immigrants from Malaysia are Immigrants from Eastern Europe (13.6%, a difference of 0.050%), Immigrants from Kazakhstan (13.6%, a difference of 0.24%), Immigrants from Eastern Asia (13.5%, a difference of 0.28%), Colville (13.7%, a difference of 0.71%), and Immigrants from Ireland (13.7%, a difference of 0.92%).
| Demographics | Rating | Rank | No Vehicles in Household |
| Aleuts | 0.1 /100 | #277 | Tragic 13.0% |
| Immigrants | Croatia | 0.1 /100 | #278 | Tragic 13.0% |
| Mongolians | 0.0 /100 | #279 | Tragic 13.1% |
| Alsatians | 0.0 /100 | #280 | Tragic 13.2% |
| Central American Indians | 0.0 /100 | #281 | Tragic 13.3% |
| Immigrants | Eastern Asia | 0.0 /100 | #282 | Tragic 13.5% |
| Immigrants | Kazakhstan | 0.0 /100 | #283 | Tragic 13.6% |
| Immigrants | Malaysia | 0.0 /100 | #284 | Tragic 13.6% |
| Immigrants | Eastern Europe | 0.0 /100 | #285 | Tragic 13.6% |
| Colville | 0.0 /100 | #286 | Tragic 13.7% |
| Immigrants | Ireland | 0.0 /100 | #287 | Tragic 13.7% |
| Hopi | 0.0 /100 | #288 | Tragic 13.7% |
| Immigrants | Australia | 0.0 /100 | #289 | Tragic 13.8% |
| Indians (Asian) | 0.0 /100 | #290 | Tragic 14.1% |
| Okinawans | 0.0 /100 | #291 | Tragic 14.1% |