Nonimmigrants vs Armenian No Vehicles in Household
COMPARE
Nonimmigrants
Armenian
No Vehicles in Household
No Vehicles in Household Comparison
Nonimmigrants
Armenians
7.9%
NO VEHICLES IN HOUSEHOLD
99.9/ 100
METRIC RATING
45th/ 347
METRIC RANK
9.4%
NO VEHICLES IN HOUSEHOLD
95.0/ 100
METRIC RATING
112th/ 347
METRIC RANK
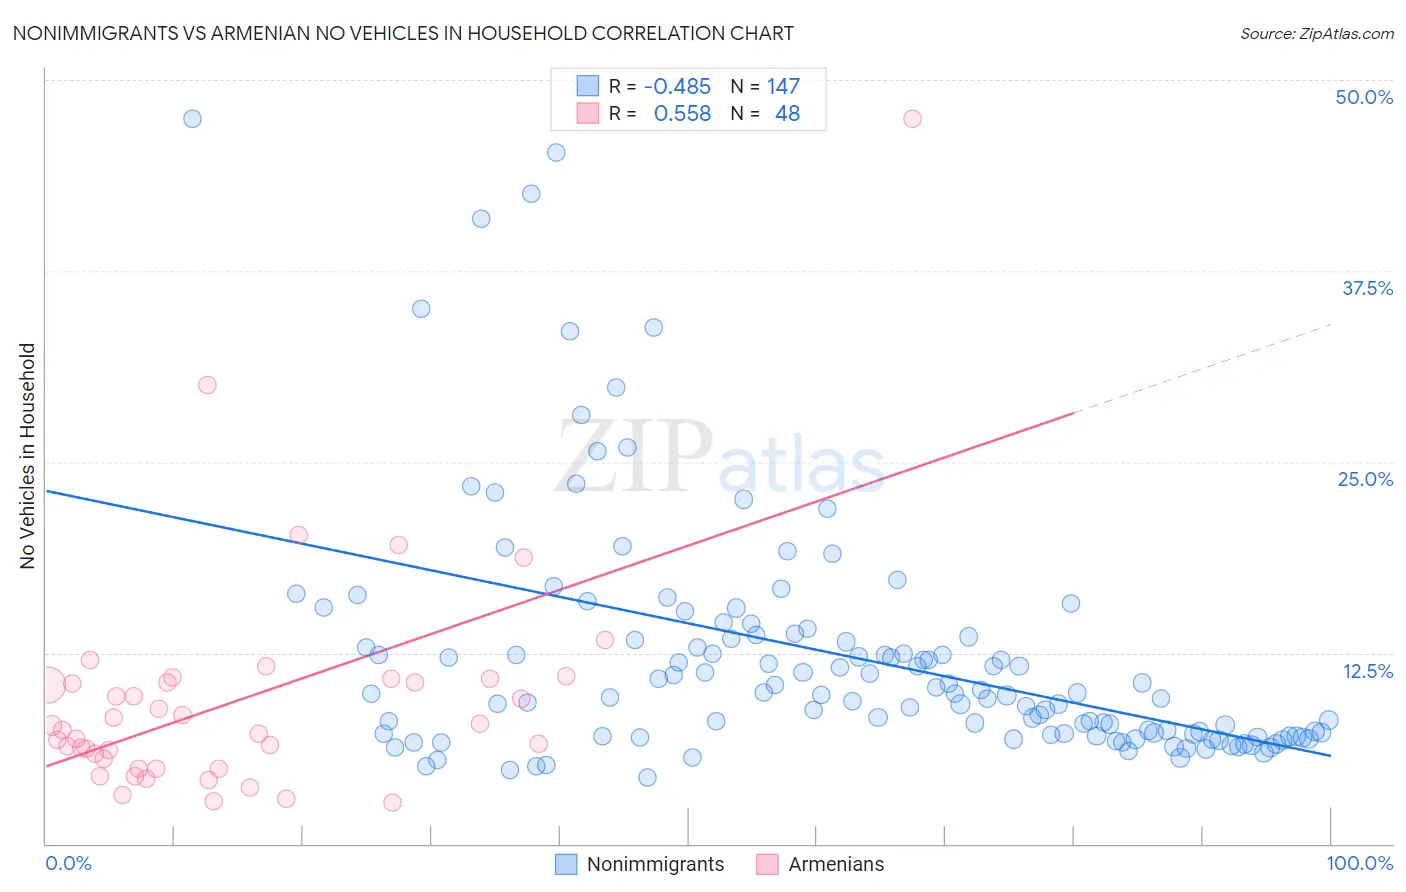
Nonimmigrants vs Armenian No Vehicles in Household Correlation Chart
The statistical analysis conducted on geographies consisting of 566,903,421 people shows a moderate negative correlation between the proportion of Nonimmigrants and percentage of households with no vehicle available in the United States with a correlation coefficient (R) of -0.485 and weighted average of 7.9%. Similarly, the statistical analysis conducted on geographies consisting of 310,342,766 people shows a substantial positive correlation between the proportion of Armenians and percentage of households with no vehicle available in the United States with a correlation coefficient (R) of 0.558 and weighted average of 9.4%, a difference of 18.6%.
No Vehicles in Household Correlation Summary
| Measurement | Nonimmigrants | Armenian |
| Minimum | 4.3% | 2.7% |
| Maximum | 47.4% | 47.4% |
| Range | 43.1% | 44.7% |
| Mean | 12.3% | 9.4% |
| Median | 9.8% | 7.6% |
| Interquartile 25% (IQ1) | 7.1% | 5.2% |
| Interquartile 75% (IQ3) | 13.6% | 10.7% |
| Interquartile Range (IQR) | 6.5% | 5.4% |
| Standard Deviation (Sample) | 8.0% | 7.6% |
| Standard Deviation (Population) | 8.0% | 7.5% |
Similar Demographics by No Vehicles in Household
Demographics Similar to Nonimmigrants by No Vehicles in Household
In terms of no vehicles in household, the demographic groups most similar to Nonimmigrants are Choctaw (7.9%, a difference of 0.17%), Spanish (7.9%, a difference of 0.26%), Northern European (7.9%, a difference of 0.38%), Chickasaw (7.9%, a difference of 0.53%), and Swiss (7.9%, a difference of 0.61%).
| Demographics | Rating | Rank | No Vehicles in Household |
| Creek | 99.9 /100 | #38 | Exceptional 7.8% |
| Immigrants | Fiji | 99.9 /100 | #39 | Exceptional 7.8% |
| Czechoslovakians | 99.9 /100 | #40 | Exceptional 7.8% |
| French Canadians | 99.9 /100 | #41 | Exceptional 7.8% |
| Swiss | 99.9 /100 | #42 | Exceptional 7.9% |
| Chickasaw | 99.9 /100 | #43 | Exceptional 7.9% |
| Choctaw | 99.9 /100 | #44 | Exceptional 7.9% |
| Immigrants | Nonimmigrants | 99.9 /100 | #45 | Exceptional 7.9% |
| Spanish | 99.9 /100 | #46 | Exceptional 7.9% |
| Northern Europeans | 99.9 /100 | #47 | Exceptional 7.9% |
| Afghans | 99.9 /100 | #48 | Exceptional 8.0% |
| Guamanians/Chamorros | 99.9 /100 | #49 | Exceptional 8.0% |
| Belgians | 99.9 /100 | #50 | Exceptional 8.0% |
| Koreans | 99.9 /100 | #51 | Exceptional 8.0% |
| Hawaiians | 99.9 /100 | #52 | Exceptional 8.0% |
Demographics Similar to Armenians by No Vehicles in Household
In terms of no vehicles in household, the demographic groups most similar to Armenians are Immigrants from Kuwait (9.4%, a difference of 0.090%), Immigrants from Netherlands (9.4%, a difference of 0.10%), Serbian (9.4%, a difference of 0.52%), Navajo (9.4%, a difference of 0.59%), and Japanese (9.4%, a difference of 0.66%).
| Demographics | Rating | Rank | No Vehicles in Household |
| Spanish Americans | 97.9 /100 | #105 | Exceptional 9.1% |
| Laotians | 97.8 /100 | #106 | Exceptional 9.1% |
| Hispanics or Latinos | 97.7 /100 | #107 | Exceptional 9.1% |
| Mexican American Indians | 97.6 /100 | #108 | Exceptional 9.1% |
| Maltese | 97.6 /100 | #109 | Exceptional 9.1% |
| Delaware | 97.2 /100 | #110 | Exceptional 9.2% |
| Immigrants | Kuwait | 95.1 /100 | #111 | Exceptional 9.4% |
| Armenians | 95.0 /100 | #112 | Exceptional 9.4% |
| Immigrants | Netherlands | 94.8 /100 | #113 | Exceptional 9.4% |
| Serbians | 94.3 /100 | #114 | Exceptional 9.4% |
| Navajo | 94.2 /100 | #115 | Exceptional 9.4% |
| Japanese | 94.1 /100 | #116 | Exceptional 9.4% |
| Chippewa | 93.8 /100 | #117 | Exceptional 9.4% |
| Greeks | 92.9 /100 | #118 | Exceptional 9.5% |
| Fijians | 92.7 /100 | #119 | Exceptional 9.5% |