Native Hawaiian vs French Canadian No Vehicles in Household
COMPARE
Native Hawaiian
French Canadian
No Vehicles in Household
No Vehicles in Household Comparison
Native Hawaiians
French Canadians
7.7%
NO VEHICLES IN HOUSEHOLD
100.0/ 100
METRIC RATING
31st/ 347
METRIC RANK
7.8%
NO VEHICLES IN HOUSEHOLD
99.9/ 100
METRIC RATING
41st/ 347
METRIC RANK
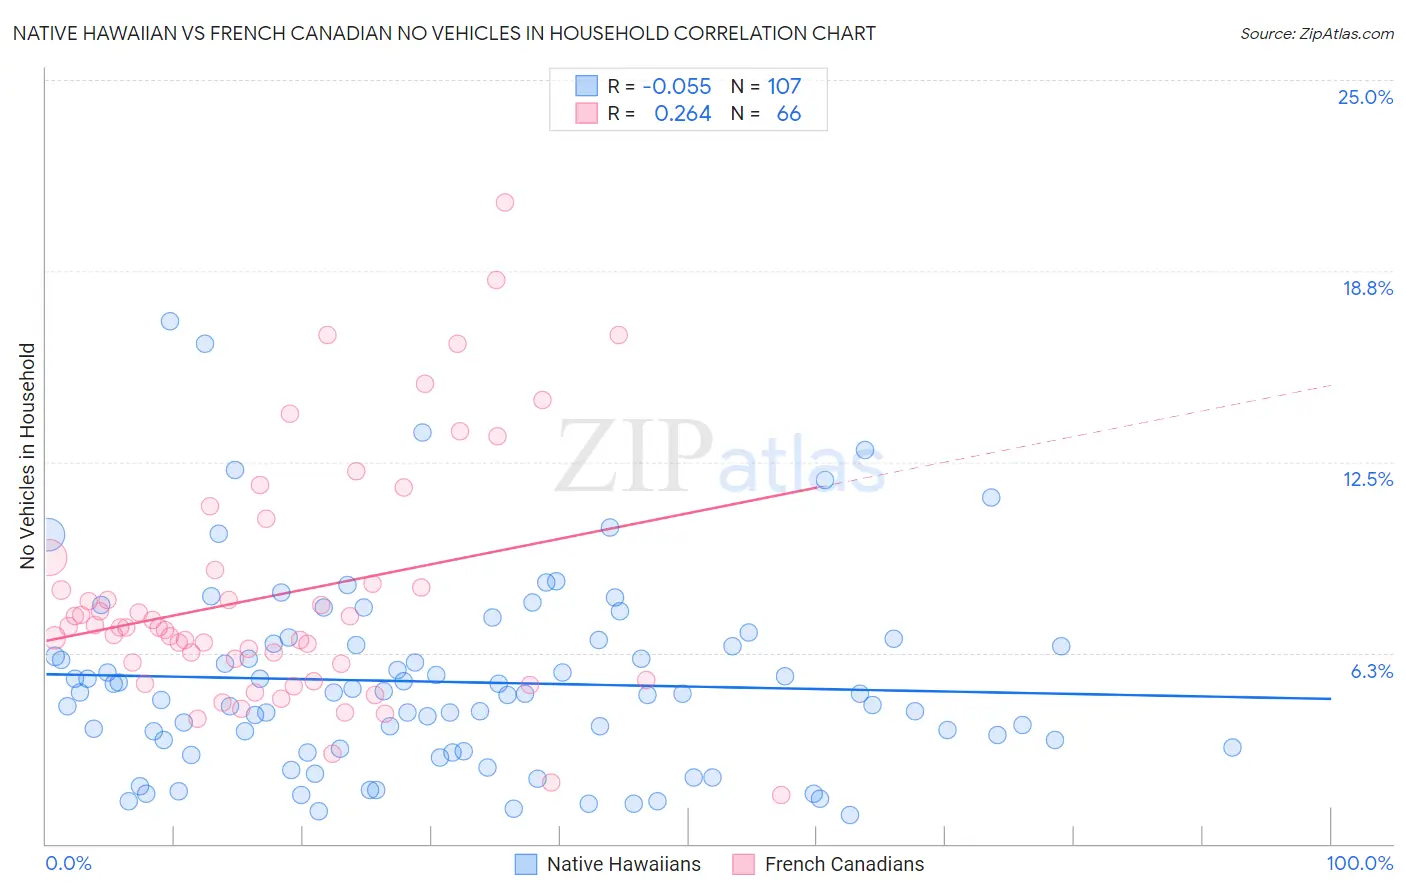
Native Hawaiian vs French Canadian No Vehicles in Household Correlation Chart
The statistical analysis conducted on geographies consisting of 331,304,128 people shows a slight negative correlation between the proportion of Native Hawaiians and percentage of households with no vehicle available in the United States with a correlation coefficient (R) of -0.055 and weighted average of 7.7%. Similarly, the statistical analysis conducted on geographies consisting of 499,834,942 people shows a weak positive correlation between the proportion of French Canadians and percentage of households with no vehicle available in the United States with a correlation coefficient (R) of 0.264 and weighted average of 7.8%, a difference of 2.0%.
No Vehicles in Household Correlation Summary
| Measurement | Native Hawaiian | French Canadian |
| Minimum | 0.92% | 1.6% |
| Maximum | 17.1% | 21.0% |
| Range | 16.2% | 19.4% |
| Mean | 5.3% | 8.2% |
| Median | 4.9% | 7.1% |
| Interquartile 25% (IQ1) | 3.1% | 5.9% |
| Interquartile 75% (IQ3) | 6.5% | 8.9% |
| Interquartile Range (IQR) | 3.4% | 3.1% |
| Standard Deviation (Sample) | 3.1% | 4.0% |
| Standard Deviation (Population) | 3.1% | 3.9% |
Demographics Similar to Native Hawaiians and French Canadians by No Vehicles in Household
In terms of no vehicles in household, the demographic groups most similar to Native Hawaiians are Finnish (7.7%, a difference of 0.15%), Malaysian (7.7%, a difference of 0.25%), Immigrants from Taiwan (7.7%, a difference of 0.36%), American (7.7%, a difference of 0.45%), and Immigrants from Vietnam (7.7%, a difference of 0.49%). Similarly, the demographic groups most similar to French Canadians are Czechoslovakian (7.8%, a difference of 0.14%), Swiss (7.9%, a difference of 0.14%), Chickasaw (7.9%, a difference of 0.21%), Immigrants from Fiji (7.8%, a difference of 0.24%), and Choctaw (7.9%, a difference of 0.57%).
| Demographics | Rating | Rank | No Vehicles in Household |
| Sri Lankans | 100.0 /100 | #26 | Exceptional 7.6% |
| British | 100.0 /100 | #27 | Exceptional 7.6% |
| Samoans | 100.0 /100 | #28 | Exceptional 7.6% |
| Americans | 100.0 /100 | #29 | Exceptional 7.7% |
| Finns | 100.0 /100 | #30 | Exceptional 7.7% |
| Native Hawaiians | 100.0 /100 | #31 | Exceptional 7.7% |
| Malaysians | 100.0 /100 | #32 | Exceptional 7.7% |
| Immigrants | Taiwan | 100.0 /100 | #33 | Exceptional 7.7% |
| Immigrants | Vietnam | 100.0 /100 | #34 | Exceptional 7.7% |
| Cherokee | 99.9 /100 | #35 | Exceptional 7.7% |
| Iraqis | 99.9 /100 | #36 | Exceptional 7.7% |
| Basques | 99.9 /100 | #37 | Exceptional 7.8% |
| Creek | 99.9 /100 | #38 | Exceptional 7.8% |
| Immigrants | Fiji | 99.9 /100 | #39 | Exceptional 7.8% |
| Czechoslovakians | 99.9 /100 | #40 | Exceptional 7.8% |
| French Canadians | 99.9 /100 | #41 | Exceptional 7.8% |
| Swiss | 99.9 /100 | #42 | Exceptional 7.9% |
| Chickasaw | 99.9 /100 | #43 | Exceptional 7.9% |
| Choctaw | 99.9 /100 | #44 | Exceptional 7.9% |
| Immigrants | Nonimmigrants | 99.9 /100 | #45 | Exceptional 7.9% |
| Spanish | 99.9 /100 | #46 | Exceptional 7.9% |