Luxembourger vs Immigrants from Yemen No Vehicles in Household
COMPARE
Luxembourger
Immigrants from Yemen
No Vehicles in Household
No Vehicles in Household Comparison
Luxembourgers
Immigrants from Yemen
5.4%
NO VEHICLES IN HOUSEHOLD
100.0/ 100
METRIC RATING
1st/ 347
METRIC RANK
19.5%
NO VEHICLES IN HOUSEHOLD
0.0/ 100
METRIC RATING
323rd/ 347
METRIC RANK
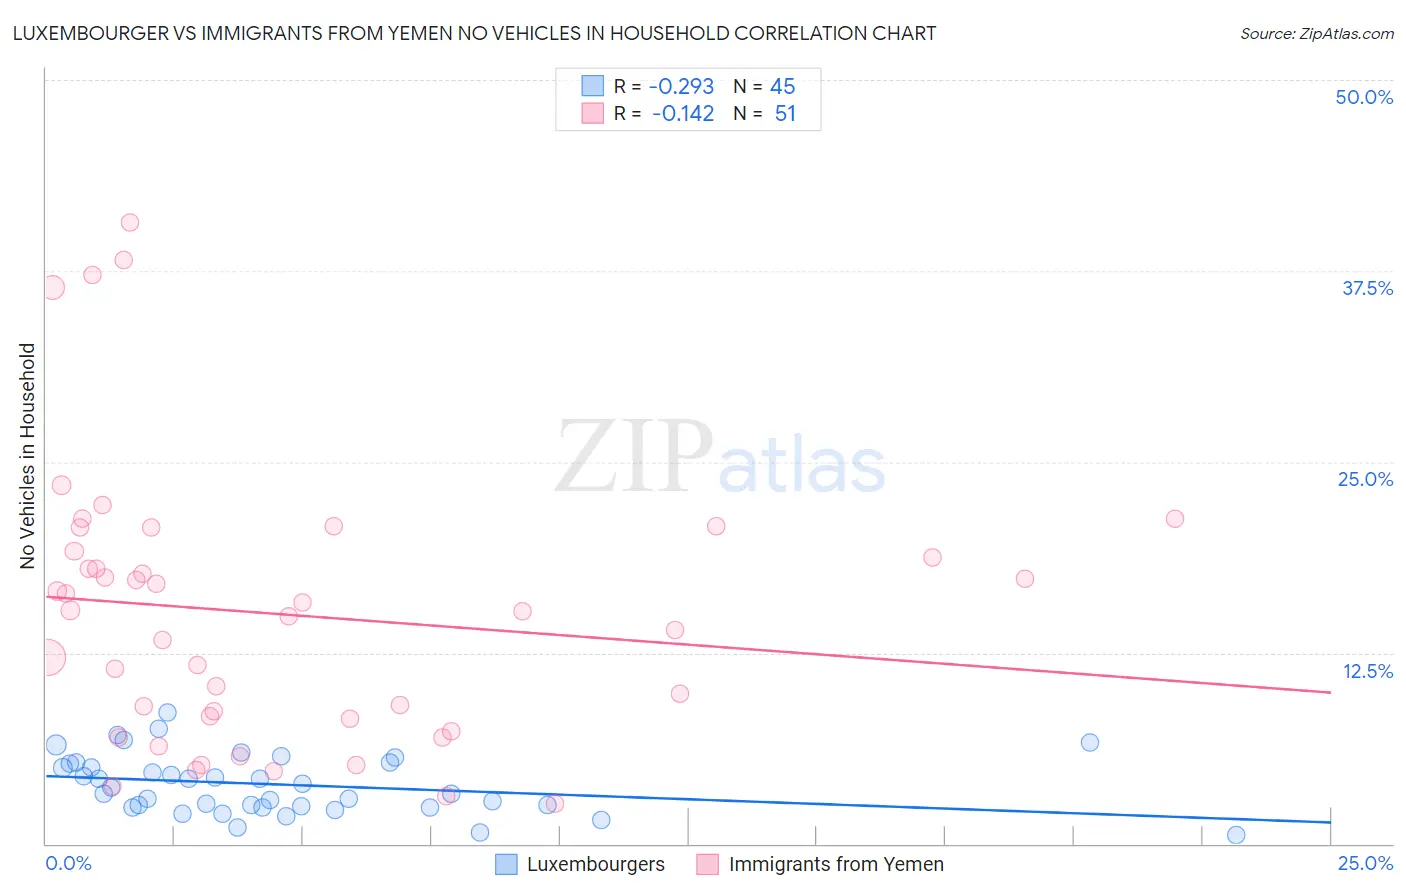
Luxembourger vs Immigrants from Yemen No Vehicles in Household Correlation Chart
The statistical analysis conducted on geographies consisting of 11,375,262 people shows a weak negative correlation between the proportion of Luxembourgers and percentage of households with no vehicle available in the United States with a correlation coefficient (R) of -0.293 and weighted average of 5.4%. Similarly, the statistical analysis conducted on geographies consisting of 82,433,611 people shows a poor negative correlation between the proportion of Immigrants from Yemen and percentage of households with no vehicle available in the United States with a correlation coefficient (R) of -0.142 and weighted average of 19.5%, a difference of 263.6%.
No Vehicles in Household Correlation Summary
| Measurement | Luxembourger | Immigrants from Yemen |
| Minimum | 0.55% | 2.6% |
| Maximum | 8.6% | 40.7% |
| Range | 8.0% | 38.1% |
| Mean | 3.9% | 15.0% |
| Median | 3.7% | 15.2% |
| Interquartile 25% (IQ1) | 2.4% | 8.2% |
| Interquartile 75% (IQ3) | 5.3% | 19.2% |
| Interquartile Range (IQR) | 2.9% | 11.0% |
| Standard Deviation (Sample) | 1.9% | 9.0% |
| Standard Deviation (Population) | 1.9% | 8.9% |
Similar Demographics by No Vehicles in Household
Demographics Similar to Luxembourgers by No Vehicles in Household
In terms of no vehicles in household, the demographic groups most similar to Luxembourgers are Norwegian (6.4%, a difference of 20.2%), English (6.5%, a difference of 21.5%), Danish (6.6%, a difference of 23.0%), Yakama (6.6%, a difference of 23.4%), and German (6.7%, a difference of 24.6%).
| Demographics | Rating | Rank | No Vehicles in Household |
| Luxembourgers | 100.0 /100 | #1 | Exceptional 5.4% |
| Norwegians | 100.0 /100 | #2 | Exceptional 6.4% |
| English | 100.0 /100 | #3 | Exceptional 6.5% |
| Danes | 100.0 /100 | #4 | Exceptional 6.6% |
| Yakama | 100.0 /100 | #5 | Exceptional 6.6% |
| Germans | 100.0 /100 | #6 | Exceptional 6.7% |
| Scottish | 100.0 /100 | #7 | Exceptional 6.8% |
| Swedes | 100.0 /100 | #8 | Exceptional 6.8% |
| Scotch-Irish | 100.0 /100 | #9 | Exceptional 6.8% |
| Dutch | 100.0 /100 | #10 | Exceptional 6.8% |
| Czechs | 100.0 /100 | #11 | Exceptional 6.9% |
| Assyrians/Chaldeans/Syriacs | 100.0 /100 | #12 | Exceptional 7.0% |
| Scandinavians | 100.0 /100 | #13 | Exceptional 7.0% |
| Mexicans | 100.0 /100 | #14 | Exceptional 7.0% |
| Whites/Caucasians | 100.0 /100 | #15 | Exceptional 7.0% |
Demographics Similar to Immigrants from Yemen by No Vehicles in Household
In terms of no vehicles in household, the demographic groups most similar to Immigrants from Yemen are Immigrants from Caribbean (19.6%, a difference of 0.73%), Senegalese (19.8%, a difference of 1.5%), Immigrants from West Indies (20.5%, a difference of 5.5%), Immigrants from Cabo Verde (18.4%, a difference of 5.6%), and Jamaican (17.9%, a difference of 8.6%).
| Demographics | Rating | Rank | No Vehicles in Household |
| Ghanaians | 0.0 /100 | #316 | Tragic 16.4% |
| Immigrants | Ghana | 0.0 /100 | #317 | Tragic 16.6% |
| Immigrants | Belarus | 0.0 /100 | #318 | Tragic 16.7% |
| Alaska Natives | 0.0 /100 | #319 | Tragic 17.4% |
| Soviet Union | 0.0 /100 | #320 | Tragic 17.4% |
| Jamaicans | 0.0 /100 | #321 | Tragic 17.9% |
| Immigrants | Cabo Verde | 0.0 /100 | #322 | Tragic 18.4% |
| Immigrants | Yemen | 0.0 /100 | #323 | Tragic 19.5% |
| Immigrants | Caribbean | 0.0 /100 | #324 | Tragic 19.6% |
| Senegalese | 0.0 /100 | #325 | Tragic 19.8% |
| Immigrants | West Indies | 0.0 /100 | #326 | Tragic 20.5% |
| Immigrants | Senegal | 0.0 /100 | #327 | Tragic 21.1% |
| Immigrants | Dominica | 0.0 /100 | #328 | Tragic 22.2% |
| Ecuadorians | 0.0 /100 | #329 | Tragic 22.8% |
| West Indians | 0.0 /100 | #330 | Tragic 23.7% |