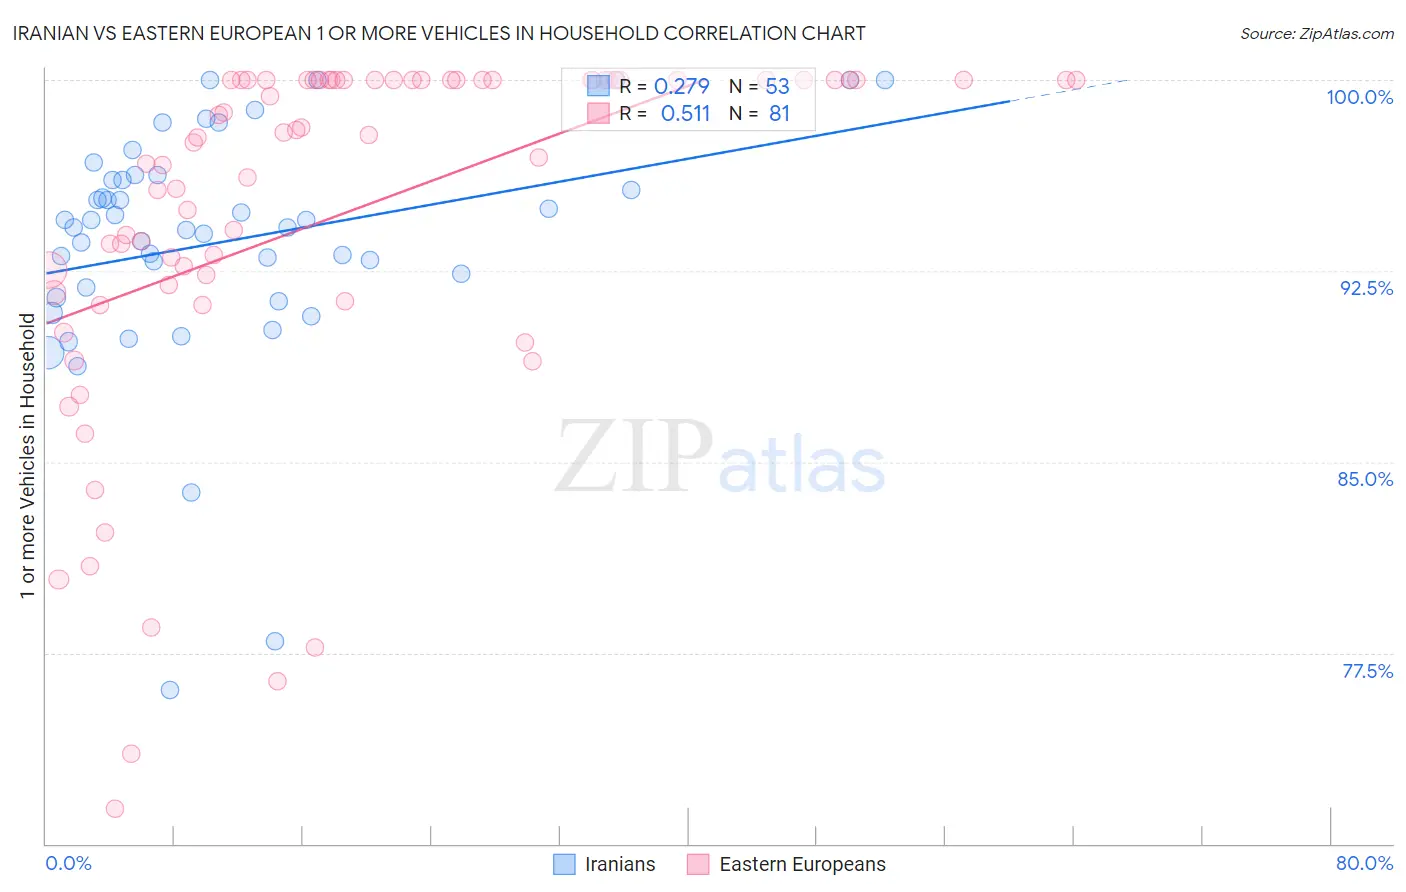
Iranian vs Eastern European 1 or more Vehicles in Household
COMPARE
Iranian
Eastern European
1 or more Vehicles in Household
1 or more Vehicles in Household Comparison
Iranians
Eastern Europeans
91.5%
1 OR MORE VEHICLES IN HOUSEHOLD
99.4/ 100
METRIC RATING
78th/ 347
METRIC RANK
88.5%
1 OR MORE VEHICLES IN HOUSEHOLD
3.0/ 100
METRIC RATING
240th/ 347
METRIC RANK
Iranian vs Eastern European 1 or more Vehicles in Household Correlation Chart
The statistical analysis conducted on geographies consisting of 316,682,996 people shows a weak positive correlation between the proportion of Iranians and percentage of households with 1 or more vehicles available in the United States with a correlation coefficient (R) of 0.279 and weighted average of 91.5%. Similarly, the statistical analysis conducted on geographies consisting of 460,790,270 people shows a substantial positive correlation between the proportion of Eastern Europeans and percentage of households with 1 or more vehicles available in the United States with a correlation coefficient (R) of 0.511 and weighted average of 88.5%, a difference of 3.4%.
1 or more Vehicles in Household Correlation Summary
| Measurement | Iranian | Eastern European |
| Minimum | 76.0% | 71.4% |
| Maximum | 100.0% | 100.0% |
| Range | 24.0% | 28.6% |
| Mean | 93.6% | 94.7% |
| Median | 94.2% | 97.8% |
| Interquartile 25% (IQ1) | 91.6% | 91.8% |
| Interquartile 75% (IQ3) | 96.2% | 100.0% |
| Interquartile Range (IQR) | 4.5% | 8.2% |
| Standard Deviation (Sample) | 4.7% | 7.1% |
| Standard Deviation (Population) | 4.7% | 7.0% |
Similar Demographics by 1 or more Vehicles in Household
Demographics Similar to Iranians by 1 or more Vehicles in Household
In terms of 1 or more vehicles in household, the demographic groups most similar to Iranians are Immigrants from Philippines (91.5%, a difference of 0.0%), Immigrants from South Central Asia (91.5%, a difference of 0.020%), Bolivian (91.5%, a difference of 0.020%), Cuban (91.5%, a difference of 0.040%), and Immigrants from South Eastern Asia (91.4%, a difference of 0.050%).
| Demographics | Rating | Rank | 1 or more Vehicles in Household |
| Poles | 99.7 /100 | #71 | Exceptional 91.7% |
| Cajuns | 99.7 /100 | #72 | Exceptional 91.7% |
| Immigrants | Iran | 99.7 /100 | #73 | Exceptional 91.7% |
| Immigrants | Lebanon | 99.6 /100 | #74 | Exceptional 91.6% |
| Portuguese | 99.5 /100 | #75 | Exceptional 91.6% |
| Cubans | 99.5 /100 | #76 | Exceptional 91.5% |
| Immigrants | Philippines | 99.4 /100 | #77 | Exceptional 91.5% |
| Iranians | 99.4 /100 | #78 | Exceptional 91.5% |
| Immigrants | South Central Asia | 99.4 /100 | #79 | Exceptional 91.5% |
| Bolivians | 99.4 /100 | #80 | Exceptional 91.5% |
| Immigrants | South Eastern Asia | 99.3 /100 | #81 | Exceptional 91.4% |
| Lebanese | 99.3 /100 | #82 | Exceptional 91.4% |
| Immigrants | England | 99.3 /100 | #83 | Exceptional 91.4% |
| Jordanians | 99.3 /100 | #84 | Exceptional 91.4% |
| Tsimshian | 99.3 /100 | #85 | Exceptional 91.4% |
Demographics Similar to Eastern Europeans by 1 or more Vehicles in Household
In terms of 1 or more vehicles in household, the demographic groups most similar to Eastern Europeans are Taiwanese (88.4%, a difference of 0.050%), Turkish (88.4%, a difference of 0.070%), Kiowa (88.6%, a difference of 0.10%), Immigrants from Belgium (88.4%, a difference of 0.13%), and Immigrants from Somalia (88.6%, a difference of 0.14%).
| Demographics | Rating | Rank | 1 or more Vehicles in Household |
| Houma | 4.8 /100 | #233 | Tragic 88.6% |
| Immigrants | Peru | 4.7 /100 | #234 | Tragic 88.6% |
| Paiute | 4.6 /100 | #235 | Tragic 88.6% |
| Immigrants | Pakistan | 4.5 /100 | #236 | Tragic 88.6% |
| Immigrants | Turkey | 4.4 /100 | #237 | Tragic 88.6% |
| Immigrants | Somalia | 4.2 /100 | #238 | Tragic 88.6% |
| Kiowa | 3.8 /100 | #239 | Tragic 88.6% |
| Eastern Europeans | 3.0 /100 | #240 | Tragic 88.5% |
| Taiwanese | 2.6 /100 | #241 | Tragic 88.4% |
| Turks | 2.5 /100 | #242 | Tragic 88.4% |
| Immigrants | Belgium | 2.1 /100 | #243 | Tragic 88.4% |
| Immigrants | Portugal | 2.0 /100 | #244 | Tragic 88.3% |
| Immigrants | Czechoslovakia | 1.9 /100 | #245 | Tragic 88.3% |
| Menominee | 1.9 /100 | #246 | Tragic 88.3% |
| Immigrants | Honduras | 1.7 /100 | #247 | Tragic 88.3% |