Indonesian vs Dutch 4 or more Vehicles in Household
COMPARE
Indonesian
Dutch
4 or more Vehicles in Household
4 or more Vehicles in Household Comparison
Indonesians
Dutch
6.0%
4 OR MORE VEHICLES IN HOUSEHOLD
8.9/ 100
METRIC RATING
225th/ 347
METRIC RANK
7.7%
4 OR MORE VEHICLES IN HOUSEHOLD
100.0/ 100
METRIC RATING
54th/ 347
METRIC RANK
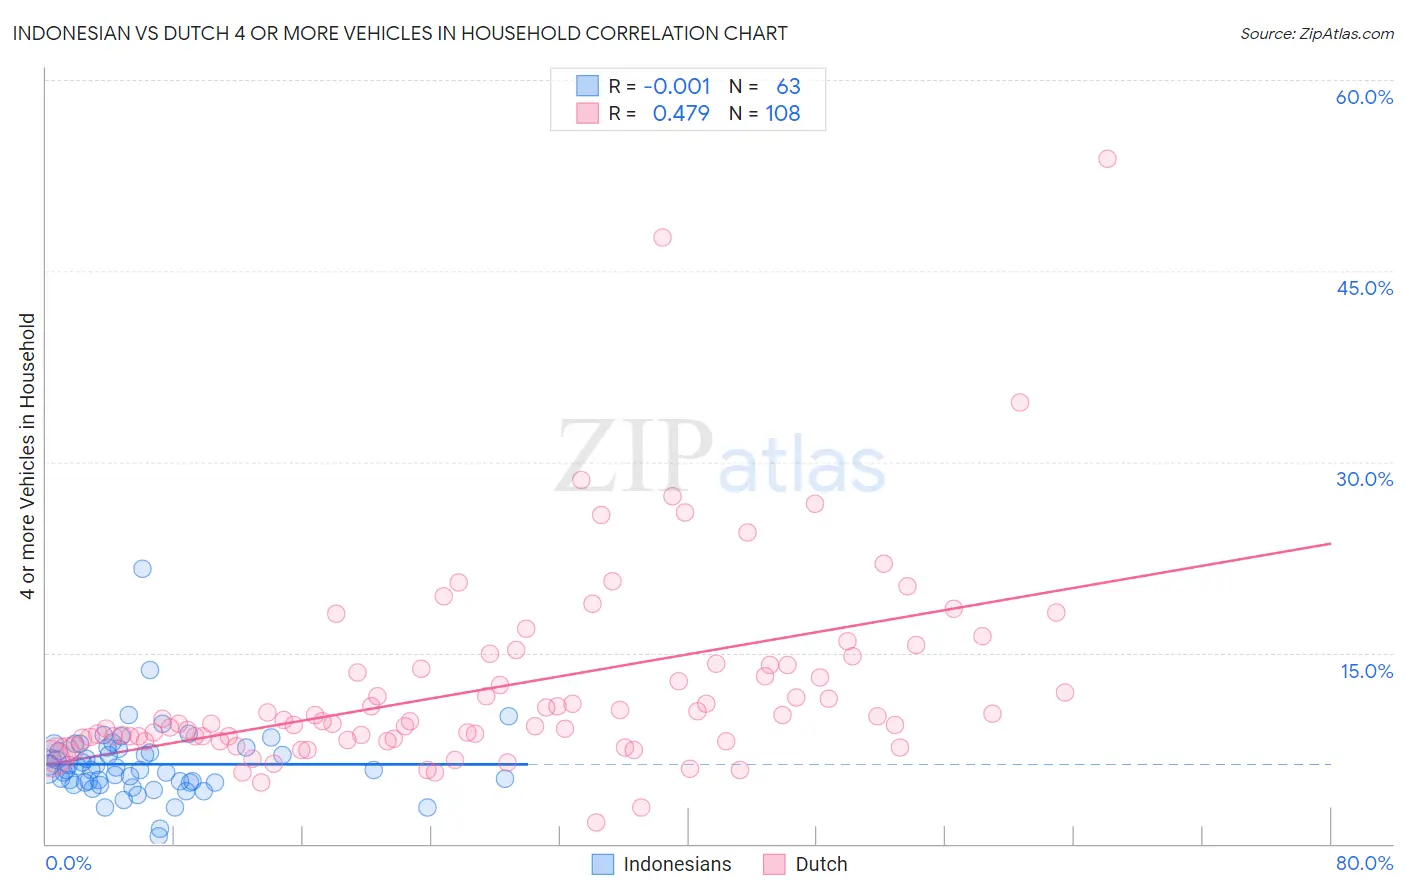
Indonesian vs Dutch 4 or more Vehicles in Household Correlation Chart
The statistical analysis conducted on geographies consisting of 162,278,246 people shows no correlation between the proportion of Indonesians and percentage of households with 4 or more vehicles available in the United States with a correlation coefficient (R) of -0.001 and weighted average of 6.0%. Similarly, the statistical analysis conducted on geographies consisting of 551,480,687 people shows a moderate positive correlation between the proportion of Dutch and percentage of households with 4 or more vehicles available in the United States with a correlation coefficient (R) of 0.479 and weighted average of 7.7%, a difference of 28.6%.
4 or more Vehicles in Household Correlation Summary
| Measurement | Indonesian | Dutch |
| Minimum | 0.59% | 1.7% |
| Maximum | 21.6% | 53.8% |
| Range | 21.0% | 52.2% |
| Mean | 6.2% | 12.3% |
| Median | 5.8% | 9.6% |
| Interquartile 25% (IQ1) | 4.8% | 8.2% |
| Interquartile 75% (IQ3) | 7.4% | 14.0% |
| Interquartile Range (IQR) | 2.6% | 5.8% |
| Standard Deviation (Sample) | 2.9% | 7.9% |
| Standard Deviation (Population) | 2.9% | 7.8% |
Similar Demographics by 4 or more Vehicles in Household
Demographics Similar to Indonesians by 4 or more Vehicles in Household
In terms of 4 or more vehicles in household, the demographic groups most similar to Indonesians are Cuban (6.0%, a difference of 0.080%), Cajun (6.0%, a difference of 0.090%), Immigrants from Kenya (6.0%, a difference of 0.090%), Immigrants from Moldova (6.0%, a difference of 0.13%), and Immigrants from Singapore (5.9%, a difference of 0.38%).
| Demographics | Rating | Rank | 4 or more Vehicles in Household |
| Immigrants | Italy | 11.0 /100 | #218 | Poor 6.0% |
| Serbians | 11.0 /100 | #219 | Poor 6.0% |
| Russians | 10.3 /100 | #220 | Poor 6.0% |
| Immigrants | Moldova | 9.3 /100 | #221 | Tragic 6.0% |
| Cajuns | 9.2 /100 | #222 | Tragic 6.0% |
| Immigrants | Kenya | 9.2 /100 | #223 | Tragic 6.0% |
| Cubans | 9.2 /100 | #224 | Tragic 6.0% |
| Indonesians | 8.9 /100 | #225 | Tragic 6.0% |
| Immigrants | Singapore | 7.9 /100 | #226 | Tragic 5.9% |
| Immigrants | Western Asia | 7.8 /100 | #227 | Tragic 5.9% |
| Immigrants | Uganda | 7.5 /100 | #228 | Tragic 5.9% |
| Eastern Europeans | 6.8 /100 | #229 | Tragic 5.9% |
| Immigrants | Malaysia | 6.7 /100 | #230 | Tragic 5.9% |
| Immigrants | Switzerland | 6.4 /100 | #231 | Tragic 5.9% |
| Immigrants | Argentina | 6.0 /100 | #232 | Tragic 5.9% |
Demographics Similar to Dutch by 4 or more Vehicles in Household
In terms of 4 or more vehicles in household, the demographic groups most similar to Dutch are Malaysian (7.7%, a difference of 0.070%), Immigrants from Oceania (7.6%, a difference of 0.39%), English (7.6%, a difference of 0.41%), Japanese (7.7%, a difference of 0.46%), and Pennsylvania German (7.6%, a difference of 0.53%).
| Demographics | Rating | Rank | 4 or more Vehicles in Household |
| Osage | 100.0 /100 | #47 | Exceptional 7.8% |
| Swiss | 100.0 /100 | #48 | Exceptional 7.8% |
| Cherokee | 100.0 /100 | #49 | Exceptional 7.7% |
| Immigrants | El Salvador | 100.0 /100 | #50 | Exceptional 7.7% |
| Immigrants | Laos | 100.0 /100 | #51 | Exceptional 7.7% |
| Japanese | 100.0 /100 | #52 | Exceptional 7.7% |
| Malaysians | 100.0 /100 | #53 | Exceptional 7.7% |
| Dutch | 100.0 /100 | #54 | Exceptional 7.7% |
| Immigrants | Oceania | 100.0 /100 | #55 | Exceptional 7.6% |
| English | 100.0 /100 | #56 | Exceptional 7.6% |
| Pennsylvania Germans | 100.0 /100 | #57 | Exceptional 7.6% |
| Swedes | 100.0 /100 | #58 | Exceptional 7.6% |
| Hispanics or Latinos | 100.0 /100 | #59 | Exceptional 7.6% |
| Spaniards | 100.0 /100 | #60 | Exceptional 7.6% |
| Europeans | 100.0 /100 | #61 | Exceptional 7.6% |