Immigrants from Taiwan vs Immigrants from Europe 1 or more Vehicles in Household
COMPARE
Immigrants from Taiwan
Immigrants from Europe
1 or more Vehicles in Household
1 or more Vehicles in Household Comparison
Immigrants from Taiwan
Immigrants from Europe
92.3%
1 OR MORE VEHICLES IN HOUSEHOLD
99.9/ 100
METRIC RATING
41st/ 347
METRIC RANK
87.6%
1 OR MORE VEHICLES IN HOUSEHOLD
0.2/ 100
METRIC RATING
268th/ 347
METRIC RANK
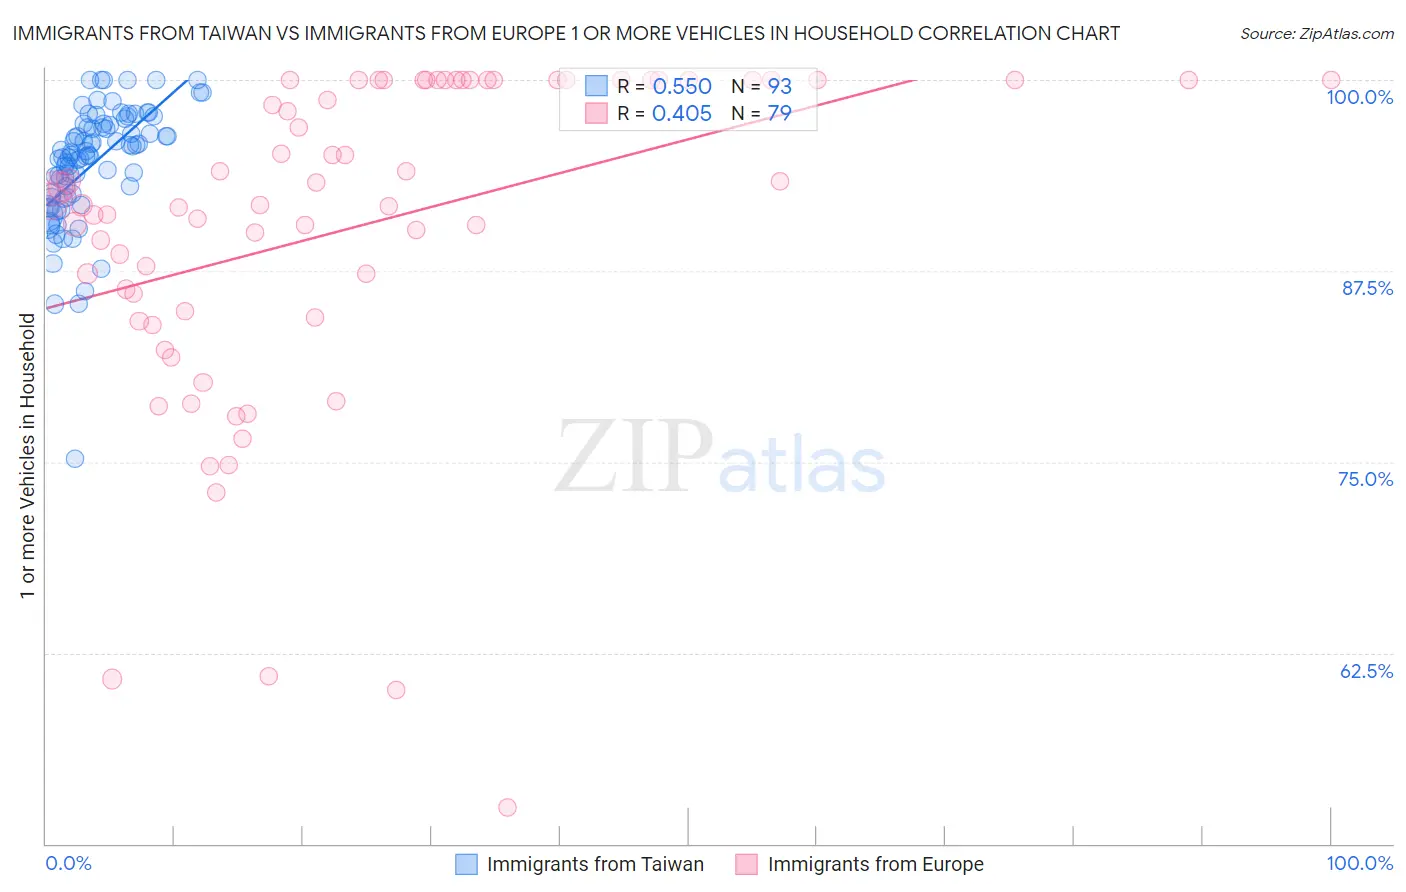
Immigrants from Taiwan vs Immigrants from Europe 1 or more Vehicles in Household Correlation Chart
The statistical analysis conducted on geographies consisting of 277,140,918 people shows a substantial positive correlation between the proportion of Immigrants from Taiwan and percentage of households with 1 or more vehicles available in the United States with a correlation coefficient (R) of 0.550 and weighted average of 92.3%. Similarly, the statistical analysis conducted on geographies consisting of 546,983,973 people shows a moderate positive correlation between the proportion of Immigrants from Europe and percentage of households with 1 or more vehicles available in the United States with a correlation coefficient (R) of 0.405 and weighted average of 87.6%, a difference of 5.3%.
1 or more Vehicles in Household Correlation Summary
| Measurement | Immigrants from Taiwan | Immigrants from Europe |
| Minimum | 75.2% | 52.4% |
| Maximum | 100.0% | 100.0% |
| Range | 24.8% | 47.6% |
| Mean | 94.5% | 90.3% |
| Median | 95.1% | 92.1% |
| Interquartile 25% (IQ1) | 92.4% | 84.9% |
| Interquartile 75% (IQ3) | 97.1% | 100.0% |
| Interquartile Range (IQR) | 4.6% | 15.1% |
| Standard Deviation (Sample) | 3.9% | 10.7% |
| Standard Deviation (Population) | 3.9% | 10.6% |
Similar Demographics by 1 or more Vehicles in Household
Demographics Similar to Immigrants from Taiwan by 1 or more Vehicles in Household
In terms of 1 or more vehicles in household, the demographic groups most similar to Immigrants from Taiwan are Chickasaw (92.3%, a difference of 0.010%), Spanish (92.3%, a difference of 0.010%), Swiss (92.3%, a difference of 0.020%), Creek (92.3%, a difference of 0.020%), and French Canadian (92.3%, a difference of 0.030%).
| Demographics | Rating | Rank | 1 or more Vehicles in Household |
| Italians | 99.9 /100 | #34 | Exceptional 92.3% |
| Czechoslovakians | 99.9 /100 | #35 | Exceptional 92.3% |
| Malaysians | 99.9 /100 | #36 | Exceptional 92.3% |
| French Canadians | 99.9 /100 | #37 | Exceptional 92.3% |
| Immigrants | Vietnam | 99.9 /100 | #38 | Exceptional 92.3% |
| Swiss | 99.9 /100 | #39 | Exceptional 92.3% |
| Creek | 99.9 /100 | #40 | Exceptional 92.3% |
| Immigrants | Taiwan | 99.9 /100 | #41 | Exceptional 92.3% |
| Chickasaw | 99.9 /100 | #42 | Exceptional 92.3% |
| Spanish | 99.9 /100 | #43 | Exceptional 92.3% |
| Choctaw | 99.9 /100 | #44 | Exceptional 92.2% |
| Immigrants | Nonimmigrants | 99.9 /100 | #45 | Exceptional 92.2% |
| Immigrants | Fiji | 99.9 /100 | #46 | Exceptional 92.2% |
| Northern Europeans | 99.9 /100 | #47 | Exceptional 92.2% |
| Belgians | 99.9 /100 | #48 | Exceptional 92.1% |
Demographics Similar to Immigrants from Europe by 1 or more Vehicles in Household
In terms of 1 or more vehicles in household, the demographic groups most similar to Immigrants from Europe are Immigrants from Colombia (87.6%, a difference of 0.030%), Immigrants from Africa (87.6%, a difference of 0.050%), Panamanian (87.5%, a difference of 0.060%), Israeli (87.7%, a difference of 0.070%), and Bermudan (87.5%, a difference of 0.070%).
| Demographics | Rating | Rank | 1 or more Vehicles in Household |
| Immigrants | Switzerland | 0.6 /100 | #261 | Tragic 87.9% |
| Sub-Saharan Africans | 0.5 /100 | #262 | Tragic 87.9% |
| Immigrants | Egypt | 0.5 /100 | #263 | Tragic 87.8% |
| Immigrants | Liberia | 0.4 /100 | #264 | Tragic 87.8% |
| Africans | 0.4 /100 | #265 | Tragic 87.8% |
| Israelis | 0.3 /100 | #266 | Tragic 87.7% |
| Immigrants | Colombia | 0.3 /100 | #267 | Tragic 87.6% |
| Immigrants | Europe | 0.2 /100 | #268 | Tragic 87.6% |
| Immigrants | Africa | 0.2 /100 | #269 | Tragic 87.6% |
| Panamanians | 0.2 /100 | #270 | Tragic 87.5% |
| Bermudans | 0.2 /100 | #271 | Tragic 87.5% |
| Aleuts | 0.2 /100 | #272 | Tragic 87.5% |
| Immigrants | Northern Africa | 0.2 /100 | #273 | Tragic 87.4% |
| Immigrants | Morocco | 0.1 /100 | #274 | Tragic 87.4% |
| Immigrants | Singapore | 0.1 /100 | #275 | Tragic 87.2% |