Immigrants from Taiwan vs Immigrants from Europe Female Poverty Among 25-34 Year Olds
COMPARE
Immigrants from Taiwan
Immigrants from Europe
Female Poverty Among 25-34 Year Olds
Female Poverty Among 25-34 Year Olds Comparison
Immigrants from Taiwan
Immigrants from Europe
10.0%
FEMALE POVERTY AMONG 25-34 YEAR OLDS
100.0/ 100
METRIC RATING
2nd/ 347
METRIC RANK
12.2%
FEMALE POVERTY AMONG 25-34 YEAR OLDS
99.2/ 100
METRIC RATING
66th/ 347
METRIC RANK
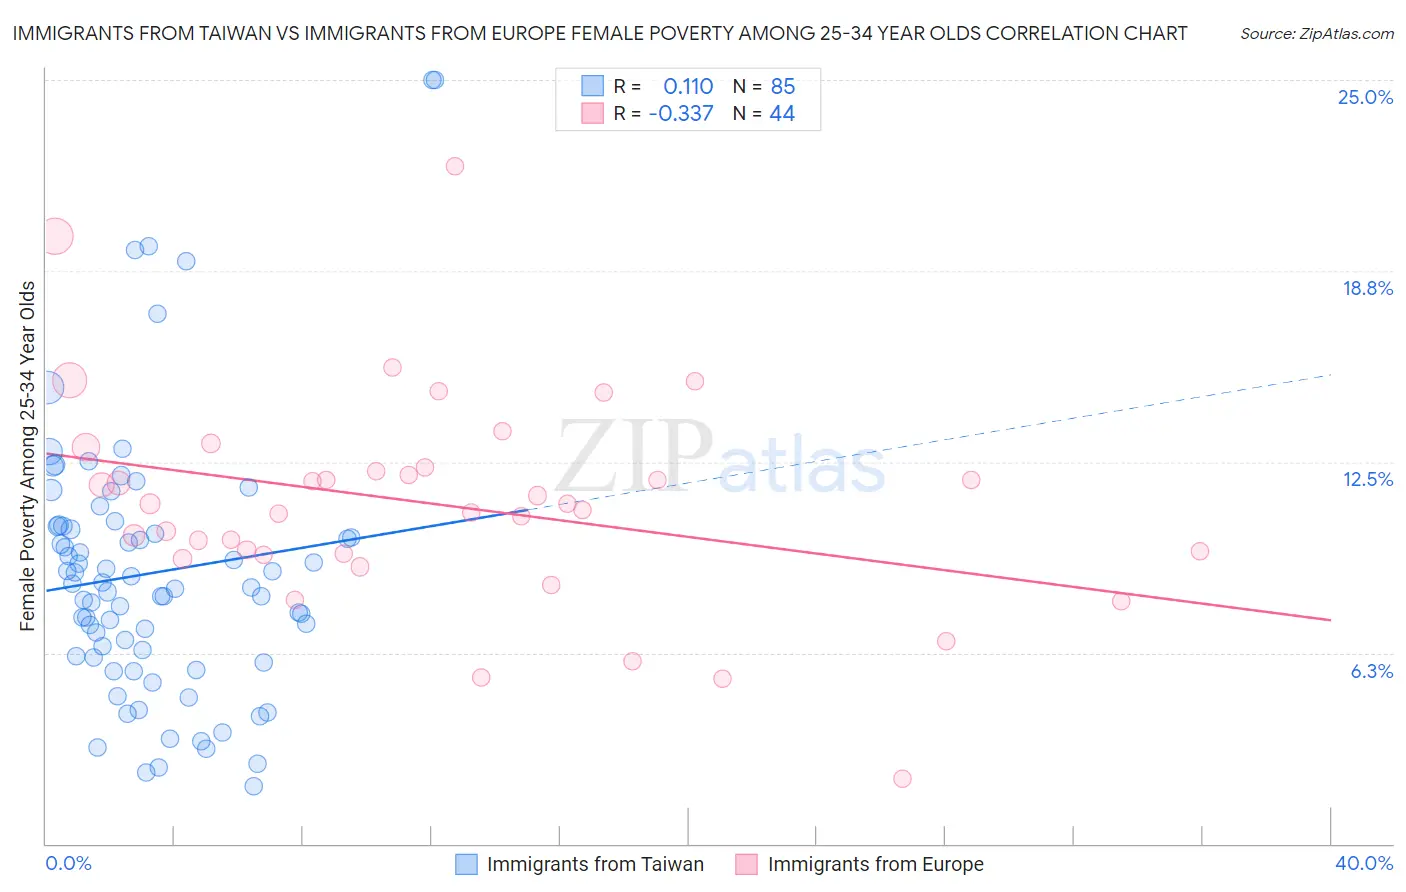
Immigrants from Taiwan vs Immigrants from Europe Female Poverty Among 25-34 Year Olds Correlation Chart
The statistical analysis conducted on geographies consisting of 293,956,409 people shows a poor positive correlation between the proportion of Immigrants from Taiwan and poverty level among females between the ages 25 and 34 in the United States with a correlation coefficient (R) of 0.110 and weighted average of 10.0%. Similarly, the statistical analysis conducted on geographies consisting of 529,126,635 people shows a mild negative correlation between the proportion of Immigrants from Europe and poverty level among females between the ages 25 and 34 in the United States with a correlation coefficient (R) of -0.337 and weighted average of 12.2%, a difference of 21.6%.
Female Poverty Among 25-34 Year Olds Correlation Summary
| Measurement | Immigrants from Taiwan | Immigrants from Europe |
| Minimum | 1.9% | 2.1% |
| Maximum | 25.0% | 22.2% |
| Range | 23.1% | 20.0% |
| Mean | 8.9% | 11.1% |
| Median | 8.4% | 11.0% |
| Interquartile 25% (IQ1) | 6.1% | 9.5% |
| Interquartile 75% (IQ3) | 10.4% | 12.3% |
| Interquartile Range (IQR) | 4.3% | 2.8% |
| Standard Deviation (Sample) | 4.4% | 3.5% |
| Standard Deviation (Population) | 4.4% | 3.5% |
Similar Demographics by Female Poverty Among 25-34 Year Olds
Demographics Similar to Immigrants from Taiwan by Female Poverty Among 25-34 Year Olds
In terms of female poverty among 25-34 year olds, the demographic groups most similar to Immigrants from Taiwan are Filipino (10.2%, a difference of 2.1%), Thai (10.2%, a difference of 2.2%), Immigrants from India (9.7%, a difference of 3.1%), Immigrants from Hong Kong (10.4%, a difference of 3.6%), and Immigrants from South Central Asia (10.8%, a difference of 7.4%).
| Demographics | Rating | Rank | Female Poverty Among 25-34 Year Olds |
| Immigrants | India | 100.0 /100 | #1 | Exceptional 9.7% |
| Immigrants | Taiwan | 100.0 /100 | #2 | Exceptional 10.0% |
| Filipinos | 100.0 /100 | #3 | Exceptional 10.2% |
| Thais | 100.0 /100 | #4 | Exceptional 10.2% |
| Immigrants | Hong Kong | 100.0 /100 | #5 | Exceptional 10.4% |
| Immigrants | South Central Asia | 100.0 /100 | #6 | Exceptional 10.8% |
| Chinese | 100.0 /100 | #7 | Exceptional 11.0% |
| Immigrants | Iran | 100.0 /100 | #8 | Exceptional 11.0% |
| Immigrants | Singapore | 100.0 /100 | #9 | Exceptional 11.1% |
| Immigrants | Lithuania | 100.0 /100 | #10 | Exceptional 11.1% |
| Immigrants | Korea | 100.0 /100 | #11 | Exceptional 11.1% |
| Immigrants | Ireland | 100.0 /100 | #12 | Exceptional 11.2% |
| Burmese | 100.0 /100 | #13 | Exceptional 11.2% |
| Indians (Asian) | 100.0 /100 | #14 | Exceptional 11.2% |
| Assyrians/Chaldeans/Syriacs | 100.0 /100 | #15 | Exceptional 11.2% |
Demographics Similar to Immigrants from Europe by Female Poverty Among 25-34 Year Olds
In terms of female poverty among 25-34 year olds, the demographic groups most similar to Immigrants from Europe are Armenian (12.2%, a difference of 0.060%), Immigrants from Russia (12.2%, a difference of 0.070%), Laotian (12.2%, a difference of 0.12%), Soviet Union (12.1%, a difference of 0.31%), and Immigrants from Moldova (12.1%, a difference of 0.32%).
| Demographics | Rating | Rank | Female Poverty Among 25-34 Year Olds |
| Russians | 99.4 /100 | #59 | Exceptional 12.1% |
| Immigrants | Northern Europe | 99.4 /100 | #60 | Exceptional 12.1% |
| Immigrants | Czechoslovakia | 99.4 /100 | #61 | Exceptional 12.1% |
| Immigrants | Moldova | 99.3 /100 | #62 | Exceptional 12.1% |
| Soviet Union | 99.3 /100 | #63 | Exceptional 12.1% |
| Immigrants | Russia | 99.2 /100 | #64 | Exceptional 12.2% |
| Armenians | 99.2 /100 | #65 | Exceptional 12.2% |
| Immigrants | Europe | 99.2 /100 | #66 | Exceptional 12.2% |
| Laotians | 99.2 /100 | #67 | Exceptional 12.2% |
| Sri Lankans | 99.1 /100 | #68 | Exceptional 12.2% |
| Immigrants | Lebanon | 99.1 /100 | #69 | Exceptional 12.2% |
| Immigrants | Belgium | 99.1 /100 | #70 | Exceptional 12.2% |
| Immigrants | Scotland | 99.1 /100 | #71 | Exceptional 12.2% |
| Lithuanians | 99.1 /100 | #72 | Exceptional 12.2% |
| Immigrants | Vietnam | 98.9 /100 | #73 | Exceptional 12.3% |