Immigrants from Northern Africa vs Immigrants from Germany 1 or more Vehicles in Household
COMPARE
Immigrants from Northern Africa
Immigrants from Germany
1 or more Vehicles in Household
1 or more Vehicles in Household Comparison
Immigrants from Northern Africa
Immigrants from Germany
87.4%
1 OR MORE VEHICLES IN HOUSEHOLD
0.2/ 100
METRIC RATING
273rd/ 347
METRIC RANK
91.4%
1 OR MORE VEHICLES IN HOUSEHOLD
99.2/ 100
METRIC RATING
87th/ 347
METRIC RANK
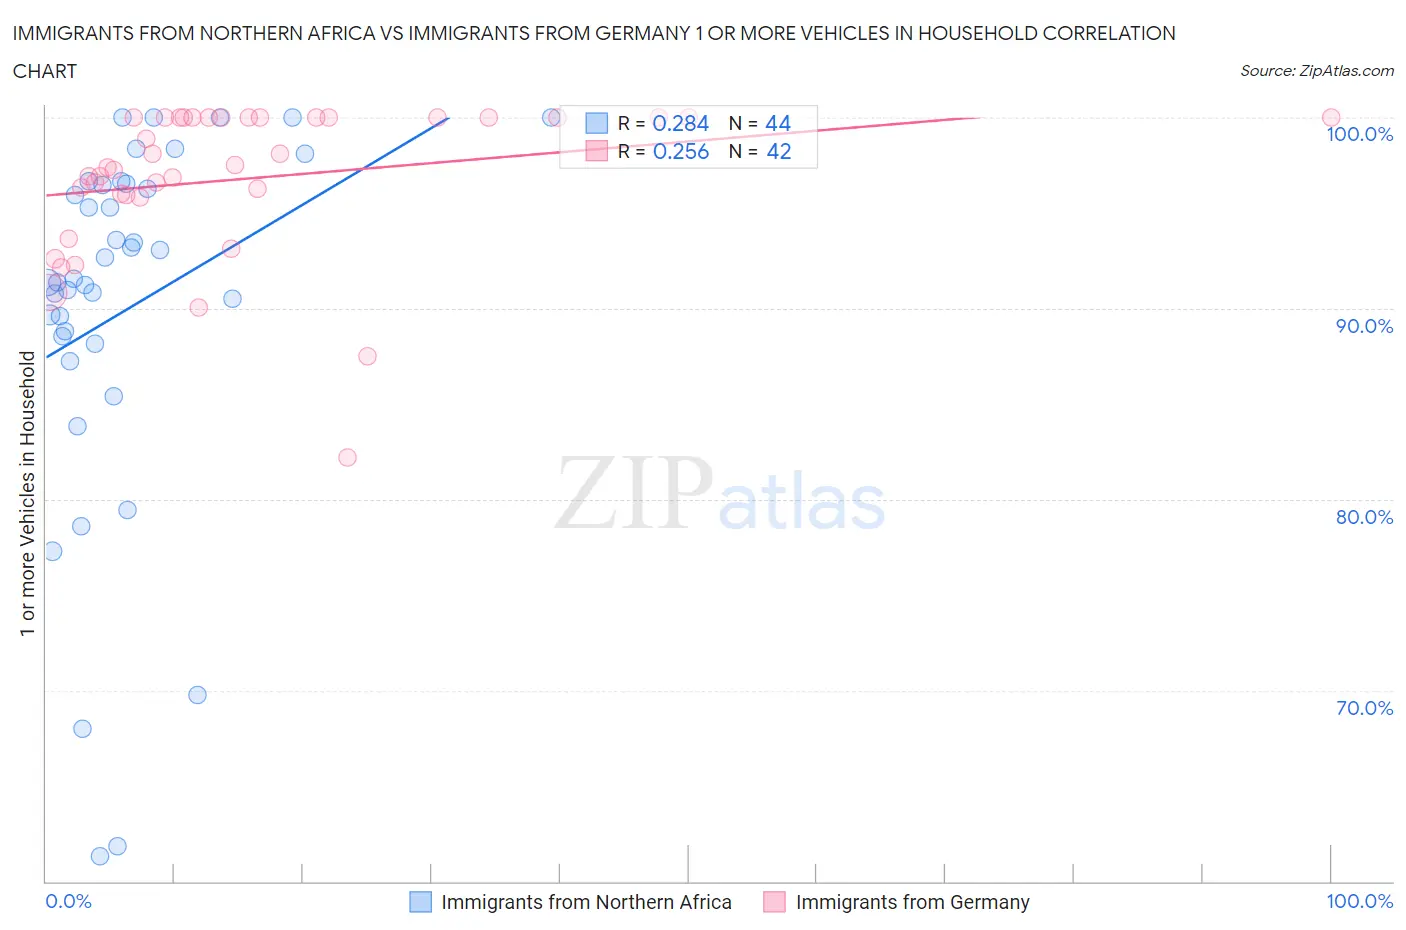
Immigrants from Northern Africa vs Immigrants from Germany 1 or more Vehicles in Household Correlation Chart
The statistical analysis conducted on geographies consisting of 321,103,930 people shows a weak positive correlation between the proportion of Immigrants from Northern Africa and percentage of households with 1 or more vehicles available in the United States with a correlation coefficient (R) of 0.284 and weighted average of 87.4%. Similarly, the statistical analysis conducted on geographies consisting of 463,788,940 people shows a weak positive correlation between the proportion of Immigrants from Germany and percentage of households with 1 or more vehicles available in the United States with a correlation coefficient (R) of 0.256 and weighted average of 91.4%, a difference of 4.5%.
1 or more Vehicles in Household Correlation Summary
| Measurement | Immigrants from Northern Africa | Immigrants from Germany |
| Minimum | 61.3% | 82.2% |
| Maximum | 100.0% | 100.0% |
| Range | 38.7% | 17.8% |
| Mean | 89.9% | 96.8% |
| Median | 91.5% | 97.4% |
| Interquartile 25% (IQ1) | 88.3% | 96.0% |
| Interquartile 75% (IQ3) | 96.5% | 100.0% |
| Interquartile Range (IQR) | 8.1% | 4.0% |
| Standard Deviation (Sample) | 9.7% | 4.0% |
| Standard Deviation (Population) | 9.6% | 3.9% |
Similar Demographics by 1 or more Vehicles in Household
Demographics Similar to Immigrants from Northern Africa by 1 or more Vehicles in Household
In terms of 1 or more vehicles in household, the demographic groups most similar to Immigrants from Northern Africa are Immigrants from Morocco (87.4%, a difference of 0.030%), Aleut (87.5%, a difference of 0.040%), Panamanian (87.5%, a difference of 0.11%), Bermudan (87.5%, a difference of 0.11%), and Immigrants from Africa (87.6%, a difference of 0.12%).
| Demographics | Rating | Rank | 1 or more Vehicles in Household |
| Israelis | 0.3 /100 | #266 | Tragic 87.7% |
| Immigrants | Colombia | 0.3 /100 | #267 | Tragic 87.6% |
| Immigrants | Europe | 0.2 /100 | #268 | Tragic 87.6% |
| Immigrants | Africa | 0.2 /100 | #269 | Tragic 87.6% |
| Panamanians | 0.2 /100 | #270 | Tragic 87.5% |
| Bermudans | 0.2 /100 | #271 | Tragic 87.5% |
| Aleuts | 0.2 /100 | #272 | Tragic 87.5% |
| Immigrants | Northern Africa | 0.2 /100 | #273 | Tragic 87.4% |
| Immigrants | Morocco | 0.1 /100 | #274 | Tragic 87.4% |
| Immigrants | Singapore | 0.1 /100 | #275 | Tragic 87.2% |
| Immigrants | France | 0.1 /100 | #276 | Tragic 87.1% |
| Alsatians | 0.1 /100 | #277 | Tragic 87.1% |
| Immigrants | Southern Europe | 0.1 /100 | #278 | Tragic 87.1% |
| Immigrants | Albania | 0.1 /100 | #279 | Tragic 87.1% |
| Immigrants | Croatia | 0.0 /100 | #280 | Tragic 87.0% |
Demographics Similar to Immigrants from Germany by 1 or more Vehicles in Household
In terms of 1 or more vehicles in household, the demographic groups most similar to Immigrants from Germany are Spanish American (91.4%, a difference of 0.0%), Osage (91.4%, a difference of 0.010%), Bangladeshi (91.4%, a difference of 0.010%), Immigrants from Canada (91.4%, a difference of 0.010%), and Immigrants from Jordan (91.4%, a difference of 0.010%).
| Demographics | Rating | Rank | 1 or more Vehicles in Household |
| Bolivians | 99.4 /100 | #80 | Exceptional 91.5% |
| Immigrants | South Eastern Asia | 99.3 /100 | #81 | Exceptional 91.4% |
| Lebanese | 99.3 /100 | #82 | Exceptional 91.4% |
| Immigrants | England | 99.3 /100 | #83 | Exceptional 91.4% |
| Jordanians | 99.3 /100 | #84 | Exceptional 91.4% |
| Tsimshian | 99.3 /100 | #85 | Exceptional 91.4% |
| Osage | 99.2 /100 | #86 | Exceptional 91.4% |
| Immigrants | Germany | 99.2 /100 | #87 | Exceptional 91.4% |
| Spanish Americans | 99.2 /100 | #88 | Exceptional 91.4% |
| Bangladeshis | 99.2 /100 | #89 | Exceptional 91.4% |
| Immigrants | Canada | 99.2 /100 | #90 | Exceptional 91.4% |
| Immigrants | Jordan | 99.2 /100 | #91 | Exceptional 91.4% |
| Bhutanese | 99.2 /100 | #92 | Exceptional 91.4% |
| Immigrants | North America | 99.2 /100 | #93 | Exceptional 91.4% |
| Immigrants | Cuba | 99.1 /100 | #94 | Exceptional 91.3% |