Immigrants from Nepal vs Paraguayan No Vehicles in Household
COMPARE
Immigrants from Nepal
Paraguayan
No Vehicles in Household
No Vehicles in Household Comparison
Immigrants from Nepal
Paraguayans
10.5%
NO VEHICLES IN HOUSEHOLD
42.4/ 100
METRIC RATING
184th/ 347
METRIC RANK
14.4%
NO VEHICLES IN HOUSEHOLD
0.0/ 100
METRIC RATING
295th/ 347
METRIC RANK
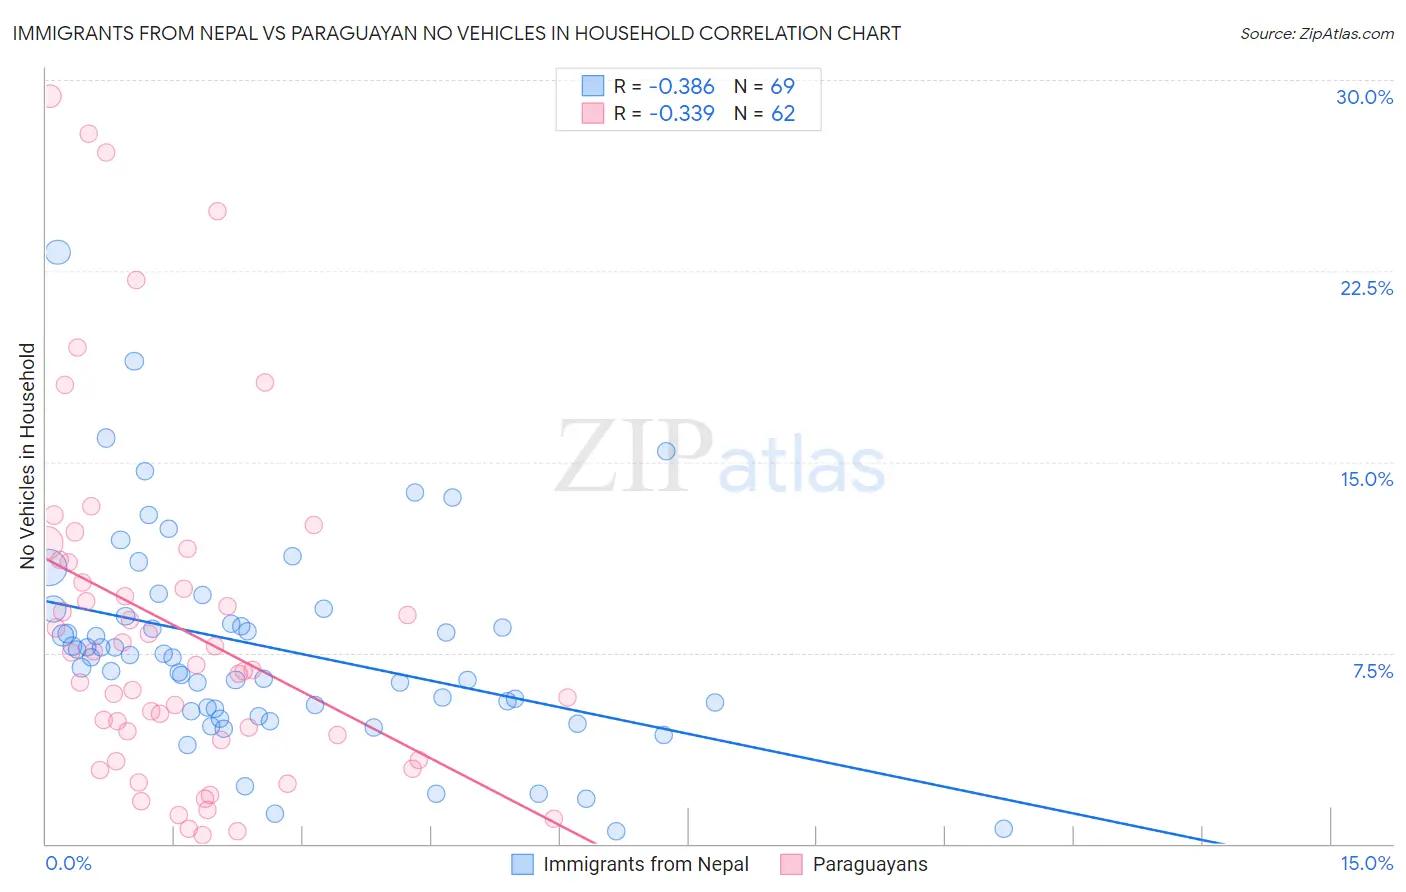
Immigrants from Nepal vs Paraguayan No Vehicles in Household Correlation Chart
The statistical analysis conducted on geographies consisting of 186,377,991 people shows a mild negative correlation between the proportion of Immigrants from Nepal and percentage of households with no vehicle available in the United States with a correlation coefficient (R) of -0.386 and weighted average of 10.5%. Similarly, the statistical analysis conducted on geographies consisting of 94,954,022 people shows a mild negative correlation between the proportion of Paraguayans and percentage of households with no vehicle available in the United States with a correlation coefficient (R) of -0.339 and weighted average of 14.4%, a difference of 36.5%.
No Vehicles in Household Correlation Summary
| Measurement | Immigrants from Nepal | Paraguayan |
| Minimum | 0.50% | 0.32% |
| Maximum | 23.2% | 29.4% |
| Range | 22.7% | 29.0% |
| Mean | 7.7% | 8.5% |
| Median | 7.3% | 6.9% |
| Interquartile 25% (IQ1) | 5.3% | 4.1% |
| Interquartile 75% (IQ3) | 9.1% | 11.1% |
| Interquartile Range (IQR) | 3.8% | 7.0% |
| Standard Deviation (Sample) | 4.1% | 6.9% |
| Standard Deviation (Population) | 4.1% | 6.8% |
Similar Demographics by No Vehicles in Household
Demographics Similar to Immigrants from Nepal by No Vehicles in Household
In terms of no vehicles in household, the demographic groups most similar to Immigrants from Nepal are South American (10.5%, a difference of 0.070%), Native/Alaskan (10.5%, a difference of 0.17%), Immigrants from Bulgaria (10.5%, a difference of 0.19%), Immigrants from Colombia (10.5%, a difference of 0.23%), and German Russian (10.5%, a difference of 0.25%).
| Demographics | Rating | Rank | No Vehicles in Household |
| Immigrants | El Salvador | 49.1 /100 | #177 | Average 10.4% |
| Immigrants | Ethiopia | 48.0 /100 | #178 | Average 10.4% |
| Ethiopians | 45.8 /100 | #179 | Average 10.5% |
| Arabs | 45.3 /100 | #180 | Average 10.5% |
| Immigrants | Colombia | 44.1 /100 | #181 | Average 10.5% |
| Immigrants | Bulgaria | 43.8 /100 | #182 | Average 10.5% |
| Natives/Alaskans | 43.7 /100 | #183 | Average 10.5% |
| Immigrants | Nepal | 42.4 /100 | #184 | Average 10.5% |
| South Americans | 41.9 /100 | #185 | Average 10.5% |
| German Russians | 40.6 /100 | #186 | Average 10.5% |
| Immigrants | Poland | 38.4 /100 | #187 | Fair 10.6% |
| Immigrants | Armenia | 37.5 /100 | #188 | Fair 10.6% |
| Immigrants | Eritrea | 36.3 /100 | #189 | Fair 10.6% |
| Immigrants | North Macedonia | 34.6 /100 | #190 | Fair 10.6% |
| Immigrants | Northern Europe | 33.1 /100 | #191 | Fair 10.7% |
Demographics Similar to Paraguayans by No Vehicles in Household
In terms of no vehicles in household, the demographic groups most similar to Paraguayans are Belizean (14.3%, a difference of 0.13%), Immigrants from Jamaica (14.2%, a difference of 0.91%), Immigrants from Spain (14.5%, a difference of 1.3%), Pima (14.1%, a difference of 1.6%), and Immigrants from Panama (14.6%, a difference of 2.0%).
| Demographics | Rating | Rank | No Vehicles in Household |
| Hopi | 0.0 /100 | #288 | Tragic 13.7% |
| Immigrants | Australia | 0.0 /100 | #289 | Tragic 13.8% |
| Indians (Asian) | 0.0 /100 | #290 | Tragic 14.1% |
| Okinawans | 0.0 /100 | #291 | Tragic 14.1% |
| Pima | 0.0 /100 | #292 | Tragic 14.1% |
| Immigrants | Jamaica | 0.0 /100 | #293 | Tragic 14.2% |
| Belizeans | 0.0 /100 | #294 | Tragic 14.3% |
| Paraguayans | 0.0 /100 | #295 | Tragic 14.4% |
| Immigrants | Spain | 0.0 /100 | #296 | Tragic 14.5% |
| Immigrants | Panama | 0.0 /100 | #297 | Tragic 14.6% |
| Moroccans | 0.0 /100 | #298 | Tragic 14.7% |
| Immigrants | Greece | 0.0 /100 | #299 | Tragic 14.7% |
| Yuman | 0.0 /100 | #300 | Tragic 14.9% |
| Immigrants | Ukraine | 0.0 /100 | #301 | Tragic 14.9% |
| Haitians | 0.0 /100 | #302 | Tragic 14.9% |