Immigrants from El Salvador vs German Russian 4 or more Vehicles in Household
COMPARE
Immigrants from El Salvador
German Russian
4 or more Vehicles in Household
4 or more Vehicles in Household Comparison
Immigrants from El Salvador
German Russians
7.7%
4 OR MORE VEHICLES IN HOUSEHOLD
100.0/ 100
METRIC RATING
50th/ 347
METRIC RANK
7.0%
4 OR MORE VEHICLES IN HOUSEHOLD
98.3/ 100
METRIC RATING
105th/ 347
METRIC RANK
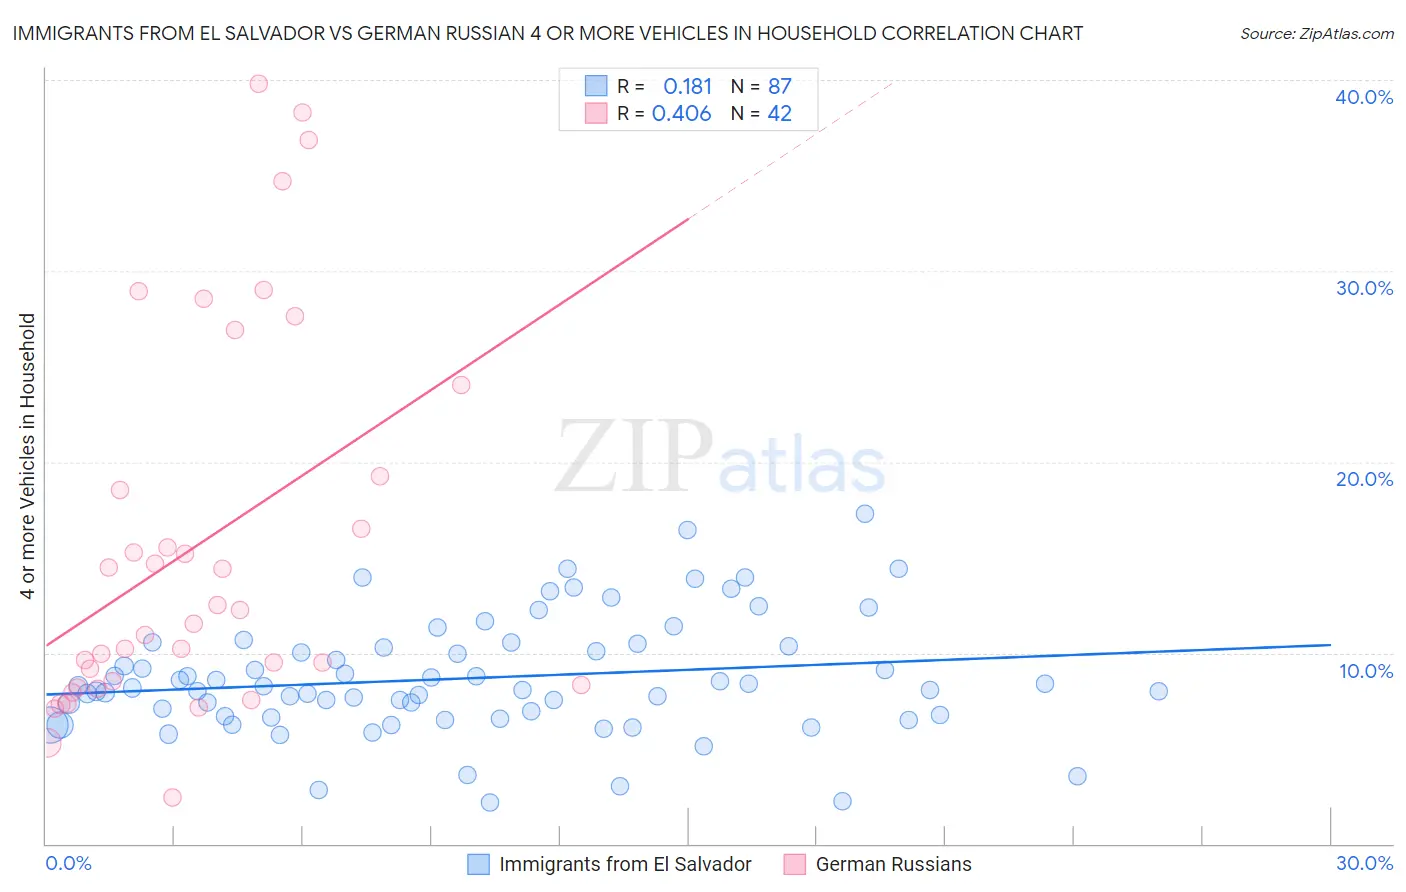
Immigrants from El Salvador vs German Russian 4 or more Vehicles in Household Correlation Chart
The statistical analysis conducted on geographies consisting of 356,356,218 people shows a poor positive correlation between the proportion of Immigrants from El Salvador and percentage of households with 4 or more vehicles available in the United States with a correlation coefficient (R) of 0.181 and weighted average of 7.7%. Similarly, the statistical analysis conducted on geographies consisting of 96,366,616 people shows a moderate positive correlation between the proportion of German Russians and percentage of households with 4 or more vehicles available in the United States with a correlation coefficient (R) of 0.406 and weighted average of 7.0%, a difference of 10.8%.
4 or more Vehicles in Household Correlation Summary
| Measurement | Immigrants from El Salvador | German Russian |
| Minimum | 2.1% | 2.4% |
| Maximum | 17.3% | 39.8% |
| Range | 15.2% | 37.3% |
| Mean | 8.7% | 15.7% |
| Median | 8.2% | 11.9% |
| Interquartile 25% (IQ1) | 6.7% | 8.3% |
| Interquartile 75% (IQ3) | 10.4% | 19.2% |
| Interquartile Range (IQR) | 3.7% | 10.9% |
| Standard Deviation (Sample) | 3.0% | 9.9% |
| Standard Deviation (Population) | 3.0% | 9.8% |
Similar Demographics by 4 or more Vehicles in Household
Demographics Similar to Immigrants from El Salvador by 4 or more Vehicles in Household
In terms of 4 or more vehicles in household, the demographic groups most similar to Immigrants from El Salvador are Cherokee (7.7%, a difference of 0.16%), Swiss (7.8%, a difference of 0.35%), Immigrants from Laos (7.7%, a difference of 0.35%), Japanese (7.7%, a difference of 0.47%), and Osage (7.8%, a difference of 0.52%).
| Demographics | Rating | Rank | 4 or more Vehicles in Household |
| Fijians | 100.0 /100 | #43 | Exceptional 7.8% |
| Bhutanese | 100.0 /100 | #44 | Exceptional 7.8% |
| Choctaw | 100.0 /100 | #45 | Exceptional 7.8% |
| Crow | 100.0 /100 | #46 | Exceptional 7.8% |
| Osage | 100.0 /100 | #47 | Exceptional 7.8% |
| Swiss | 100.0 /100 | #48 | Exceptional 7.8% |
| Cherokee | 100.0 /100 | #49 | Exceptional 7.7% |
| Immigrants | El Salvador | 100.0 /100 | #50 | Exceptional 7.7% |
| Immigrants | Laos | 100.0 /100 | #51 | Exceptional 7.7% |
| Japanese | 100.0 /100 | #52 | Exceptional 7.7% |
| Malaysians | 100.0 /100 | #53 | Exceptional 7.7% |
| Dutch | 100.0 /100 | #54 | Exceptional 7.7% |
| Immigrants | Oceania | 100.0 /100 | #55 | Exceptional 7.6% |
| English | 100.0 /100 | #56 | Exceptional 7.6% |
| Pennsylvania Germans | 100.0 /100 | #57 | Exceptional 7.6% |
Demographics Similar to German Russians by 4 or more Vehicles in Household
In terms of 4 or more vehicles in household, the demographic groups most similar to German Russians are Hmong (7.0%, a difference of 0.0%), Guatemalan (7.0%, a difference of 0.34%), Nicaraguan (7.0%, a difference of 0.36%), Blackfeet (7.0%, a difference of 0.48%), and Asian (7.0%, a difference of 0.49%).
| Demographics | Rating | Rank | 4 or more Vehicles in Household |
| Irish | 99.0 /100 | #98 | Exceptional 7.1% |
| Seminole | 98.8 /100 | #99 | Exceptional 7.0% |
| Taiwanese | 98.7 /100 | #100 | Exceptional 7.0% |
| Pakistanis | 98.7 /100 | #101 | Exceptional 7.0% |
| Asians | 98.6 /100 | #102 | Exceptional 7.0% |
| Blackfeet | 98.6 /100 | #103 | Exceptional 7.0% |
| Hmong | 98.3 /100 | #104 | Exceptional 7.0% |
| German Russians | 98.3 /100 | #105 | Exceptional 7.0% |
| Guatemalans | 98.1 /100 | #106 | Exceptional 7.0% |
| Nicaraguans | 98.0 /100 | #107 | Exceptional 7.0% |
| French | 97.7 /100 | #108 | Exceptional 6.9% |
| Filipinos | 97.6 /100 | #109 | Exceptional 6.9% |
| Immigrants | Thailand | 97.0 /100 | #110 | Exceptional 6.9% |
| Aleuts | 97.0 /100 | #111 | Exceptional 6.9% |
| Hopi | 97.0 /100 | #112 | Exceptional 6.9% |