Immigrants from Eastern Africa vs Latvian No Vehicles in Household
COMPARE
Immigrants from Eastern Africa
Latvian
No Vehicles in Household
No Vehicles in Household Comparison
Immigrants from Eastern Africa
Latvians
10.0%
NO VEHICLES IN HOUSEHOLD
73.8/ 100
METRIC RATING
151st/ 347
METRIC RANK
9.8%
NO VEHICLES IN HOUSEHOLD
85.1/ 100
METRIC RATING
135th/ 347
METRIC RANK
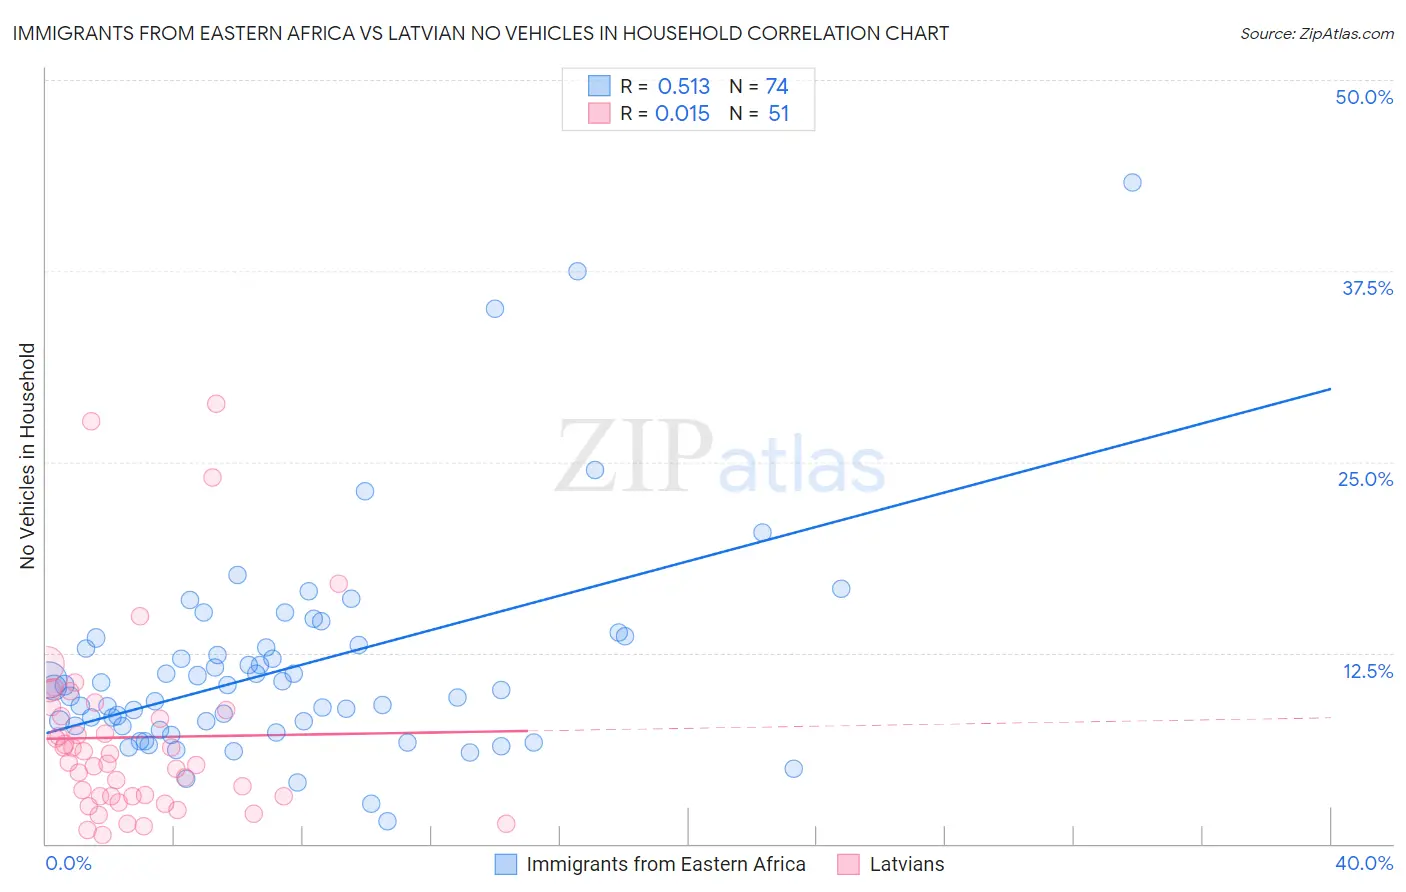
Immigrants from Eastern Africa vs Latvian No Vehicles in Household Correlation Chart
The statistical analysis conducted on geographies consisting of 354,399,030 people shows a substantial positive correlation between the proportion of Immigrants from Eastern Africa and percentage of households with no vehicle available in the United States with a correlation coefficient (R) of 0.513 and weighted average of 10.0%. Similarly, the statistical analysis conducted on geographies consisting of 220,382,965 people shows no correlation between the proportion of Latvians and percentage of households with no vehicle available in the United States with a correlation coefficient (R) of 0.015 and weighted average of 9.8%, a difference of 2.5%.
No Vehicles in Household Correlation Summary
| Measurement | Immigrants from Eastern Africa | Latvian |
| Minimum | 1.4% | 0.54% |
| Maximum | 43.3% | 28.8% |
| Range | 41.9% | 28.3% |
| Mean | 11.5% | 7.0% |
| Median | 10.1% | 5.3% |
| Interquartile 25% (IQ1) | 7.7% | 3.1% |
| Interquartile 75% (IQ3) | 13.0% | 8.8% |
| Interquartile Range (IQR) | 5.3% | 5.7% |
| Standard Deviation (Sample) | 7.1% | 6.1% |
| Standard Deviation (Population) | 7.0% | 6.1% |
Demographics Similar to Immigrants from Eastern Africa and Latvians by No Vehicles in Household
In terms of no vehicles in household, the demographic groups most similar to Immigrants from Eastern Africa are Colombian (10.0%, a difference of 0.010%), Immigrants from Congo (10.1%, a difference of 0.14%), Tlingit-Haida (10.1%, a difference of 0.23%), Immigrants from Uganda (10.0%, a difference of 0.42%), and Immigrants from Bosnia and Herzegovina (9.9%, a difference of 1.1%). Similarly, the demographic groups most similar to Latvians are Immigrants from South Africa (9.8%, a difference of 0.050%), Immigrants from Moldova (9.8%, a difference of 0.15%), Estonian (9.8%, a difference of 0.27%), Marshallese (9.8%, a difference of 0.31%), and Immigrants from Lithuania (9.8%, a difference of 0.32%).
| Demographics | Rating | Rank | No Vehicles in Household |
| Immigrants | Oceania | 87.1 /100 | #133 | Excellent 9.7% |
| Syrians | 87.1 /100 | #134 | Excellent 9.7% |
| Latvians | 85.1 /100 | #135 | Excellent 9.8% |
| Immigrants | South Africa | 85.0 /100 | #136 | Excellent 9.8% |
| Immigrants | Moldova | 84.6 /100 | #137 | Excellent 9.8% |
| Estonians | 84.2 /100 | #138 | Excellent 9.8% |
| Marshallese | 84.0 /100 | #139 | Excellent 9.8% |
| Immigrants | Lithuania | 84.0 /100 | #140 | Excellent 9.8% |
| Sudanese | 83.1 /100 | #141 | Excellent 9.8% |
| Immigrants | Zimbabwe | 82.6 /100 | #142 | Excellent 9.9% |
| Chileans | 81.2 /100 | #143 | Excellent 9.9% |
| Immigrants | Bahamas | 81.2 /100 | #144 | Excellent 9.9% |
| Bahamians | 81.0 /100 | #145 | Excellent 9.9% |
| Hungarians | 80.0 /100 | #146 | Excellent 9.9% |
| Immigrants | Nicaragua | 79.8 /100 | #147 | Good 9.9% |
| Immigrants | Bosnia and Herzegovina | 79.1 /100 | #148 | Good 9.9% |
| Immigrants | Uganda | 76.1 /100 | #149 | Good 10.0% |
| Colombians | 73.9 /100 | #150 | Good 10.0% |
| Immigrants | Eastern Africa | 73.8 /100 | #151 | Good 10.0% |
| Immigrants | Congo | 73.0 /100 | #152 | Good 10.1% |
| Tlingit-Haida | 72.5 /100 | #153 | Good 10.1% |