Immigrants from Denmark vs Paraguayan No Vehicles in Household
COMPARE
Immigrants from Denmark
Paraguayan
No Vehicles in Household
No Vehicles in Household Comparison
Immigrants from Denmark
Paraguayans
11.1%
NO VEHICLES IN HOUSEHOLD
12.1/ 100
METRIC RATING
214th/ 347
METRIC RANK
14.4%
NO VEHICLES IN HOUSEHOLD
0.0/ 100
METRIC RATING
295th/ 347
METRIC RANK
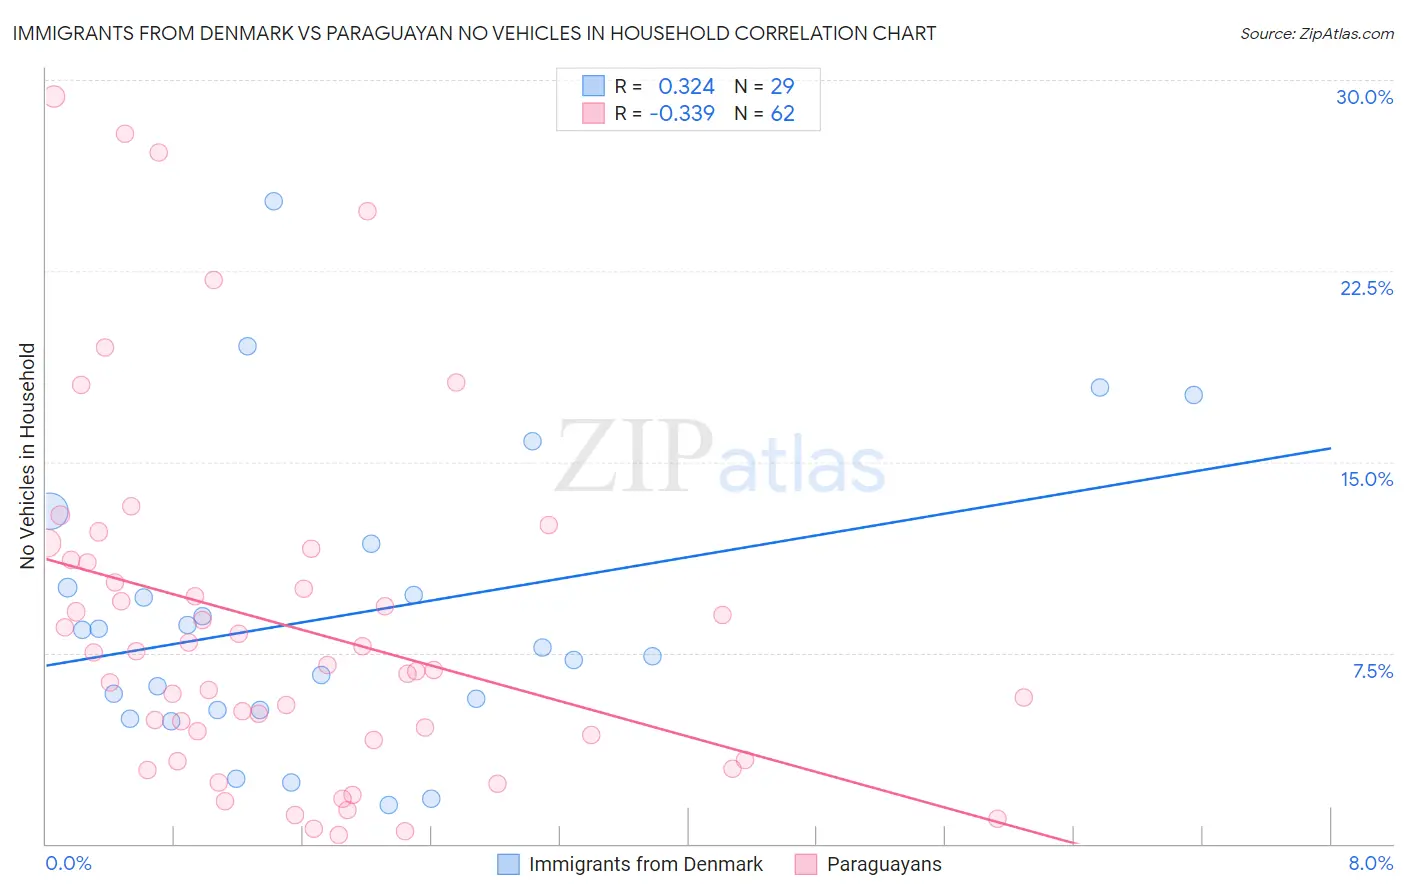
Immigrants from Denmark vs Paraguayan No Vehicles in Household Correlation Chart
The statistical analysis conducted on geographies consisting of 136,239,096 people shows a mild positive correlation between the proportion of Immigrants from Denmark and percentage of households with no vehicle available in the United States with a correlation coefficient (R) of 0.324 and weighted average of 11.1%. Similarly, the statistical analysis conducted on geographies consisting of 94,954,022 people shows a mild negative correlation between the proportion of Paraguayans and percentage of households with no vehicle available in the United States with a correlation coefficient (R) of -0.339 and weighted average of 14.4%, a difference of 29.3%.
No Vehicles in Household Correlation Summary
| Measurement | Immigrants from Denmark | Paraguayan |
| Minimum | 1.5% | 0.32% |
| Maximum | 25.2% | 29.4% |
| Range | 23.7% | 29.0% |
| Mean | 9.0% | 8.5% |
| Median | 7.7% | 6.9% |
| Interquartile 25% (IQ1) | 5.2% | 4.1% |
| Interquartile 75% (IQ3) | 10.9% | 11.1% |
| Interquartile Range (IQR) | 5.7% | 7.0% |
| Standard Deviation (Sample) | 5.7% | 6.9% |
| Standard Deviation (Population) | 5.6% | 6.8% |
Similar Demographics by No Vehicles in Household
Demographics Similar to Immigrants from Denmark by No Vehicles in Household
In terms of no vehicles in household, the demographic groups most similar to Immigrants from Denmark are Immigrants from Hungary (11.1%, a difference of 0.070%), Immigrants from Sri Lanka (11.2%, a difference of 0.46%), Immigrants from Argentina (11.2%, a difference of 0.46%), Immigrants from Western Asia (11.0%, a difference of 0.51%), and Crow (11.0%, a difference of 0.59%).
| Demographics | Rating | Rank | No Vehicles in Household |
| Sierra Leoneans | 15.7 /100 | #207 | Poor 11.0% |
| Immigrants | Italy | 15.6 /100 | #208 | Poor 11.0% |
| Pennsylvania Germans | 15.5 /100 | #209 | Poor 11.0% |
| Apache | 14.8 /100 | #210 | Poor 11.0% |
| Crow | 14.2 /100 | #211 | Poor 11.0% |
| Immigrants | Western Asia | 13.9 /100 | #212 | Poor 11.0% |
| Immigrants | Hungary | 12.3 /100 | #213 | Poor 11.1% |
| Immigrants | Denmark | 12.1 /100 | #214 | Poor 11.1% |
| Immigrants | Sri Lanka | 10.6 /100 | #215 | Poor 11.2% |
| Immigrants | Argentina | 10.6 /100 | #216 | Poor 11.2% |
| Dutch West Indians | 10.2 /100 | #217 | Poor 11.2% |
| Immigrants | Guatemala | 10.0 /100 | #218 | Tragic 11.2% |
| Argentineans | 9.6 /100 | #219 | Tragic 11.2% |
| Immigrants | Zaire | 9.6 /100 | #220 | Tragic 11.2% |
| Peruvians | 8.4 /100 | #221 | Tragic 11.2% |
Demographics Similar to Paraguayans by No Vehicles in Household
In terms of no vehicles in household, the demographic groups most similar to Paraguayans are Belizean (14.3%, a difference of 0.13%), Immigrants from Jamaica (14.2%, a difference of 0.91%), Immigrants from Spain (14.5%, a difference of 1.3%), Pima (14.1%, a difference of 1.6%), and Immigrants from Panama (14.6%, a difference of 2.0%).
| Demographics | Rating | Rank | No Vehicles in Household |
| Hopi | 0.0 /100 | #288 | Tragic 13.7% |
| Immigrants | Australia | 0.0 /100 | #289 | Tragic 13.8% |
| Indians (Asian) | 0.0 /100 | #290 | Tragic 14.1% |
| Okinawans | 0.0 /100 | #291 | Tragic 14.1% |
| Pima | 0.0 /100 | #292 | Tragic 14.1% |
| Immigrants | Jamaica | 0.0 /100 | #293 | Tragic 14.2% |
| Belizeans | 0.0 /100 | #294 | Tragic 14.3% |
| Paraguayans | 0.0 /100 | #295 | Tragic 14.4% |
| Immigrants | Spain | 0.0 /100 | #296 | Tragic 14.5% |
| Immigrants | Panama | 0.0 /100 | #297 | Tragic 14.6% |
| Moroccans | 0.0 /100 | #298 | Tragic 14.7% |
| Immigrants | Greece | 0.0 /100 | #299 | Tragic 14.7% |
| Yuman | 0.0 /100 | #300 | Tragic 14.9% |
| Immigrants | Ukraine | 0.0 /100 | #301 | Tragic 14.9% |
| Haitians | 0.0 /100 | #302 | Tragic 14.9% |