Immigrants from Denmark vs Trinidadian and Tobagonian No Vehicles in Household
COMPARE
Immigrants from Denmark
Trinidadian and Tobagonian
No Vehicles in Household
No Vehicles in Household Comparison
Immigrants from Denmark
Trinidadians and Tobagonians
11.1%
NO VEHICLES IN HOUSEHOLD
12.1/ 100
METRIC RATING
214th/ 347
METRIC RANK
23.7%
NO VEHICLES IN HOUSEHOLD
0.0/ 100
METRIC RATING
331st/ 347
METRIC RANK
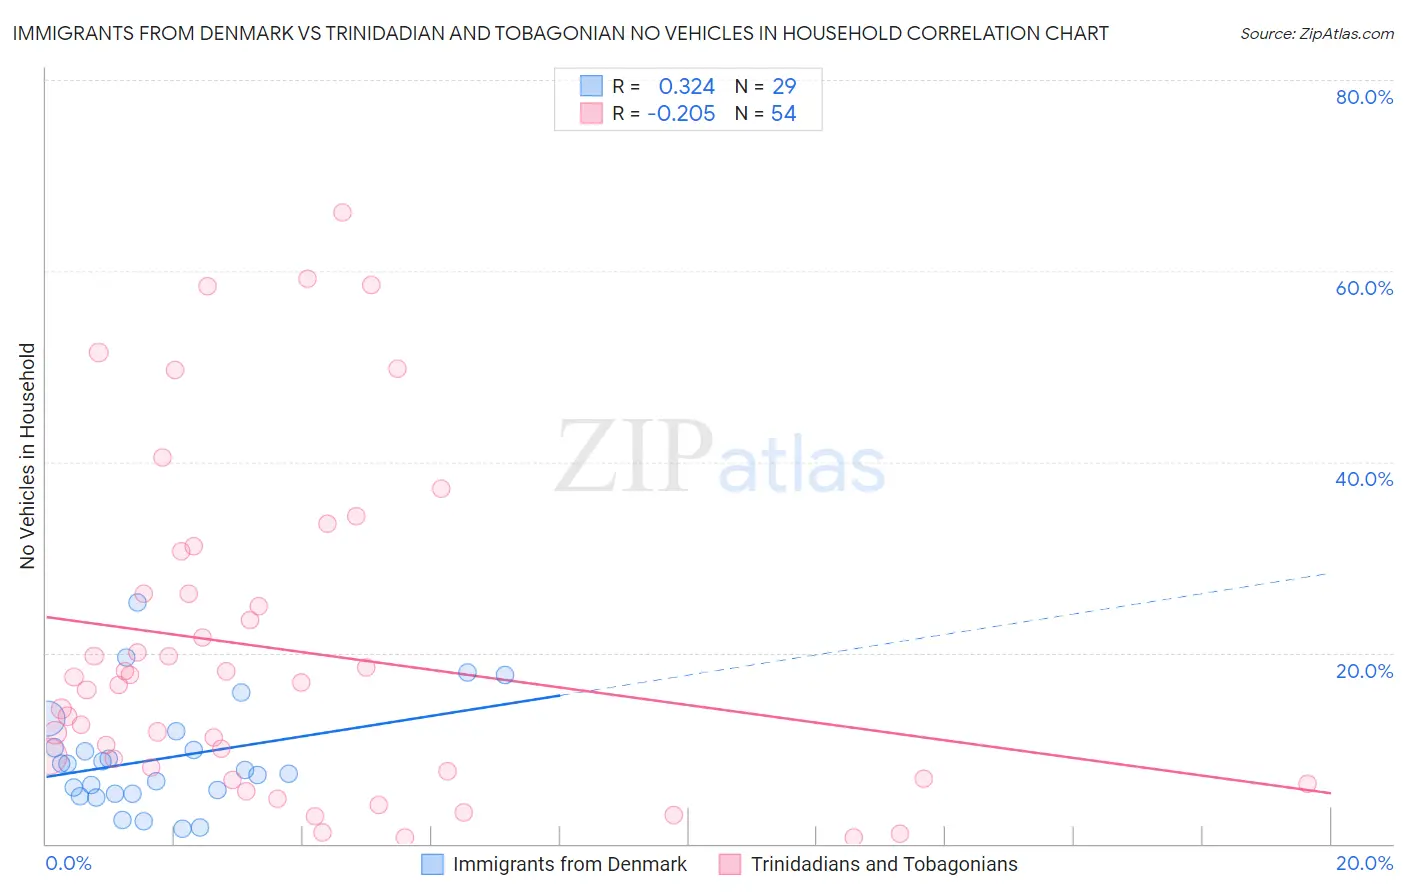
Immigrants from Denmark vs Trinidadian and Tobagonian No Vehicles in Household Correlation Chart
The statistical analysis conducted on geographies consisting of 136,239,096 people shows a mild positive correlation between the proportion of Immigrants from Denmark and percentage of households with no vehicle available in the United States with a correlation coefficient (R) of 0.324 and weighted average of 11.1%. Similarly, the statistical analysis conducted on geographies consisting of 219,596,743 people shows a weak negative correlation between the proportion of Trinidadians and Tobagonians and percentage of households with no vehicle available in the United States with a correlation coefficient (R) of -0.205 and weighted average of 23.7%, a difference of 113.9%.
No Vehicles in Household Correlation Summary
| Measurement | Immigrants from Denmark | Trinidadian and Tobagonian |
| Minimum | 1.5% | 0.62% |
| Maximum | 25.2% | 66.1% |
| Range | 23.7% | 65.5% |
| Mean | 9.0% | 20.3% |
| Median | 7.7% | 16.8% |
| Interquartile 25% (IQ1) | 5.2% | 7.5% |
| Interquartile 75% (IQ3) | 10.9% | 26.2% |
| Interquartile Range (IQR) | 5.7% | 18.6% |
| Standard Deviation (Sample) | 5.7% | 17.1% |
| Standard Deviation (Population) | 5.6% | 17.0% |
Similar Demographics by No Vehicles in Household
Demographics Similar to Immigrants from Denmark by No Vehicles in Household
In terms of no vehicles in household, the demographic groups most similar to Immigrants from Denmark are Immigrants from Hungary (11.1%, a difference of 0.070%), Immigrants from Sri Lanka (11.2%, a difference of 0.46%), Immigrants from Argentina (11.2%, a difference of 0.46%), Immigrants from Western Asia (11.0%, a difference of 0.51%), and Crow (11.0%, a difference of 0.59%).
| Demographics | Rating | Rank | No Vehicles in Household |
| Sierra Leoneans | 15.7 /100 | #207 | Poor 11.0% |
| Immigrants | Italy | 15.6 /100 | #208 | Poor 11.0% |
| Pennsylvania Germans | 15.5 /100 | #209 | Poor 11.0% |
| Apache | 14.8 /100 | #210 | Poor 11.0% |
| Crow | 14.2 /100 | #211 | Poor 11.0% |
| Immigrants | Western Asia | 13.9 /100 | #212 | Poor 11.0% |
| Immigrants | Hungary | 12.3 /100 | #213 | Poor 11.1% |
| Immigrants | Denmark | 12.1 /100 | #214 | Poor 11.1% |
| Immigrants | Sri Lanka | 10.6 /100 | #215 | Poor 11.2% |
| Immigrants | Argentina | 10.6 /100 | #216 | Poor 11.2% |
| Dutch West Indians | 10.2 /100 | #217 | Poor 11.2% |
| Immigrants | Guatemala | 10.0 /100 | #218 | Tragic 11.2% |
| Argentineans | 9.6 /100 | #219 | Tragic 11.2% |
| Immigrants | Zaire | 9.6 /100 | #220 | Tragic 11.2% |
| Peruvians | 8.4 /100 | #221 | Tragic 11.2% |
Demographics Similar to Trinidadians and Tobagonians by No Vehicles in Household
In terms of no vehicles in household, the demographic groups most similar to Trinidadians and Tobagonians are West Indian (23.7%, a difference of 0.18%), Immigrants from Ecuador (23.8%, a difference of 0.33%), Immigrants from Trinidad and Tobago (24.6%, a difference of 3.7%), Ecuadorian (22.8%, a difference of 4.4%), and Immigrants from Dominica (22.2%, a difference of 6.8%).
| Demographics | Rating | Rank | No Vehicles in Household |
| Immigrants | Caribbean | 0.0 /100 | #324 | Tragic 19.6% |
| Senegalese | 0.0 /100 | #325 | Tragic 19.8% |
| Immigrants | West Indies | 0.0 /100 | #326 | Tragic 20.5% |
| Immigrants | Senegal | 0.0 /100 | #327 | Tragic 21.1% |
| Immigrants | Dominica | 0.0 /100 | #328 | Tragic 22.2% |
| Ecuadorians | 0.0 /100 | #329 | Tragic 22.8% |
| West Indians | 0.0 /100 | #330 | Tragic 23.7% |
| Trinidadians and Tobagonians | 0.0 /100 | #331 | Tragic 23.7% |
| Immigrants | Ecuador | 0.0 /100 | #332 | Tragic 23.8% |
| Immigrants | Trinidad and Tobago | 0.0 /100 | #333 | Tragic 24.6% |
| Immigrants | Bangladesh | 0.0 /100 | #334 | Tragic 25.8% |
| Barbadians | 0.0 /100 | #335 | Tragic 26.1% |
| Vietnamese | 0.0 /100 | #336 | Tragic 26.2% |
| Immigrants | Uzbekistan | 0.0 /100 | #337 | Tragic 26.7% |
| Guyanese | 0.0 /100 | #338 | Tragic 29.3% |