Immigrants from Cabo Verde vs Tohono O'odham No Vehicles in Household
COMPARE
Immigrants from Cabo Verde
Tohono O'odham
No Vehicles in Household
No Vehicles in Household Comparison
Immigrants from Cabo Verde
Tohono O'odham
18.4%
NO VEHICLES IN HOUSEHOLD
0.0/ 100
METRIC RATING
322nd/ 347
METRIC RANK
15.6%
NO VEHICLES IN HOUSEHOLD
0.0/ 100
METRIC RATING
313th/ 347
METRIC RANK
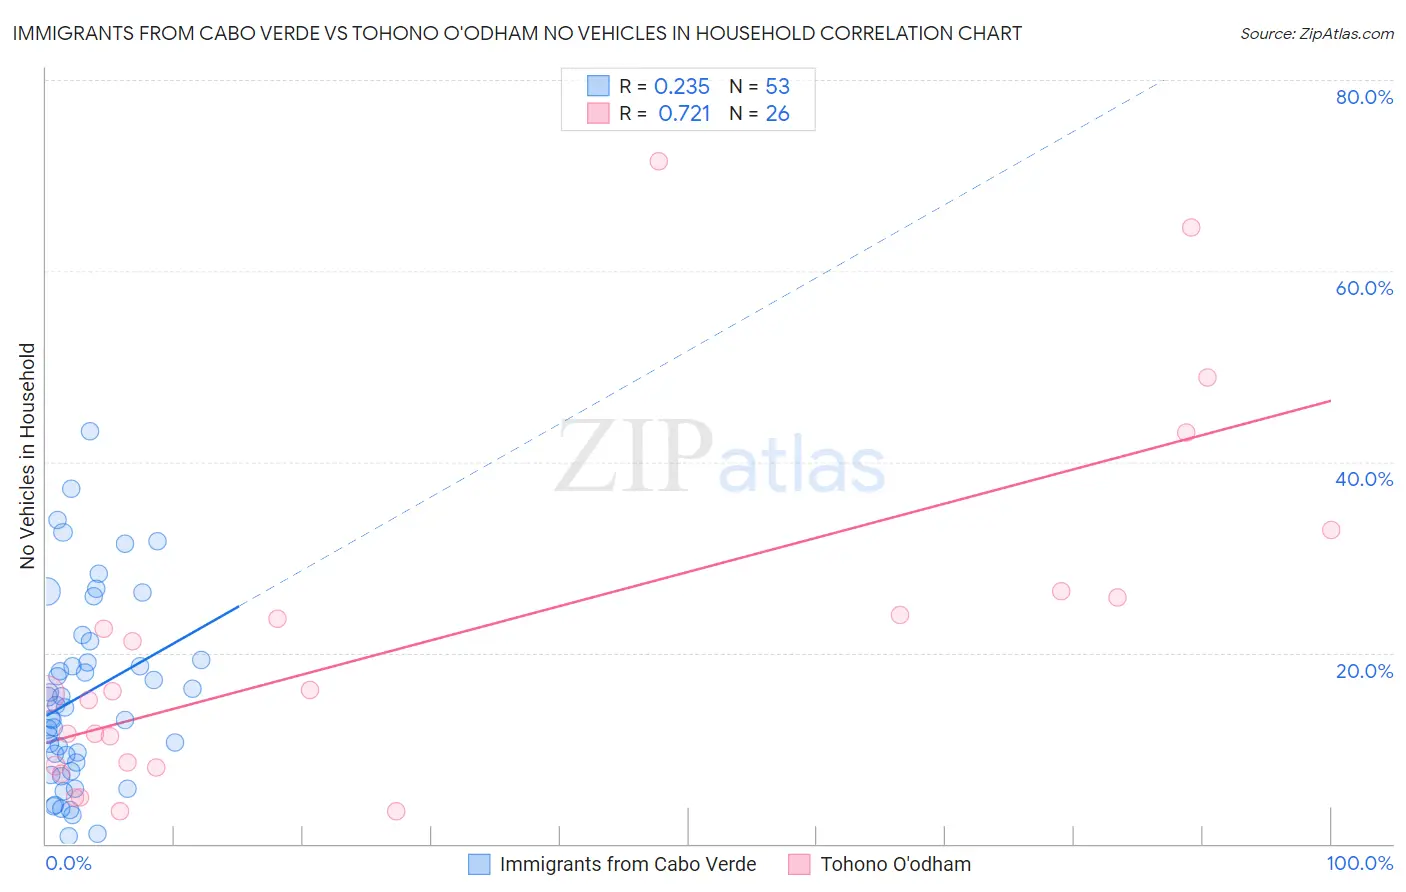
Immigrants from Cabo Verde vs Tohono O'odham No Vehicles in Household Correlation Chart
The statistical analysis conducted on geographies consisting of 38,112,129 people shows a weak positive correlation between the proportion of Immigrants from Cabo Verde and percentage of households with no vehicle available in the United States with a correlation coefficient (R) of 0.235 and weighted average of 18.4%. Similarly, the statistical analysis conducted on geographies consisting of 58,684,775 people shows a strong positive correlation between the proportion of Tohono O'odham and percentage of households with no vehicle available in the United States with a correlation coefficient (R) of 0.721 and weighted average of 15.6%, a difference of 18.1%.
No Vehicles in Household Correlation Summary
| Measurement | Immigrants from Cabo Verde | Tohono O'odham |
| Minimum | 0.74% | 3.4% |
| Maximum | 43.2% | 71.4% |
| Range | 42.5% | 68.0% |
| Mean | 15.6% | 21.2% |
| Median | 14.3% | 15.8% |
| Interquartile 25% (IQ1) | 8.1% | 8.2% |
| Interquartile 75% (IQ3) | 20.2% | 25.8% |
| Interquartile Range (IQR) | 12.1% | 17.5% |
| Standard Deviation (Sample) | 9.9% | 18.0% |
| Standard Deviation (Population) | 9.8% | 17.7% |
Demographics Similar to Immigrants from Cabo Verde and Tohono O'odham by No Vehicles in Household
In terms of no vehicles in household, the demographic groups most similar to Immigrants from Cabo Verde are Jamaican (17.9%, a difference of 2.9%), Immigrants from Yemen (19.5%, a difference of 5.6%), Soviet Union (17.4%, a difference of 5.8%), Alaska Native (17.4%, a difference of 6.0%), and Immigrants from Caribbean (19.6%, a difference of 6.3%). Similarly, the demographic groups most similar to Tohono O'odham are Alaskan Athabascan (15.6%, a difference of 0.15%), Albanian (15.6%, a difference of 0.16%), Cypriot (15.7%, a difference of 0.29%), Immigrants from Israel (15.6%, a difference of 0.30%), and Cape Verdean (15.6%, a difference of 0.31%).
| Demographics | Rating | Rank | No Vehicles in Household |
| Immigrants | Haiti | 0.0 /100 | #307 | Tragic 15.4% |
| U.S. Virgin Islanders | 0.0 /100 | #308 | Tragic 15.4% |
| Puerto Ricans | 0.0 /100 | #309 | Tragic 15.5% |
| Cape Verdeans | 0.0 /100 | #310 | Tragic 15.6% |
| Immigrants | Israel | 0.0 /100 | #311 | Tragic 15.6% |
| Alaskan Athabascans | 0.0 /100 | #312 | Tragic 15.6% |
| Tohono O'odham | 0.0 /100 | #313 | Tragic 15.6% |
| Albanians | 0.0 /100 | #314 | Tragic 15.6% |
| Cypriots | 0.0 /100 | #315 | Tragic 15.7% |
| Ghanaians | 0.0 /100 | #316 | Tragic 16.4% |
| Immigrants | Ghana | 0.0 /100 | #317 | Tragic 16.6% |
| Immigrants | Belarus | 0.0 /100 | #318 | Tragic 16.7% |
| Alaska Natives | 0.0 /100 | #319 | Tragic 17.4% |
| Soviet Union | 0.0 /100 | #320 | Tragic 17.4% |
| Jamaicans | 0.0 /100 | #321 | Tragic 17.9% |
| Immigrants | Cabo Verde | 0.0 /100 | #322 | Tragic 18.4% |
| Immigrants | Yemen | 0.0 /100 | #323 | Tragic 19.5% |
| Immigrants | Caribbean | 0.0 /100 | #324 | Tragic 19.6% |
| Senegalese | 0.0 /100 | #325 | Tragic 19.8% |
| Immigrants | West Indies | 0.0 /100 | #326 | Tragic 20.5% |
| Immigrants | Senegal | 0.0 /100 | #327 | Tragic 21.1% |