Dutch West Indian vs Tohono O'odham No Vehicles in Household
COMPARE
Dutch West Indian
Tohono O'odham
No Vehicles in Household
No Vehicles in Household Comparison
Dutch West Indians
Tohono O'odham
11.2%
NO VEHICLES IN HOUSEHOLD
10.2/ 100
METRIC RATING
217th/ 347
METRIC RANK
15.6%
NO VEHICLES IN HOUSEHOLD
0.0/ 100
METRIC RATING
313th/ 347
METRIC RANK
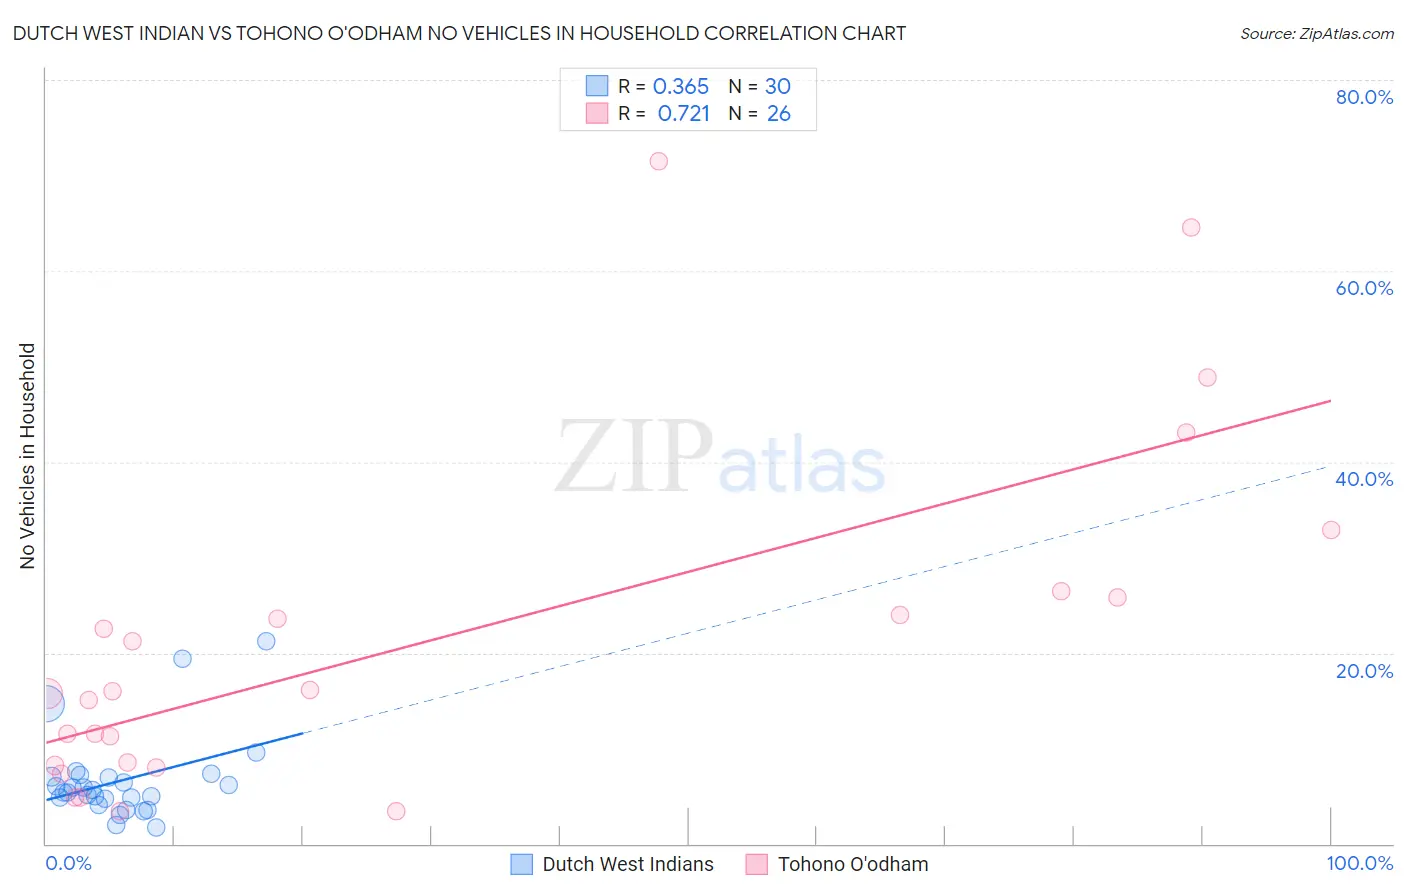
Dutch West Indian vs Tohono O'odham No Vehicles in Household Correlation Chart
The statistical analysis conducted on geographies consisting of 85,678,933 people shows a mild positive correlation between the proportion of Dutch West Indians and percentage of households with no vehicle available in the United States with a correlation coefficient (R) of 0.365 and weighted average of 11.2%. Similarly, the statistical analysis conducted on geographies consisting of 58,684,775 people shows a strong positive correlation between the proportion of Tohono O'odham and percentage of households with no vehicle available in the United States with a correlation coefficient (R) of 0.721 and weighted average of 15.6%, a difference of 39.9%.
No Vehicles in Household Correlation Summary
| Measurement | Dutch West Indian | Tohono O'odham |
| Minimum | 1.7% | 3.4% |
| Maximum | 21.2% | 71.4% |
| Range | 19.5% | 68.0% |
| Mean | 6.6% | 21.2% |
| Median | 5.5% | 15.8% |
| Interquartile 25% (IQ1) | 4.7% | 8.2% |
| Interquartile 75% (IQ3) | 7.0% | 25.8% |
| Interquartile Range (IQR) | 2.3% | 17.5% |
| Standard Deviation (Sample) | 4.4% | 18.0% |
| Standard Deviation (Population) | 4.3% | 17.7% |
Similar Demographics by No Vehicles in Household
Demographics Similar to Dutch West Indians by No Vehicles in Household
In terms of no vehicles in household, the demographic groups most similar to Dutch West Indians are Immigrants from Guatemala (11.2%, a difference of 0.10%), Immigrants from Argentina (11.2%, a difference of 0.12%), Immigrants from Sri Lanka (11.2%, a difference of 0.13%), Argentinean (11.2%, a difference of 0.23%), and Immigrants from Zaire (11.2%, a difference of 0.24%).
| Demographics | Rating | Rank | No Vehicles in Household |
| Apache | 14.8 /100 | #210 | Poor 11.0% |
| Crow | 14.2 /100 | #211 | Poor 11.0% |
| Immigrants | Western Asia | 13.9 /100 | #212 | Poor 11.0% |
| Immigrants | Hungary | 12.3 /100 | #213 | Poor 11.1% |
| Immigrants | Denmark | 12.1 /100 | #214 | Poor 11.1% |
| Immigrants | Sri Lanka | 10.6 /100 | #215 | Poor 11.2% |
| Immigrants | Argentina | 10.6 /100 | #216 | Poor 11.2% |
| Dutch West Indians | 10.2 /100 | #217 | Poor 11.2% |
| Immigrants | Guatemala | 10.0 /100 | #218 | Tragic 11.2% |
| Argentineans | 9.6 /100 | #219 | Tragic 11.2% |
| Immigrants | Zaire | 9.6 /100 | #220 | Tragic 11.2% |
| Peruvians | 8.4 /100 | #221 | Tragic 11.2% |
| Immigrants | South America | 8.0 /100 | #222 | Tragic 11.3% |
| Uruguayans | 7.7 /100 | #223 | Tragic 11.3% |
| Immigrants | Hong Kong | 7.2 /100 | #224 | Tragic 11.3% |
Demographics Similar to Tohono O'odham by No Vehicles in Household
In terms of no vehicles in household, the demographic groups most similar to Tohono O'odham are Alaskan Athabascan (15.6%, a difference of 0.15%), Albanian (15.6%, a difference of 0.16%), Cypriot (15.7%, a difference of 0.29%), Immigrants from Israel (15.6%, a difference of 0.30%), and Cape Verdean (15.6%, a difference of 0.31%).
| Demographics | Rating | Rank | No Vehicles in Household |
| Immigrants | Belize | 0.0 /100 | #306 | Tragic 15.4% |
| Immigrants | Haiti | 0.0 /100 | #307 | Tragic 15.4% |
| U.S. Virgin Islanders | 0.0 /100 | #308 | Tragic 15.4% |
| Puerto Ricans | 0.0 /100 | #309 | Tragic 15.5% |
| Cape Verdeans | 0.0 /100 | #310 | Tragic 15.6% |
| Immigrants | Israel | 0.0 /100 | #311 | Tragic 15.6% |
| Alaskan Athabascans | 0.0 /100 | #312 | Tragic 15.6% |
| Tohono O'odham | 0.0 /100 | #313 | Tragic 15.6% |
| Albanians | 0.0 /100 | #314 | Tragic 15.6% |
| Cypriots | 0.0 /100 | #315 | Tragic 15.7% |
| Ghanaians | 0.0 /100 | #316 | Tragic 16.4% |
| Immigrants | Ghana | 0.0 /100 | #317 | Tragic 16.6% |
| Immigrants | Belarus | 0.0 /100 | #318 | Tragic 16.7% |
| Alaska Natives | 0.0 /100 | #319 | Tragic 17.4% |
| Soviet Union | 0.0 /100 | #320 | Tragic 17.4% |