Immigrants from Cabo Verde vs Immigrants from Grenada No Vehicles in Household
COMPARE
Immigrants from Cabo Verde
Immigrants from Grenada
No Vehicles in Household
No Vehicles in Household Comparison
Immigrants from Cabo Verde
Immigrants from Grenada
18.4%
NO VEHICLES IN HOUSEHOLD
0.0/ 100
METRIC RATING
322nd/ 347
METRIC RANK
37.5%
NO VEHICLES IN HOUSEHOLD
0.0/ 100
METRIC RATING
346th/ 347
METRIC RANK
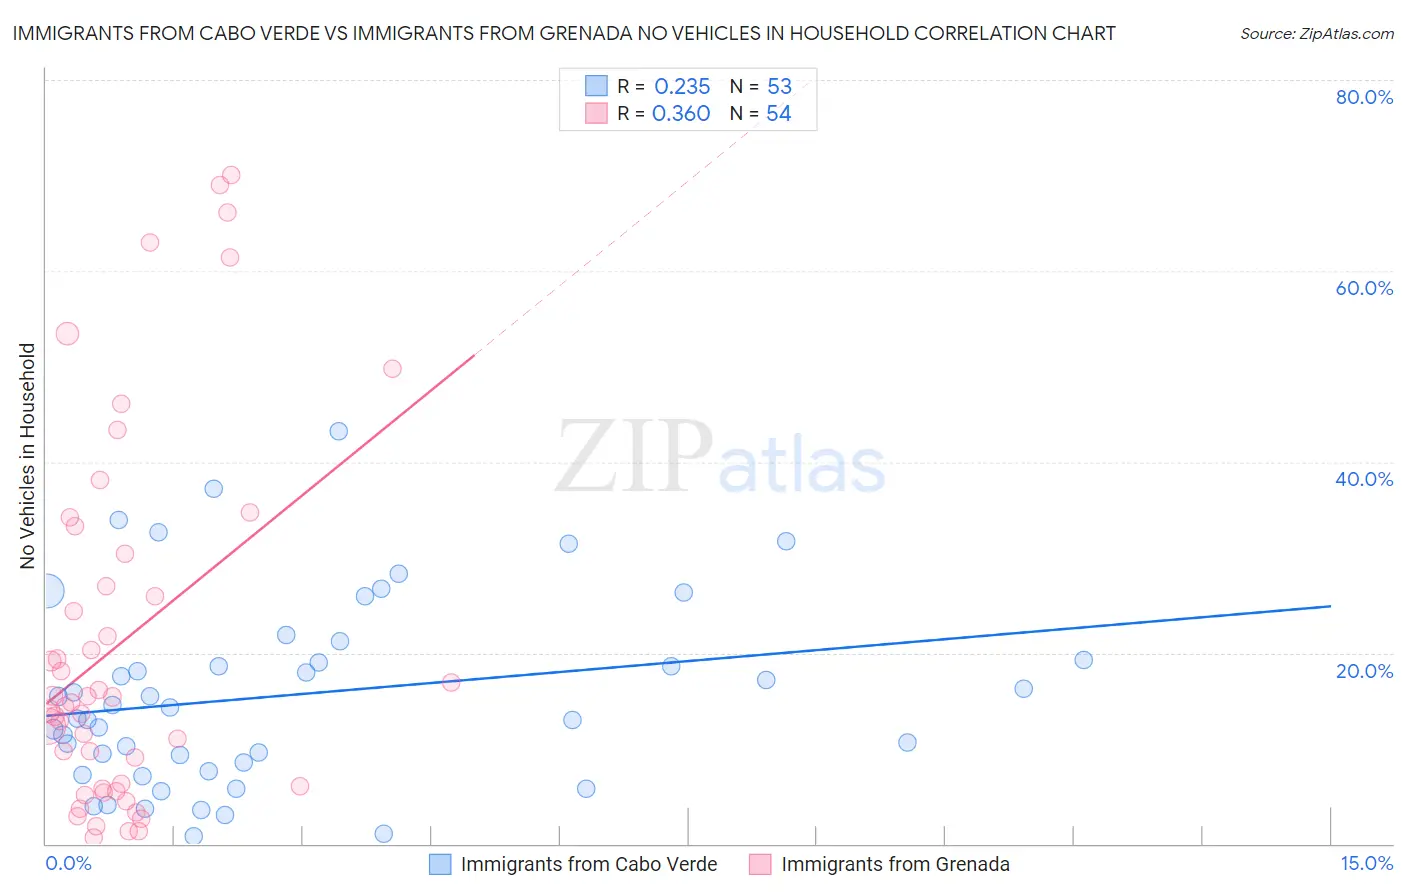
Immigrants from Cabo Verde vs Immigrants from Grenada No Vehicles in Household Correlation Chart
The statistical analysis conducted on geographies consisting of 38,112,129 people shows a weak positive correlation between the proportion of Immigrants from Cabo Verde and percentage of households with no vehicle available in the United States with a correlation coefficient (R) of 0.235 and weighted average of 18.4%. Similarly, the statistical analysis conducted on geographies consisting of 67,165,331 people shows a mild positive correlation between the proportion of Immigrants from Grenada and percentage of households with no vehicle available in the United States with a correlation coefficient (R) of 0.360 and weighted average of 37.5%, a difference of 103.1%.
No Vehicles in Household Correlation Summary
| Measurement | Immigrants from Cabo Verde | Immigrants from Grenada |
| Minimum | 0.74% | 0.72% |
| Maximum | 43.2% | 70.0% |
| Range | 42.5% | 69.3% |
| Mean | 15.6% | 21.3% |
| Median | 14.3% | 15.1% |
| Interquartile 25% (IQ1) | 8.1% | 6.0% |
| Interquartile 75% (IQ3) | 20.2% | 30.4% |
| Interquartile Range (IQR) | 12.1% | 24.4% |
| Standard Deviation (Sample) | 9.9% | 19.3% |
| Standard Deviation (Population) | 9.8% | 19.1% |
Similar Demographics by No Vehicles in Household
Demographics Similar to Immigrants from Cabo Verde by No Vehicles in Household
In terms of no vehicles in household, the demographic groups most similar to Immigrants from Cabo Verde are Jamaican (17.9%, a difference of 2.9%), Immigrants from Yemen (19.5%, a difference of 5.6%), Soviet Union (17.4%, a difference of 5.8%), Alaska Native (17.4%, a difference of 6.0%), and Immigrants from Caribbean (19.6%, a difference of 6.3%).
| Demographics | Rating | Rank | No Vehicles in Household |
| Cypriots | 0.0 /100 | #315 | Tragic 15.7% |
| Ghanaians | 0.0 /100 | #316 | Tragic 16.4% |
| Immigrants | Ghana | 0.0 /100 | #317 | Tragic 16.6% |
| Immigrants | Belarus | 0.0 /100 | #318 | Tragic 16.7% |
| Alaska Natives | 0.0 /100 | #319 | Tragic 17.4% |
| Soviet Union | 0.0 /100 | #320 | Tragic 17.4% |
| Jamaicans | 0.0 /100 | #321 | Tragic 17.9% |
| Immigrants | Cabo Verde | 0.0 /100 | #322 | Tragic 18.4% |
| Immigrants | Yemen | 0.0 /100 | #323 | Tragic 19.5% |
| Immigrants | Caribbean | 0.0 /100 | #324 | Tragic 19.6% |
| Senegalese | 0.0 /100 | #325 | Tragic 19.8% |
| Immigrants | West Indies | 0.0 /100 | #326 | Tragic 20.5% |
| Immigrants | Senegal | 0.0 /100 | #327 | Tragic 21.1% |
| Immigrants | Dominica | 0.0 /100 | #328 | Tragic 22.2% |
| Ecuadorians | 0.0 /100 | #329 | Tragic 22.8% |
Demographics Similar to Immigrants from Grenada by No Vehicles in Household
In terms of no vehicles in household, the demographic groups most similar to Immigrants from Grenada are Immigrants from St. Vincent and the Grenadines (35.4%, a difference of 5.8%), Immigrants from Dominican Republic (31.4%, a difference of 19.2%), Yup'ik (45.9%, a difference of 22.5%), Inupiat (29.9%, a difference of 25.5%), and British West Indian (29.7%, a difference of 26.0%).
| Demographics | Rating | Rank | No Vehicles in Household |
| Immigrants | Trinidad and Tobago | 0.0 /100 | #333 | Tragic 24.6% |
| Immigrants | Bangladesh | 0.0 /100 | #334 | Tragic 25.8% |
| Barbadians | 0.0 /100 | #335 | Tragic 26.1% |
| Vietnamese | 0.0 /100 | #336 | Tragic 26.2% |
| Immigrants | Uzbekistan | 0.0 /100 | #337 | Tragic 26.7% |
| Guyanese | 0.0 /100 | #338 | Tragic 29.3% |
| Dominicans | 0.0 /100 | #339 | Tragic 29.4% |
| Immigrants | Barbados | 0.0 /100 | #340 | Tragic 29.5% |
| Immigrants | Guyana | 0.0 /100 | #341 | Tragic 29.5% |
| British West Indians | 0.0 /100 | #342 | Tragic 29.7% |
| Inupiat | 0.0 /100 | #343 | Tragic 29.9% |
| Immigrants | Dominican Republic | 0.0 /100 | #344 | Tragic 31.4% |
| Immigrants | St. Vincent and the Grenadines | 0.0 /100 | #345 | Tragic 35.4% |
| Immigrants | Grenada | 0.0 /100 | #346 | Tragic 37.5% |
| Yup'ik | 0.0 /100 | #347 | Tragic 45.9% |