Houma vs Colville 3 or more Vehicles in Household
COMPARE
Houma
Colville
3 or more Vehicles in Household
3 or more Vehicles in Household Comparison
Houma
Colville
16.1%
3 OR MORE VEHICLES IN HOUSEHOLD
0.0/ 100
METRIC RATING
308th/ 347
METRIC RANK
25.8%
3 OR MORE VEHICLES IN HOUSEHOLD
100.0/ 100
METRIC RATING
7th/ 347
METRIC RANK
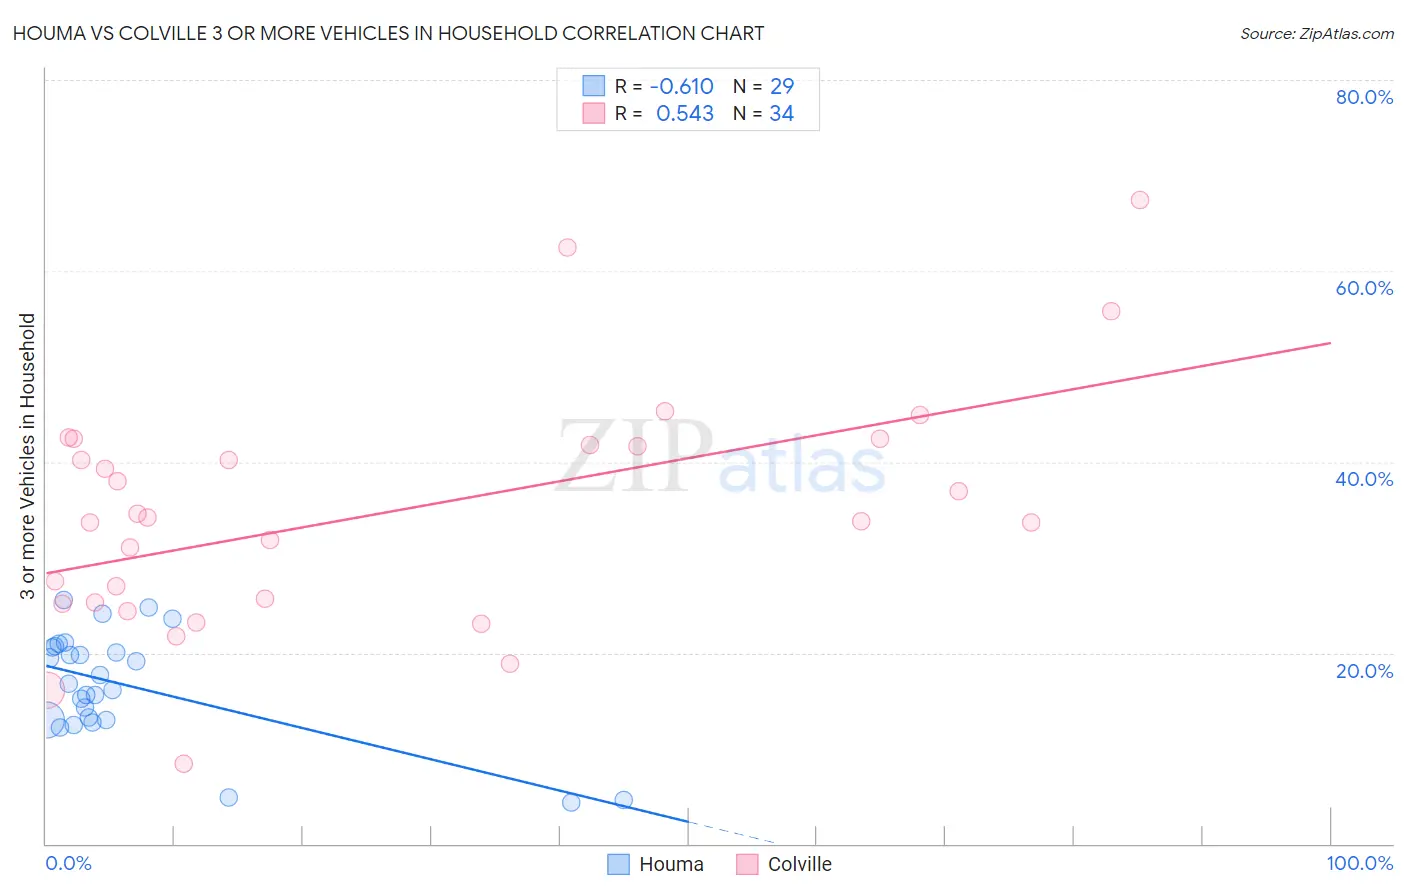
Houma vs Colville 3 or more Vehicles in Household Correlation Chart
The statistical analysis conducted on geographies consisting of 36,793,119 people shows a significant negative correlation between the proportion of Houma and percentage of households with 3 or more vehicles available in the United States with a correlation coefficient (R) of -0.610 and weighted average of 16.1%. Similarly, the statistical analysis conducted on geographies consisting of 34,682,856 people shows a substantial positive correlation between the proportion of Colville and percentage of households with 3 or more vehicles available in the United States with a correlation coefficient (R) of 0.543 and weighted average of 25.8%, a difference of 60.4%.
3 or more Vehicles in Household Correlation Summary
| Measurement | Houma | Colville |
| Minimum | 4.3% | 8.3% |
| Maximum | 25.5% | 67.5% |
| Range | 21.2% | 59.1% |
| Mean | 16.6% | 34.7% |
| Median | 16.7% | 34.0% |
| Interquartile 25% (IQ1) | 12.9% | 25.2% |
| Interquartile 75% (IQ3) | 20.6% | 41.7% |
| Interquartile Range (IQR) | 7.7% | 16.5% |
| Standard Deviation (Sample) | 5.7% | 12.5% |
| Standard Deviation (Population) | 5.6% | 12.3% |
Similar Demographics by 3 or more Vehicles in Household
Demographics Similar to Houma by 3 or more Vehicles in Household
In terms of 3 or more vehicles in household, the demographic groups most similar to Houma are Immigrants from Ghana (16.2%, a difference of 0.59%), Somali (16.2%, a difference of 0.74%), Immigrants from Somalia (15.9%, a difference of 0.92%), Moroccan (15.9%, a difference of 1.2%), and Immigrants from Morocco (16.3%, a difference of 1.6%).
| Demographics | Rating | Rank | 3 or more Vehicles in Household |
| Paraguayans | 0.0 /100 | #301 | Tragic 16.6% |
| Immigrants | Greece | 0.0 /100 | #302 | Tragic 16.5% |
| Immigrants | Serbia | 0.0 /100 | #303 | Tragic 16.4% |
| Ghanaians | 0.0 /100 | #304 | Tragic 16.4% |
| Immigrants | Morocco | 0.0 /100 | #305 | Tragic 16.3% |
| Somalis | 0.0 /100 | #306 | Tragic 16.2% |
| Immigrants | Ghana | 0.0 /100 | #307 | Tragic 16.2% |
| Houma | 0.0 /100 | #308 | Tragic 16.1% |
| Immigrants | Somalia | 0.0 /100 | #309 | Tragic 15.9% |
| Moroccans | 0.0 /100 | #310 | Tragic 15.9% |
| Albanians | 0.0 /100 | #311 | Tragic 15.8% |
| Puerto Ricans | 0.0 /100 | #312 | Tragic 15.6% |
| Immigrants | Israel | 0.0 /100 | #313 | Tragic 15.6% |
| Immigrants | Belarus | 0.0 /100 | #314 | Tragic 15.5% |
| Haitians | 0.0 /100 | #315 | Tragic 15.5% |
Demographics Similar to Colville by 3 or more Vehicles in Household
In terms of 3 or more vehicles in household, the demographic groups most similar to Colville are Immigrants from Fiji (26.1%, a difference of 1.1%), Puget Sound Salish (26.4%, a difference of 2.3%), Arapaho (26.4%, a difference of 2.7%), Tongan (26.5%, a difference of 3.0%), and Samoan (25.0%, a difference of 3.2%).
| Demographics | Rating | Rank | 3 or more Vehicles in Household |
| Yakama | 100.0 /100 | #1 | Exceptional 31.0% |
| Spanish American Indians | 100.0 /100 | #2 | Exceptional 26.9% |
| Tongans | 100.0 /100 | #3 | Exceptional 26.5% |
| Arapaho | 100.0 /100 | #4 | Exceptional 26.4% |
| Puget Sound Salish | 100.0 /100 | #5 | Exceptional 26.4% |
| Immigrants | Fiji | 100.0 /100 | #6 | Exceptional 26.1% |
| Colville | 100.0 /100 | #7 | Exceptional 25.8% |
| Samoans | 100.0 /100 | #8 | Exceptional 25.0% |
| Native Hawaiians | 100.0 /100 | #9 | Exceptional 24.9% |
| Nepalese | 100.0 /100 | #10 | Exceptional 24.9% |
| Shoshone | 100.0 /100 | #11 | Exceptional 24.9% |
| Danes | 100.0 /100 | #12 | Exceptional 24.7% |
| Mexicans | 100.0 /100 | #13 | Exceptional 24.7% |
| Immigrants | Mexico | 100.0 /100 | #14 | Exceptional 24.6% |
| Hawaiians | 100.0 /100 | #15 | Exceptional 24.3% |