Hopi vs Immigrants from Armenia No Vehicles in Household
COMPARE
Hopi
Immigrants from Armenia
No Vehicles in Household
No Vehicles in Household Comparison
Hopi
Immigrants from Armenia
13.7%
NO VEHICLES IN HOUSEHOLD
0.0/ 100
METRIC RATING
288th/ 347
METRIC RANK
10.6%
NO VEHICLES IN HOUSEHOLD
37.5/ 100
METRIC RATING
188th/ 347
METRIC RANK
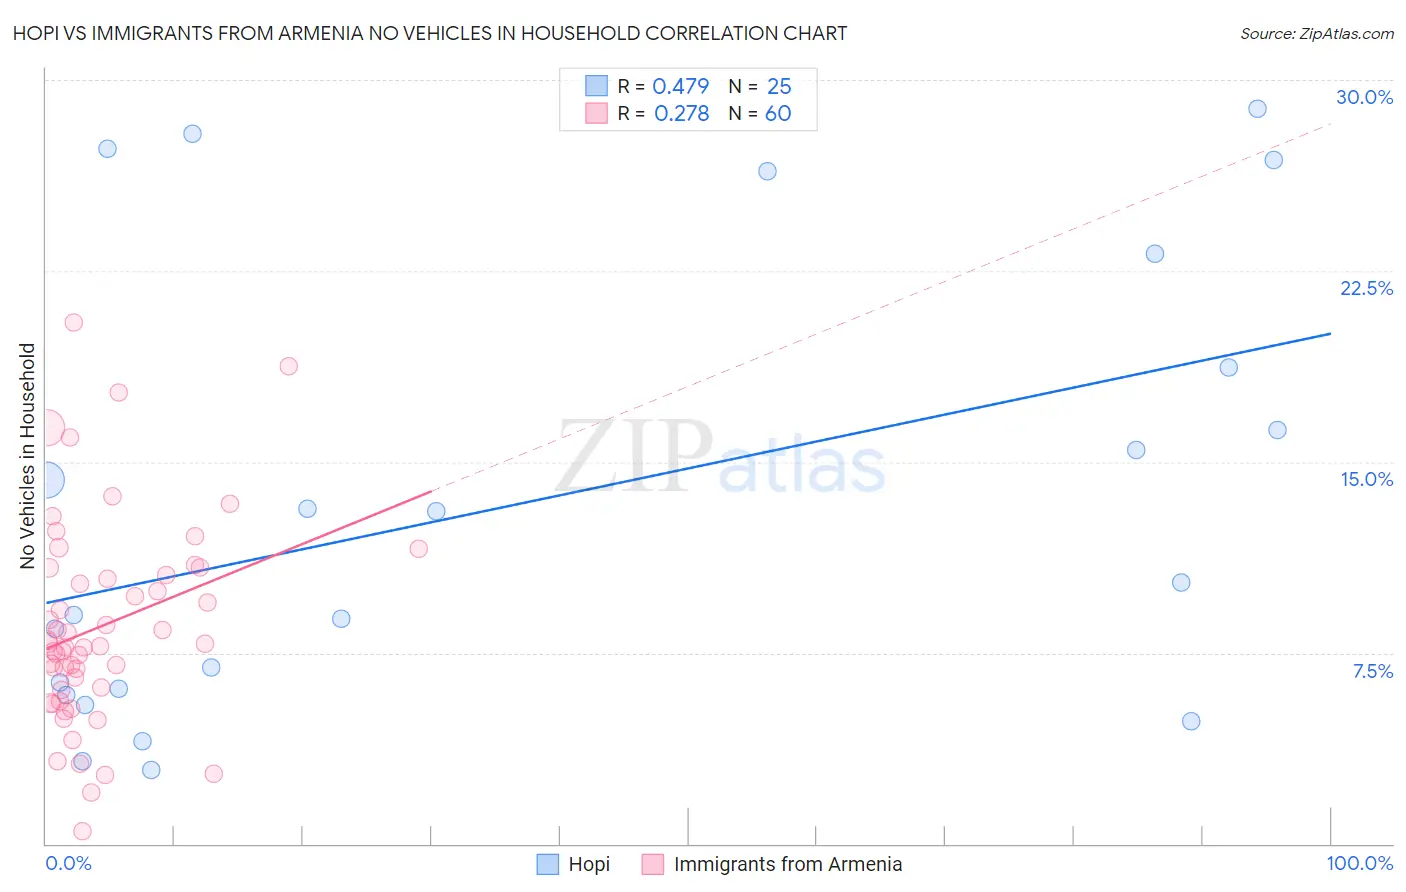
Hopi vs Immigrants from Armenia No Vehicles in Household Correlation Chart
The statistical analysis conducted on geographies consisting of 74,700,452 people shows a moderate positive correlation between the proportion of Hopi and percentage of households with no vehicle available in the United States with a correlation coefficient (R) of 0.479 and weighted average of 13.7%. Similarly, the statistical analysis conducted on geographies consisting of 97,544,259 people shows a weak positive correlation between the proportion of Immigrants from Armenia and percentage of households with no vehicle available in the United States with a correlation coefficient (R) of 0.278 and weighted average of 10.6%, a difference of 29.7%.
No Vehicles in Household Correlation Summary
| Measurement | Hopi | Immigrants from Armenia |
| Minimum | 2.9% | 0.48% |
| Maximum | 28.9% | 20.5% |
| Range | 26.0% | 20.0% |
| Mean | 13.3% | 8.6% |
| Median | 10.2% | 7.8% |
| Interquartile 25% (IQ1) | 5.9% | 6.1% |
| Interquartile 75% (IQ3) | 20.9% | 10.7% |
| Interquartile Range (IQR) | 15.0% | 4.6% |
| Standard Deviation (Sample) | 8.8% | 4.0% |
| Standard Deviation (Population) | 8.6% | 4.0% |
Similar Demographics by No Vehicles in Household
Demographics Similar to Hopi by No Vehicles in Household
In terms of no vehicles in household, the demographic groups most similar to Hopi are Immigrants from Ireland (13.7%, a difference of 0.13%), Colville (13.7%, a difference of 0.35%), Immigrants from Australia (13.8%, a difference of 0.66%), Immigrants from Eastern Europe (13.6%, a difference of 1.0%), and Immigrants from Malaysia (13.6%, a difference of 1.1%).
| Demographics | Rating | Rank | No Vehicles in Household |
| Central American Indians | 0.0 /100 | #281 | Tragic 13.3% |
| Immigrants | Eastern Asia | 0.0 /100 | #282 | Tragic 13.5% |
| Immigrants | Kazakhstan | 0.0 /100 | #283 | Tragic 13.6% |
| Immigrants | Malaysia | 0.0 /100 | #284 | Tragic 13.6% |
| Immigrants | Eastern Europe | 0.0 /100 | #285 | Tragic 13.6% |
| Colville | 0.0 /100 | #286 | Tragic 13.7% |
| Immigrants | Ireland | 0.0 /100 | #287 | Tragic 13.7% |
| Hopi | 0.0 /100 | #288 | Tragic 13.7% |
| Immigrants | Australia | 0.0 /100 | #289 | Tragic 13.8% |
| Indians (Asian) | 0.0 /100 | #290 | Tragic 14.1% |
| Okinawans | 0.0 /100 | #291 | Tragic 14.1% |
| Pima | 0.0 /100 | #292 | Tragic 14.1% |
| Immigrants | Jamaica | 0.0 /100 | #293 | Tragic 14.2% |
| Belizeans | 0.0 /100 | #294 | Tragic 14.3% |
| Paraguayans | 0.0 /100 | #295 | Tragic 14.4% |
Demographics Similar to Immigrants from Armenia by No Vehicles in Household
In terms of no vehicles in household, the demographic groups most similar to Immigrants from Armenia are Immigrants from Poland (10.6%, a difference of 0.12%), Immigrants from Eritrea (10.6%, a difference of 0.18%), Immigrants from North Macedonia (10.6%, a difference of 0.42%), German Russian (10.5%, a difference of 0.43%), and South American (10.5%, a difference of 0.62%).
| Demographics | Rating | Rank | No Vehicles in Household |
| Immigrants | Colombia | 44.1 /100 | #181 | Average 10.5% |
| Immigrants | Bulgaria | 43.8 /100 | #182 | Average 10.5% |
| Natives/Alaskans | 43.7 /100 | #183 | Average 10.5% |
| Immigrants | Nepal | 42.4 /100 | #184 | Average 10.5% |
| South Americans | 41.9 /100 | #185 | Average 10.5% |
| German Russians | 40.6 /100 | #186 | Average 10.5% |
| Immigrants | Poland | 38.4 /100 | #187 | Fair 10.6% |
| Immigrants | Armenia | 37.5 /100 | #188 | Fair 10.6% |
| Immigrants | Eritrea | 36.3 /100 | #189 | Fair 10.6% |
| Immigrants | North Macedonia | 34.6 /100 | #190 | Fair 10.6% |
| Immigrants | Northern Europe | 33.1 /100 | #191 | Fair 10.7% |
| Carpatho Rusyns | 32.1 /100 | #192 | Fair 10.7% |
| Ukrainians | 28.0 /100 | #193 | Fair 10.7% |
| Pueblo | 27.0 /100 | #194 | Fair 10.8% |
| Immigrants | Brazil | 26.3 /100 | #195 | Fair 10.8% |