Haitian vs Immigrants from Japan 1 or more Vehicles in Household
COMPARE
Haitian
Immigrants from Japan
1 or more Vehicles in Household
1 or more Vehicles in Household Comparison
Haitians
Immigrants from Japan
88.1%
1 OR MORE VEHICLES IN HOUSEHOLD
0.9/ 100
METRIC RATING
254th/ 347
METRIC RANK
88.7%
1 OR MORE VEHICLES IN HOUSEHOLD
4.9/ 100
METRIC RATING
232nd/ 347
METRIC RANK
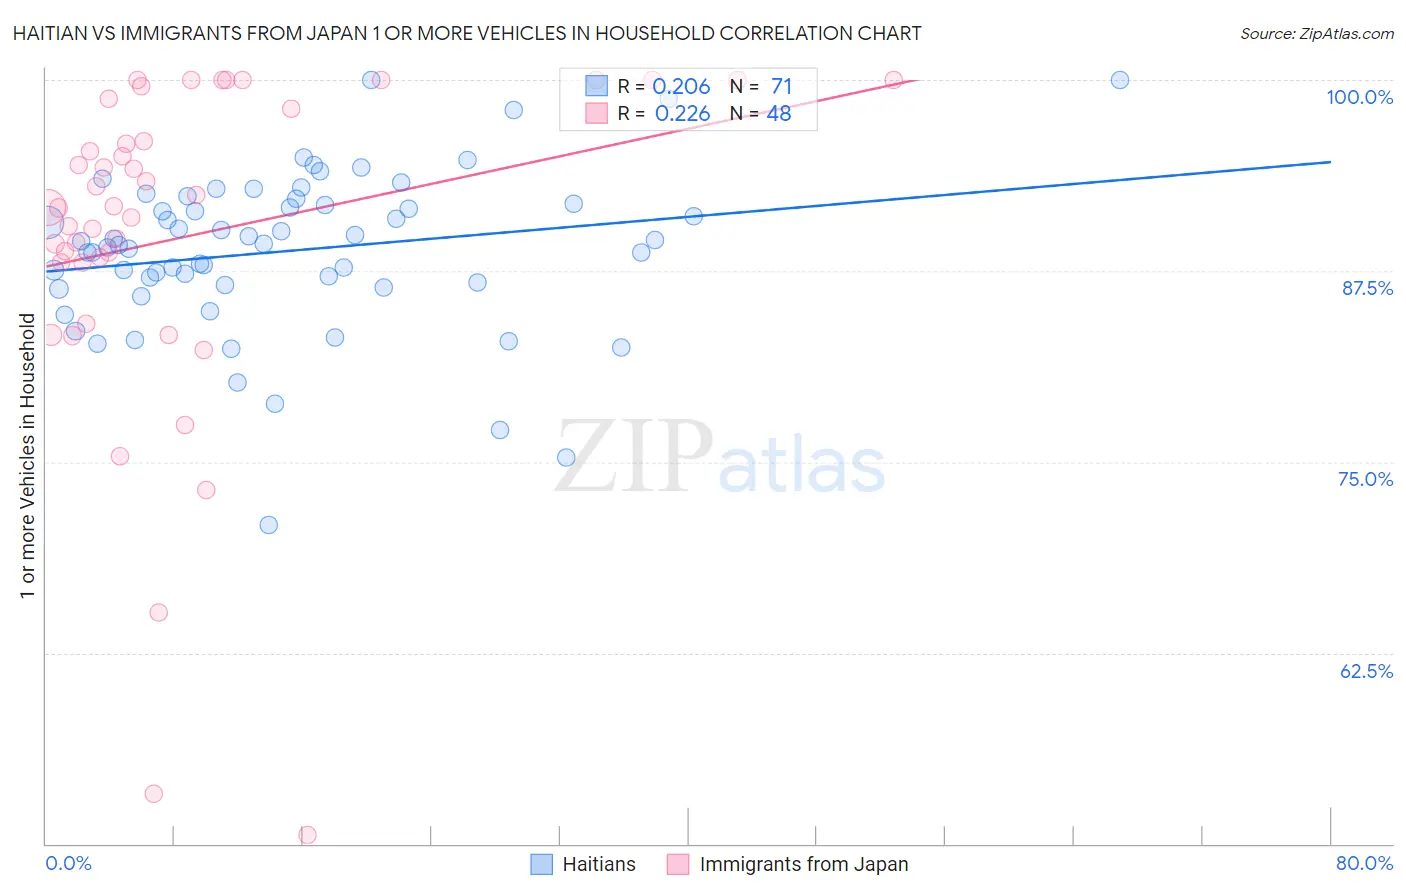
Haitian vs Immigrants from Japan 1 or more Vehicles in Household Correlation Chart
The statistical analysis conducted on geographies consisting of 275,276,712 people shows a weak positive correlation between the proportion of Haitians and percentage of households with 1 or more vehicles available in the United States with a correlation coefficient (R) of 0.206 and weighted average of 88.1%. Similarly, the statistical analysis conducted on geographies consisting of 340,026,937 people shows a weak positive correlation between the proportion of Immigrants from Japan and percentage of households with 1 or more vehicles available in the United States with a correlation coefficient (R) of 0.226 and weighted average of 88.7%, a difference of 0.67%.
1 or more Vehicles in Household Correlation Summary
| Measurement | Haitian | Immigrants from Japan |
| Minimum | 70.9% | 50.5% |
| Maximum | 100.0% | 100.0% |
| Range | 29.1% | 49.5% |
| Mean | 88.8% | 89.8% |
| Median | 89.3% | 91.7% |
| Interquartile 25% (IQ1) | 86.6% | 88.1% |
| Interquartile 75% (IQ3) | 91.9% | 98.4% |
| Interquartile Range (IQR) | 5.3% | 10.4% |
| Standard Deviation (Sample) | 5.3% | 11.2% |
| Standard Deviation (Population) | 5.2% | 11.1% |
Similar Demographics by 1 or more Vehicles in Household
Demographics Similar to Haitians by 1 or more Vehicles in Household
In terms of 1 or more vehicles in household, the demographic groups most similar to Haitians are Honduran (88.1%, a difference of 0.010%), Immigrants from Latvia (88.1%, a difference of 0.020%), Colombian (88.0%, a difference of 0.030%), Liberian (88.0%, a difference of 0.030%), and Immigrants from Uruguay (88.1%, a difference of 0.040%).
| Demographics | Rating | Rank | 1 or more Vehicles in Household |
| Immigrants | Honduras | 1.7 /100 | #247 | Tragic 88.3% |
| Immigrants | Nigeria | 1.5 /100 | #248 | Tragic 88.2% |
| Blacks/African Americans | 1.4 /100 | #249 | Tragic 88.2% |
| Egyptians | 1.2 /100 | #250 | Tragic 88.2% |
| Immigrants | Serbia | 1.2 /100 | #251 | Tragic 88.2% |
| Immigrants | Uruguay | 1.1 /100 | #252 | Tragic 88.1% |
| Hondurans | 1.0 /100 | #253 | Tragic 88.1% |
| Haitians | 0.9 /100 | #254 | Tragic 88.1% |
| Immigrants | Latvia | 0.9 /100 | #255 | Tragic 88.1% |
| Colombians | 0.9 /100 | #256 | Tragic 88.0% |
| Liberians | 0.9 /100 | #257 | Tragic 88.0% |
| South American Indians | 0.9 /100 | #258 | Tragic 88.0% |
| Nigerians | 0.8 /100 | #259 | Tragic 88.0% |
| Macedonians | 0.6 /100 | #260 | Tragic 87.9% |
| Immigrants | Switzerland | 0.6 /100 | #261 | Tragic 87.9% |
Demographics Similar to Immigrants from Japan by 1 or more Vehicles in Household
In terms of 1 or more vehicles in household, the demographic groups most similar to Immigrants from Japan are Russian (88.7%, a difference of 0.0%), Houma (88.6%, a difference of 0.010%), Immigrants from Sierra Leone (88.7%, a difference of 0.020%), Immigrants from Peru (88.6%, a difference of 0.020%), and Immigrants from Romania (88.7%, a difference of 0.030%).
| Demographics | Rating | Rank | 1 or more Vehicles in Household |
| Cree | 6.0 /100 | #225 | Tragic 88.7% |
| Cheyenne | 5.7 /100 | #226 | Tragic 88.7% |
| Ute | 5.6 /100 | #227 | Tragic 88.7% |
| Immigrants | Norway | 5.5 /100 | #228 | Tragic 88.7% |
| Immigrants | Romania | 5.4 /100 | #229 | Tragic 88.7% |
| Immigrants | Sierra Leone | 5.2 /100 | #230 | Tragic 88.7% |
| Russians | 5.0 /100 | #231 | Tragic 88.7% |
| Immigrants | Japan | 4.9 /100 | #232 | Tragic 88.7% |
| Houma | 4.8 /100 | #233 | Tragic 88.6% |
| Immigrants | Peru | 4.7 /100 | #234 | Tragic 88.6% |
| Paiute | 4.6 /100 | #235 | Tragic 88.6% |
| Immigrants | Pakistan | 4.5 /100 | #236 | Tragic 88.6% |
| Immigrants | Turkey | 4.4 /100 | #237 | Tragic 88.6% |
| Immigrants | Somalia | 4.2 /100 | #238 | Tragic 88.6% |
| Kiowa | 3.8 /100 | #239 | Tragic 88.6% |