Greek vs Paiute No Vehicles in Household
COMPARE
Greek
Paiute
No Vehicles in Household
No Vehicles in Household Comparison
Greeks
Paiute
9.5%
NO VEHICLES IN HOUSEHOLD
92.9/ 100
METRIC RATING
118th/ 347
METRIC RANK
11.8%
NO VEHICLES IN HOUSEHOLD
1.8/ 100
METRIC RATING
250th/ 347
METRIC RANK
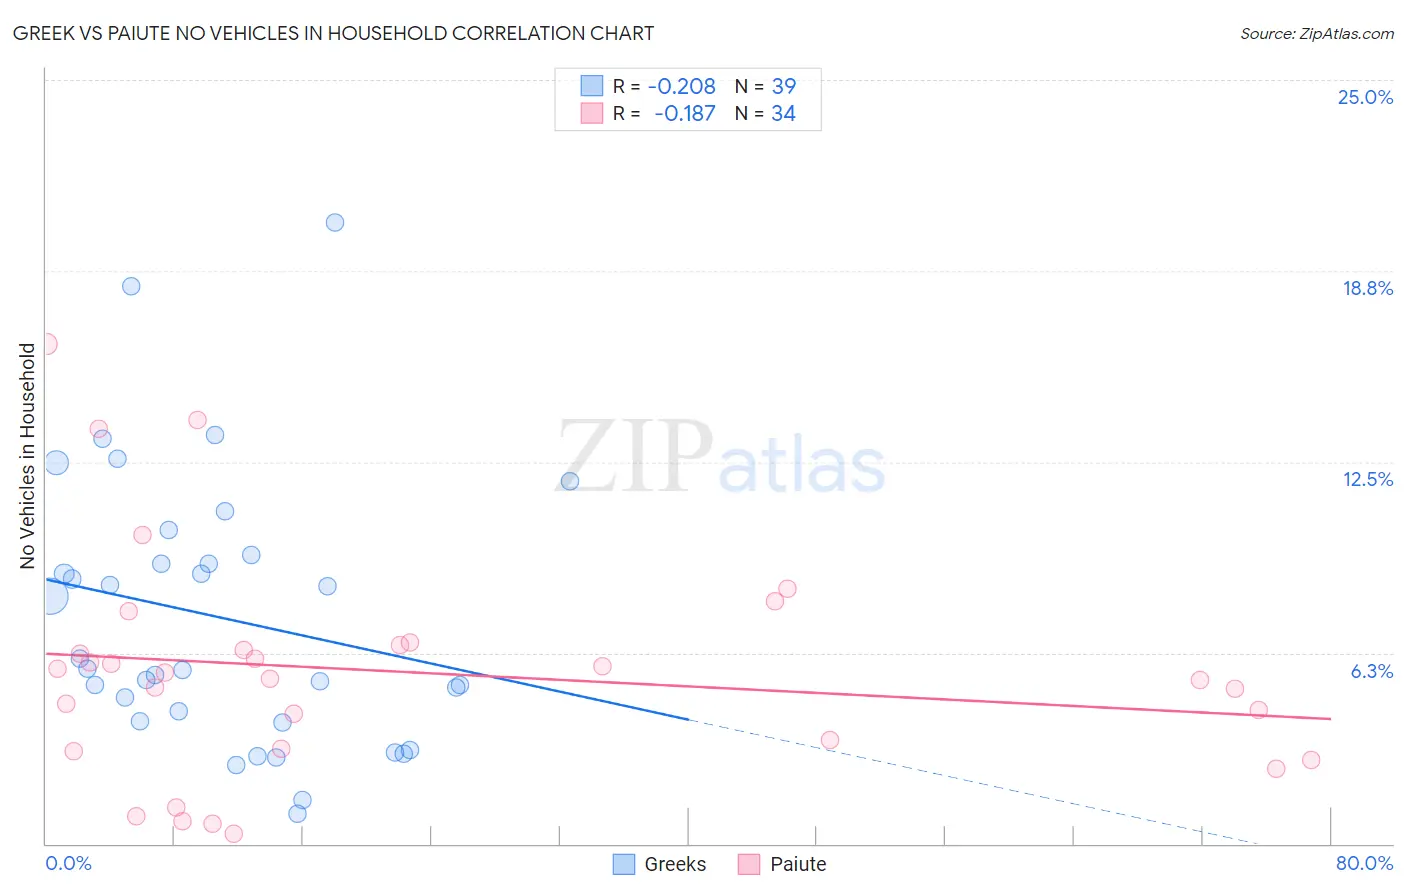
Greek vs Paiute No Vehicles in Household Correlation Chart
The statistical analysis conducted on geographies consisting of 480,584,341 people shows a weak negative correlation between the proportion of Greeks and percentage of households with no vehicle available in the United States with a correlation coefficient (R) of -0.208 and weighted average of 9.5%. Similarly, the statistical analysis conducted on geographies consisting of 58,352,157 people shows a poor negative correlation between the proportion of Paiute and percentage of households with no vehicle available in the United States with a correlation coefficient (R) of -0.187 and weighted average of 11.8%, a difference of 24.4%.
No Vehicles in Household Correlation Summary
| Measurement | Greek | Paiute |
| Minimum | 1.00% | 0.32% |
| Maximum | 20.3% | 16.4% |
| Range | 19.3% | 16.0% |
| Mean | 7.4% | 5.6% |
| Median | 5.7% | 5.5% |
| Interquartile 25% (IQ1) | 4.0% | 3.1% |
| Interquartile 75% (IQ3) | 9.5% | 6.5% |
| Interquartile Range (IQR) | 5.5% | 3.4% |
| Standard Deviation (Sample) | 4.4% | 3.7% |
| Standard Deviation (Population) | 4.4% | 3.6% |
Similar Demographics by No Vehicles in Household
Demographics Similar to Greeks by No Vehicles in Household
In terms of no vehicles in household, the demographic groups most similar to Greeks are Fijian (9.5%, a difference of 0.11%), Immigrants from Thailand (9.5%, a difference of 0.17%), Puget Sound Salish (9.5%, a difference of 0.27%), Costa Rican (9.5%, a difference of 0.32%), and Chippewa (9.4%, a difference of 0.55%).
| Demographics | Rating | Rank | No Vehicles in Household |
| Immigrants | Kuwait | 95.1 /100 | #111 | Exceptional 9.4% |
| Armenians | 95.0 /100 | #112 | Exceptional 9.4% |
| Immigrants | Netherlands | 94.8 /100 | #113 | Exceptional 9.4% |
| Serbians | 94.3 /100 | #114 | Exceptional 9.4% |
| Navajo | 94.2 /100 | #115 | Exceptional 9.4% |
| Japanese | 94.1 /100 | #116 | Exceptional 9.4% |
| Chippewa | 93.8 /100 | #117 | Exceptional 9.4% |
| Greeks | 92.9 /100 | #118 | Exceptional 9.5% |
| Fijians | 92.7 /100 | #119 | Exceptional 9.5% |
| Immigrants | Thailand | 92.6 /100 | #120 | Exceptional 9.5% |
| Puget Sound Salish | 92.4 /100 | #121 | Exceptional 9.5% |
| Costa Ricans | 92.3 /100 | #122 | Exceptional 9.5% |
| Blackfeet | 91.4 /100 | #123 | Exceptional 9.6% |
| Immigrants | Korea | 90.9 /100 | #124 | Exceptional 9.6% |
| Immigrants | Cameroon | 90.6 /100 | #125 | Exceptional 9.6% |
Demographics Similar to Paiute by No Vehicles in Household
In terms of no vehicles in household, the demographic groups most similar to Paiute are Immigrants from Nigeria (11.8%, a difference of 0.22%), Immigrants from Czechoslovakia (11.8%, a difference of 0.26%), Immigrants from Belgium (11.8%, a difference of 0.26%), Menominee (11.8%, a difference of 0.32%), and Black/African American (11.9%, a difference of 0.35%).
| Demographics | Rating | Rank | No Vehicles in Household |
| Cheyenne | 2.4 /100 | #243 | Tragic 11.7% |
| Immigrants | Portugal | 2.2 /100 | #244 | Tragic 11.7% |
| Immigrants | Honduras | 2.1 /100 | #245 | Tragic 11.8% |
| Menominee | 2.0 /100 | #246 | Tragic 11.8% |
| Immigrants | Czechoslovakia | 2.0 /100 | #247 | Tragic 11.8% |
| Immigrants | Belgium | 1.9 /100 | #248 | Tragic 11.8% |
| Immigrants | Nigeria | 1.9 /100 | #249 | Tragic 11.8% |
| Paiute | 1.8 /100 | #250 | Tragic 11.8% |
| Blacks/African Americans | 1.6 /100 | #251 | Tragic 11.9% |
| Immigrants | Serbia | 1.5 /100 | #252 | Tragic 11.9% |
| Egyptians | 1.4 /100 | #253 | Tragic 11.9% |
| Immigrants | Uruguay | 1.3 /100 | #254 | Tragic 11.9% |
| Hondurans | 1.2 /100 | #255 | Tragic 12.0% |
| Liberians | 1.2 /100 | #256 | Tragic 12.0% |
| Nigerians | 0.9 /100 | #257 | Tragic 12.1% |