French vs Immigrants from Uganda 1 or more Vehicles in Household
COMPARE
French
Immigrants from Uganda
1 or more Vehicles in Household
1 or more Vehicles in Household Comparison
French
Immigrants from Uganda
92.7%
1 OR MORE VEHICLES IN HOUSEHOLD
100.0/ 100
METRIC RATING
22nd/ 347
METRIC RANK
90.1%
1 OR MORE VEHICLES IN HOUSEHOLD
73.8/ 100
METRIC RATING
154th/ 347
METRIC RANK
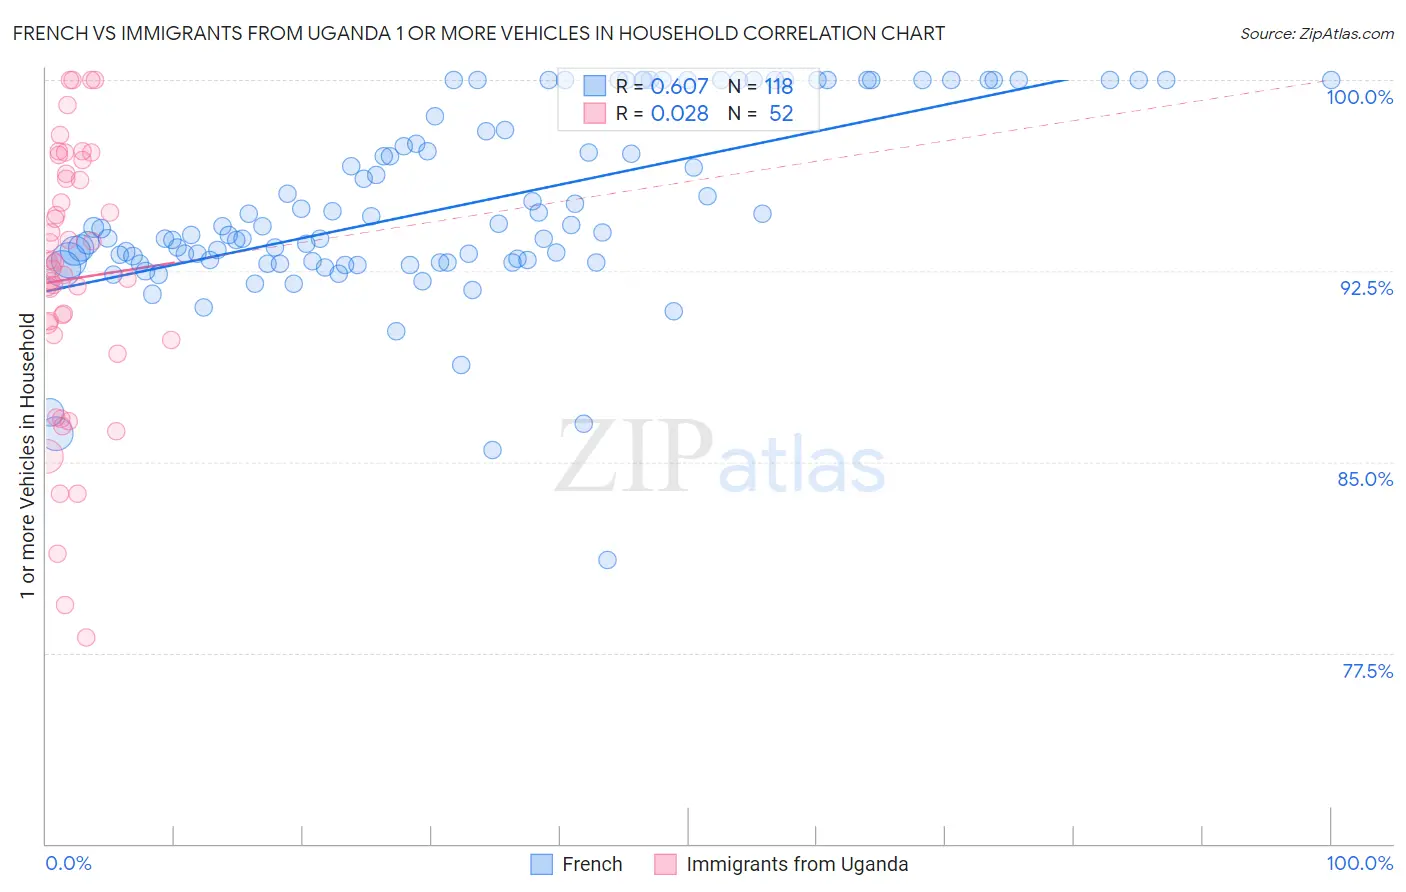
French vs Immigrants from Uganda 1 or more Vehicles in Household Correlation Chart
The statistical analysis conducted on geographies consisting of 571,913,868 people shows a significant positive correlation between the proportion of French and percentage of households with 1 or more vehicles available in the United States with a correlation coefficient (R) of 0.607 and weighted average of 92.7%. Similarly, the statistical analysis conducted on geographies consisting of 125,961,827 people shows no correlation between the proportion of Immigrants from Uganda and percentage of households with 1 or more vehicles available in the United States with a correlation coefficient (R) of 0.028 and weighted average of 90.1%, a difference of 2.9%.
1 or more Vehicles in Household Correlation Summary
| Measurement | French | Immigrants from Uganda |
| Minimum | 81.2% | 78.1% |
| Maximum | 100.0% | 100.0% |
| Range | 18.8% | 21.9% |
| Mean | 95.0% | 92.2% |
| Median | 94.1% | 92.7% |
| Interquartile 25% (IQ1) | 92.8% | 89.9% |
| Interquartile 75% (IQ3) | 98.6% | 96.2% |
| Interquartile Range (IQR) | 5.7% | 6.3% |
| Standard Deviation (Sample) | 3.7% | 5.3% |
| Standard Deviation (Population) | 3.7% | 5.2% |
Similar Demographics by 1 or more Vehicles in Household
Demographics Similar to French by 1 or more Vehicles in Household
In terms of 1 or more vehicles in household, the demographic groups most similar to French are Ottawa (92.7%, a difference of 0.010%), Arapaho (92.7%, a difference of 0.030%), Nepalese (92.6%, a difference of 0.070%), Yaqui (92.6%, a difference of 0.14%), and Immigrants from Iraq (92.5%, a difference of 0.16%).
| Demographics | Rating | Rank | 1 or more Vehicles in Household |
| Mexicans | 100.0 /100 | #15 | Exceptional 93.0% |
| Assyrians/Chaldeans/Syriacs | 100.0 /100 | #16 | Exceptional 93.0% |
| Europeans | 100.0 /100 | #17 | Exceptional 93.0% |
| Welsh | 100.0 /100 | #18 | Exceptional 93.0% |
| Tongans | 100.0 /100 | #19 | Exceptional 92.9% |
| Arapaho | 100.0 /100 | #20 | Exceptional 92.7% |
| Ottawa | 100.0 /100 | #21 | Exceptional 92.7% |
| French | 100.0 /100 | #22 | Exceptional 92.7% |
| Nepalese | 100.0 /100 | #23 | Exceptional 92.6% |
| Yaqui | 100.0 /100 | #24 | Exceptional 92.6% |
| Immigrants | Iraq | 100.0 /100 | #25 | Exceptional 92.5% |
| British | 100.0 /100 | #26 | Exceptional 92.5% |
| Americans | 100.0 /100 | #27 | Exceptional 92.5% |
| Sri Lankans | 100.0 /100 | #28 | Exceptional 92.5% |
| Native Hawaiians | 100.0 /100 | #29 | Exceptional 92.4% |
Demographics Similar to Immigrants from Uganda by 1 or more Vehicles in Household
In terms of 1 or more vehicles in household, the demographic groups most similar to Immigrants from Uganda are New Zealander (90.1%, a difference of 0.0%), Immigrants (90.1%, a difference of 0.0%), Tlingit-Haida (90.1%, a difference of 0.010%), Immigrants from Bosnia and Herzegovina (90.1%, a difference of 0.030%), and Australian (90.0%, a difference of 0.030%).
| Demographics | Rating | Rank | 1 or more Vehicles in Household |
| Chileans | 79.8 /100 | #147 | Good 90.2% |
| Immigrants | Eastern Africa | 78.2 /100 | #148 | Good 90.1% |
| Immigrants | Nicaragua | 76.7 /100 | #149 | Good 90.1% |
| Immigrants | Micronesia | 75.9 /100 | #150 | Good 90.1% |
| Immigrants | Bosnia and Herzegovina | 75.4 /100 | #151 | Good 90.1% |
| Tlingit-Haida | 74.3 /100 | #152 | Good 90.1% |
| New Zealanders | 73.8 /100 | #153 | Good 90.1% |
| Immigrants | Uganda | 73.8 /100 | #154 | Good 90.1% |
| Immigrants | Immigrants | 73.6 /100 | #155 | Good 90.1% |
| Australians | 72.4 /100 | #156 | Good 90.0% |
| Immigrants | Congo | 71.2 /100 | #157 | Good 90.0% |
| Brazilians | 71.0 /100 | #158 | Good 90.0% |
| South Africans | 69.7 /100 | #159 | Good 90.0% |
| Immigrants | Indonesia | 68.8 /100 | #160 | Good 90.0% |
| Salvadorans | 68.7 /100 | #161 | Good 90.0% |