Finnish vs Icelander No Vehicles in Household
COMPARE
Finnish
Icelander
No Vehicles in Household
No Vehicles in Household Comparison
Finns
Icelanders
7.7%
NO VEHICLES IN HOUSEHOLD
100.0/ 100
METRIC RATING
30th/ 347
METRIC RANK
9.6%
NO VEHICLES IN HOUSEHOLD
90.2/ 100
METRIC RATING
126th/ 347
METRIC RANK
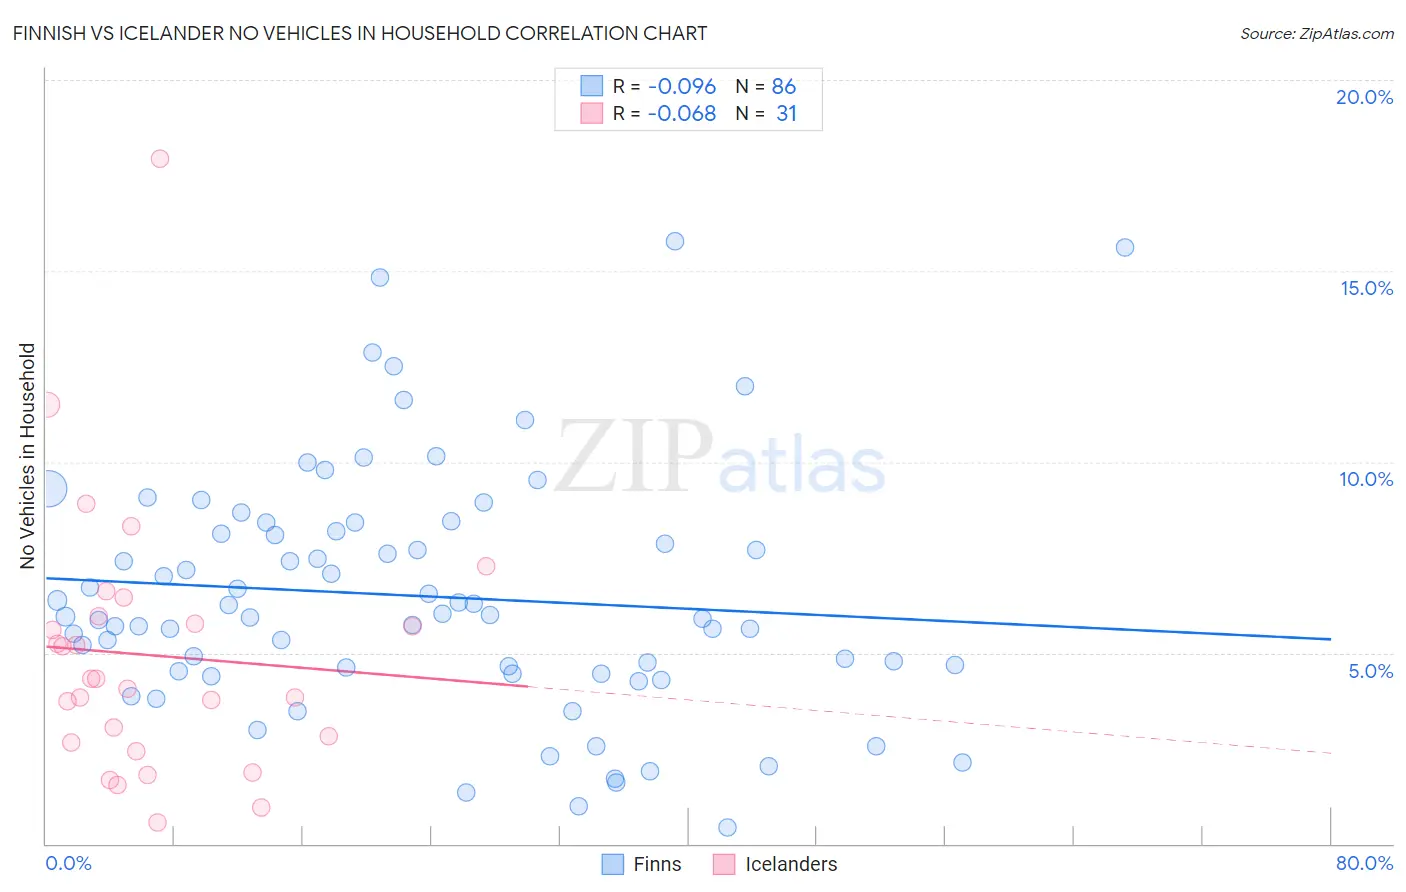
Finnish vs Icelander No Vehicles in Household Correlation Chart
The statistical analysis conducted on geographies consisting of 403,316,367 people shows a slight negative correlation between the proportion of Finns and percentage of households with no vehicle available in the United States with a correlation coefficient (R) of -0.096 and weighted average of 7.7%. Similarly, the statistical analysis conducted on geographies consisting of 159,468,771 people shows a slight negative correlation between the proportion of Icelanders and percentage of households with no vehicle available in the United States with a correlation coefficient (R) of -0.068 and weighted average of 9.6%, a difference of 25.4%.
No Vehicles in Household Correlation Summary
| Measurement | Finnish | Icelander |
| Minimum | 0.44% | 0.55% |
| Maximum | 15.8% | 17.9% |
| Range | 15.3% | 17.4% |
| Mean | 6.5% | 4.9% |
| Median | 6.0% | 4.3% |
| Interquartile 25% (IQ1) | 4.5% | 2.7% |
| Interquartile 75% (IQ3) | 8.2% | 6.0% |
| Interquartile Range (IQR) | 3.7% | 3.3% |
| Standard Deviation (Sample) | 3.2% | 3.4% |
| Standard Deviation (Population) | 3.2% | 3.4% |
Similar Demographics by No Vehicles in Household
Demographics Similar to Finns by No Vehicles in Household
In terms of no vehicles in household, the demographic groups most similar to Finns are Native Hawaiian (7.7%, a difference of 0.15%), American (7.7%, a difference of 0.30%), Malaysian (7.7%, a difference of 0.40%), Immigrants from Taiwan (7.7%, a difference of 0.51%), and Samoan (7.6%, a difference of 0.59%).
| Demographics | Rating | Rank | No Vehicles in Household |
| French | 100.0 /100 | #23 | Exceptional 7.4% |
| Immigrants | Iraq | 100.0 /100 | #24 | Exceptional 7.5% |
| Yaqui | 100.0 /100 | #25 | Exceptional 7.5% |
| Sri Lankans | 100.0 /100 | #26 | Exceptional 7.6% |
| British | 100.0 /100 | #27 | Exceptional 7.6% |
| Samoans | 100.0 /100 | #28 | Exceptional 7.6% |
| Americans | 100.0 /100 | #29 | Exceptional 7.7% |
| Finns | 100.0 /100 | #30 | Exceptional 7.7% |
| Native Hawaiians | 100.0 /100 | #31 | Exceptional 7.7% |
| Malaysians | 100.0 /100 | #32 | Exceptional 7.7% |
| Immigrants | Taiwan | 100.0 /100 | #33 | Exceptional 7.7% |
| Immigrants | Vietnam | 100.0 /100 | #34 | Exceptional 7.7% |
| Cherokee | 99.9 /100 | #35 | Exceptional 7.7% |
| Iraqis | 99.9 /100 | #36 | Exceptional 7.7% |
| Basques | 99.9 /100 | #37 | Exceptional 7.8% |
Demographics Similar to Icelanders by No Vehicles in Household
In terms of no vehicles in household, the demographic groups most similar to Icelanders are Immigrants from Cameroon (9.6%, a difference of 0.17%), Immigrants from Kenya (9.6%, a difference of 0.18%), Immigrants from Syria (9.6%, a difference of 0.27%), Nicaraguan (9.7%, a difference of 0.29%), and Immigrants from Korea (9.6%, a difference of 0.30%).
| Demographics | Rating | Rank | No Vehicles in Household |
| Fijians | 92.7 /100 | #119 | Exceptional 9.5% |
| Immigrants | Thailand | 92.6 /100 | #120 | Exceptional 9.5% |
| Puget Sound Salish | 92.4 /100 | #121 | Exceptional 9.5% |
| Costa Ricans | 92.3 /100 | #122 | Exceptional 9.5% |
| Blackfeet | 91.4 /100 | #123 | Exceptional 9.6% |
| Immigrants | Korea | 90.9 /100 | #124 | Exceptional 9.6% |
| Immigrants | Cameroon | 90.6 /100 | #125 | Exceptional 9.6% |
| Icelanders | 90.2 /100 | #126 | Exceptional 9.6% |
| Immigrants | Kenya | 89.7 /100 | #127 | Excellent 9.6% |
| Immigrants | Syria | 89.5 /100 | #128 | Excellent 9.6% |
| Nicaraguans | 89.5 /100 | #129 | Excellent 9.7% |
| Burmese | 88.8 /100 | #130 | Excellent 9.7% |
| Immigrants | Azores | 88.2 /100 | #131 | Excellent 9.7% |
| Kenyans | 88.0 /100 | #132 | Excellent 9.7% |
| Immigrants | Oceania | 87.1 /100 | #133 | Excellent 9.7% |