Delaware vs Icelander No Vehicles in Household
COMPARE
Delaware
Icelander
No Vehicles in Household
No Vehicles in Household Comparison
Delaware
Icelanders
9.2%
NO VEHICLES IN HOUSEHOLD
97.2/ 100
METRIC RATING
110th/ 347
METRIC RANK
9.6%
NO VEHICLES IN HOUSEHOLD
90.2/ 100
METRIC RATING
126th/ 347
METRIC RANK
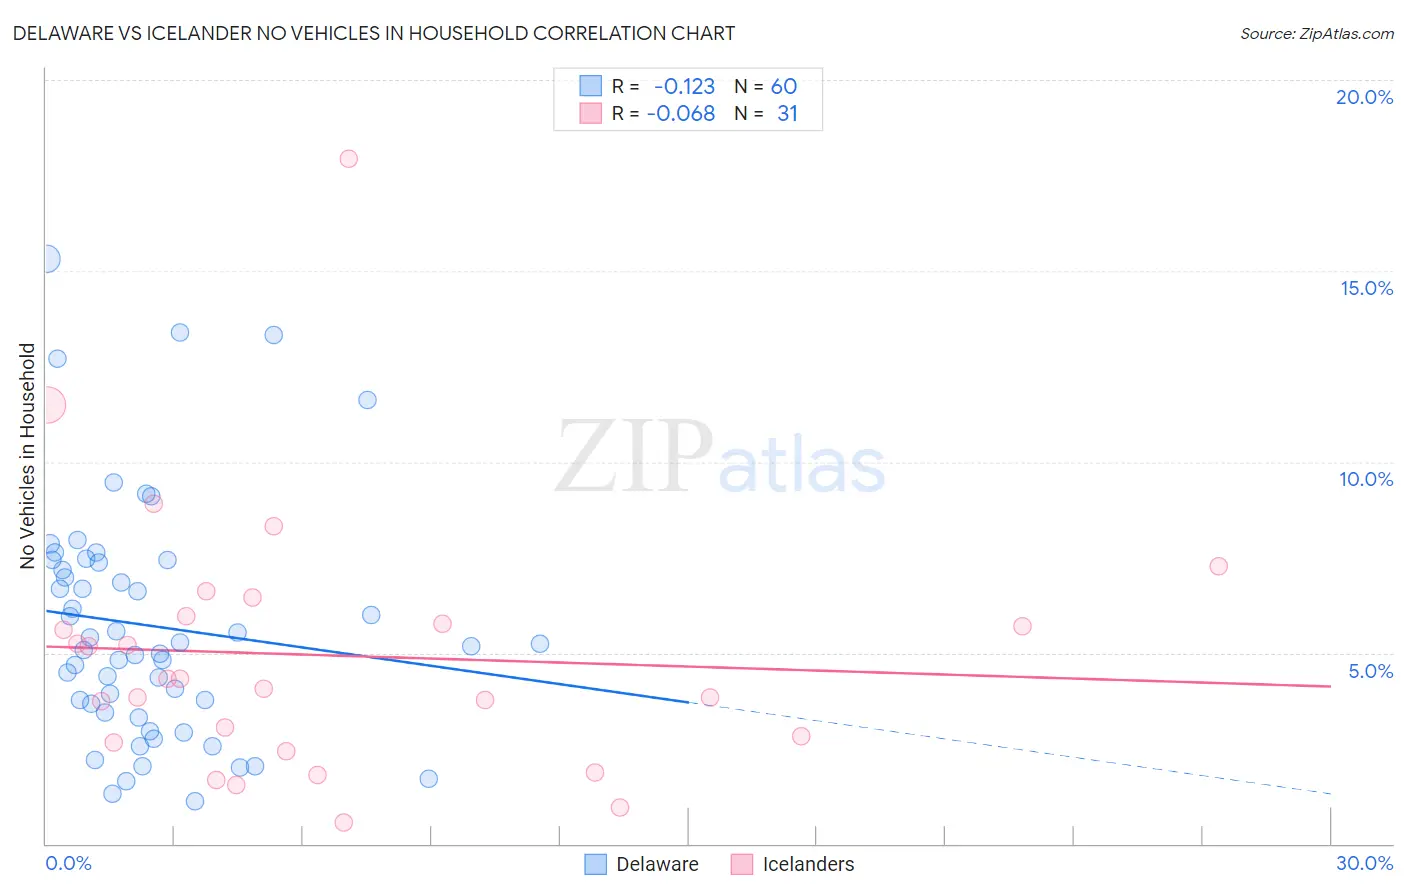
Delaware vs Icelander No Vehicles in Household Correlation Chart
The statistical analysis conducted on geographies consisting of 96,153,948 people shows a poor negative correlation between the proportion of Delaware and percentage of households with no vehicle available in the United States with a correlation coefficient (R) of -0.123 and weighted average of 9.2%. Similarly, the statistical analysis conducted on geographies consisting of 159,468,771 people shows a slight negative correlation between the proportion of Icelanders and percentage of households with no vehicle available in the United States with a correlation coefficient (R) of -0.068 and weighted average of 9.6%, a difference of 5.1%.
No Vehicles in Household Correlation Summary
| Measurement | Delaware | Icelander |
| Minimum | 1.1% | 0.55% |
| Maximum | 15.3% | 17.9% |
| Range | 14.2% | 17.4% |
| Mean | 5.7% | 4.9% |
| Median | 5.2% | 4.3% |
| Interquartile 25% (IQ1) | 3.5% | 2.7% |
| Interquartile 75% (IQ3) | 7.4% | 6.0% |
| Interquartile Range (IQR) | 3.8% | 3.3% |
| Standard Deviation (Sample) | 3.1% | 3.4% |
| Standard Deviation (Population) | 3.1% | 3.4% |
Demographics Similar to Delaware and Icelanders by No Vehicles in Household
In terms of no vehicles in household, the demographic groups most similar to Delaware are Maltese (9.1%, a difference of 0.58%), Mexican American Indian (9.1%, a difference of 0.71%), Immigrants from Kuwait (9.4%, a difference of 2.2%), Armenian (9.4%, a difference of 2.3%), and Immigrants from Netherlands (9.4%, a difference of 2.4%). Similarly, the demographic groups most similar to Icelanders are Immigrants from Cameroon (9.6%, a difference of 0.17%), Immigrants from Kenya (9.6%, a difference of 0.18%), Immigrants from Syria (9.6%, a difference of 0.27%), Immigrants from Korea (9.6%, a difference of 0.30%), and Blackfeet (9.6%, a difference of 0.52%).
| Demographics | Rating | Rank | No Vehicles in Household |
| Mexican American Indians | 97.6 /100 | #108 | Exceptional 9.1% |
| Maltese | 97.6 /100 | #109 | Exceptional 9.1% |
| Delaware | 97.2 /100 | #110 | Exceptional 9.2% |
| Immigrants | Kuwait | 95.1 /100 | #111 | Exceptional 9.4% |
| Armenians | 95.0 /100 | #112 | Exceptional 9.4% |
| Immigrants | Netherlands | 94.8 /100 | #113 | Exceptional 9.4% |
| Serbians | 94.3 /100 | #114 | Exceptional 9.4% |
| Navajo | 94.2 /100 | #115 | Exceptional 9.4% |
| Japanese | 94.1 /100 | #116 | Exceptional 9.4% |
| Chippewa | 93.8 /100 | #117 | Exceptional 9.4% |
| Greeks | 92.9 /100 | #118 | Exceptional 9.5% |
| Fijians | 92.7 /100 | #119 | Exceptional 9.5% |
| Immigrants | Thailand | 92.6 /100 | #120 | Exceptional 9.5% |
| Puget Sound Salish | 92.4 /100 | #121 | Exceptional 9.5% |
| Costa Ricans | 92.3 /100 | #122 | Exceptional 9.5% |
| Blackfeet | 91.4 /100 | #123 | Exceptional 9.6% |
| Immigrants | Korea | 90.9 /100 | #124 | Exceptional 9.6% |
| Immigrants | Cameroon | 90.6 /100 | #125 | Exceptional 9.6% |
| Icelanders | 90.2 /100 | #126 | Exceptional 9.6% |
| Immigrants | Kenya | 89.7 /100 | #127 | Excellent 9.6% |
| Immigrants | Syria | 89.5 /100 | #128 | Excellent 9.6% |