Crow vs Korean 1 or more Vehicles in Household
COMPARE
Crow
Korean
1 or more Vehicles in Household
1 or more Vehicles in Household Comparison
Crow
Koreans
89.3%
1 OR MORE VEHICLES IN HOUSEHOLD
24.3/ 100
METRIC RATING
196th/ 347
METRIC RANK
92.1%
1 OR MORE VEHICLES IN HOUSEHOLD
99.9/ 100
METRIC RATING
52nd/ 347
METRIC RANK
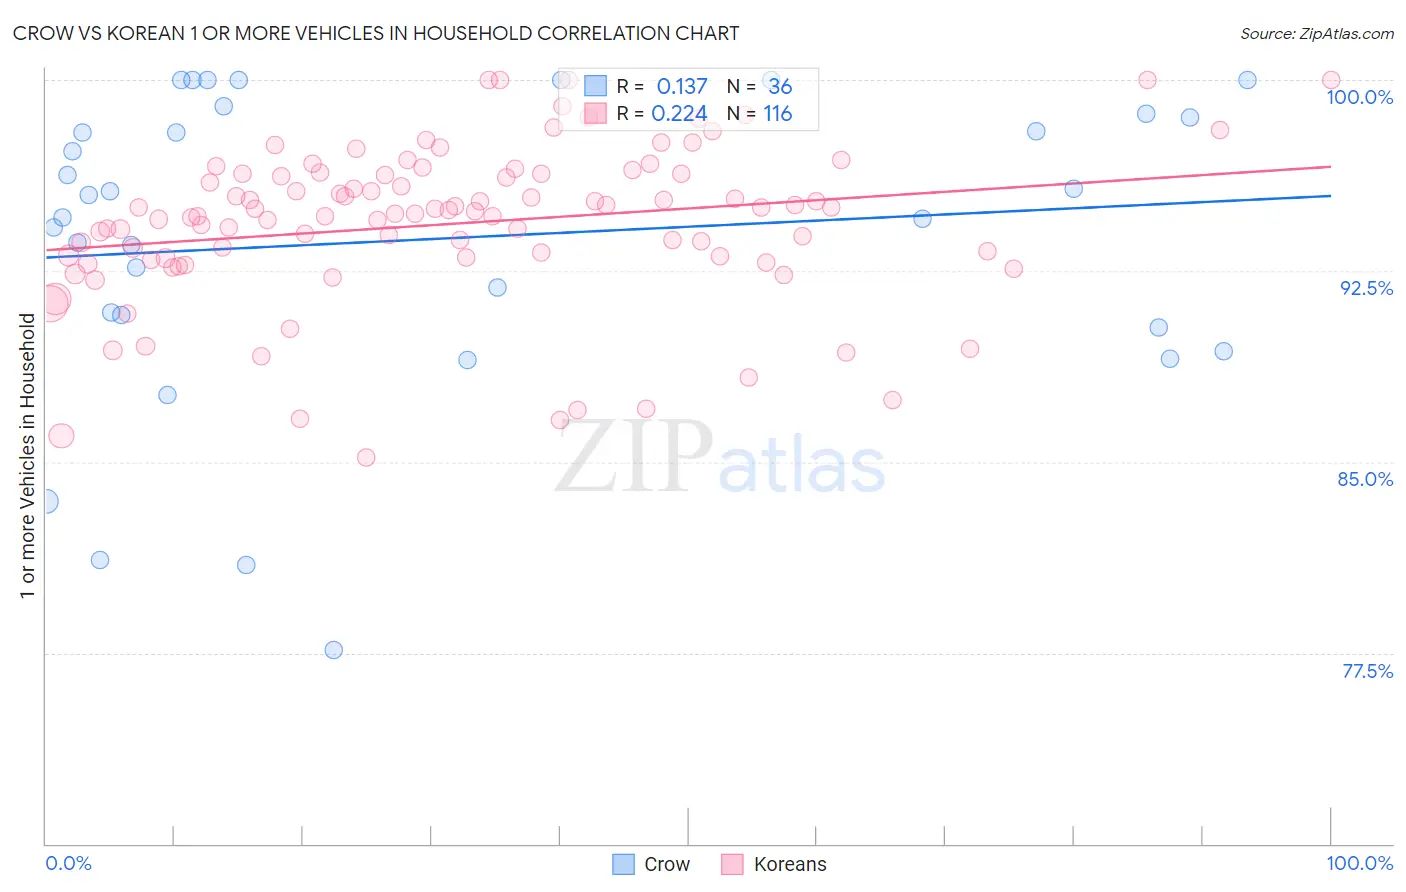
Crow vs Korean 1 or more Vehicles in Household Correlation Chart
The statistical analysis conducted on geographies consisting of 59,203,156 people shows a poor positive correlation between the proportion of Crow and percentage of households with 1 or more vehicles available in the United States with a correlation coefficient (R) of 0.137 and weighted average of 89.3%. Similarly, the statistical analysis conducted on geographies consisting of 510,490,681 people shows a weak positive correlation between the proportion of Koreans and percentage of households with 1 or more vehicles available in the United States with a correlation coefficient (R) of 0.224 and weighted average of 92.1%, a difference of 3.1%.
1 or more Vehicles in Household Correlation Summary
| Measurement | Crow | Korean |
| Minimum | 77.6% | 85.2% |
| Maximum | 100.0% | 100.0% |
| Range | 22.4% | 14.8% |
| Mean | 93.8% | 94.3% |
| Median | 95.0% | 94.8% |
| Interquartile 25% (IQ1) | 90.5% | 93.0% |
| Interquartile 75% (IQ3) | 98.6% | 96.3% |
| Interquartile Range (IQR) | 8.1% | 3.3% |
| Standard Deviation (Sample) | 6.0% | 3.1% |
| Standard Deviation (Population) | 5.9% | 3.1% |
Similar Demographics by 1 or more Vehicles in Household
Demographics Similar to Crow by 1 or more Vehicles in Household
In terms of 1 or more vehicles in household, the demographic groups most similar to Crow are Immigrants from Sweden (89.3%, a difference of 0.010%), Pennsylvania German (89.3%, a difference of 0.030%), Immigrants from Asia (89.3%, a difference of 0.030%), Central American (89.2%, a difference of 0.060%), and Immigrants from Western Europe (89.2%, a difference of 0.090%).
| Demographics | Rating | Rank | 1 or more Vehicles in Household |
| Carpatho Rusyns | 37.8 /100 | #189 | Fair 89.5% |
| Shoshone | 37.5 /100 | #190 | Fair 89.5% |
| Immigrants | Poland | 37.1 /100 | #191 | Fair 89.5% |
| Immigrants | North Macedonia | 36.5 /100 | #192 | Fair 89.5% |
| Immigrants | Northern Europe | 35.5 /100 | #193 | Fair 89.5% |
| Immigrants | Eritrea | 33.2 /100 | #194 | Fair 89.4% |
| Immigrants | Armenia | 31.8 /100 | #195 | Fair 89.4% |
| Crow | 24.3 /100 | #196 | Fair 89.3% |
| Immigrants | Sweden | 23.6 /100 | #197 | Fair 89.3% |
| Pennsylvania Germans | 22.9 /100 | #198 | Fair 89.3% |
| Immigrants | Asia | 22.8 /100 | #199 | Fair 89.3% |
| Central Americans | 21.4 /100 | #200 | Fair 89.2% |
| Immigrants | Western Europe | 20.5 /100 | #201 | Fair 89.2% |
| Iroquois | 19.8 /100 | #202 | Poor 89.2% |
| Cambodians | 18.9 /100 | #203 | Poor 89.2% |
Demographics Similar to Koreans by 1 or more Vehicles in Household
In terms of 1 or more vehicles in household, the demographic groups most similar to Koreans are Celtic (92.1%, a difference of 0.030%), Hawaiian (92.0%, a difference of 0.030%), Guamanian/Chamorro (92.1%, a difference of 0.040%), Slovene (92.0%, a difference of 0.040%), and Afghan (92.1%, a difference of 0.050%).
| Demographics | Rating | Rank | 1 or more Vehicles in Household |
| Immigrants | Nonimmigrants | 99.9 /100 | #45 | Exceptional 92.2% |
| Immigrants | Fiji | 99.9 /100 | #46 | Exceptional 92.2% |
| Northern Europeans | 99.9 /100 | #47 | Exceptional 92.2% |
| Belgians | 99.9 /100 | #48 | Exceptional 92.1% |
| Afghans | 99.9 /100 | #49 | Exceptional 92.1% |
| Guamanians/Chamorros | 99.9 /100 | #50 | Exceptional 92.1% |
| Celtics | 99.9 /100 | #51 | Exceptional 92.1% |
| Koreans | 99.9 /100 | #52 | Exceptional 92.1% |
| Hawaiians | 99.9 /100 | #53 | Exceptional 92.0% |
| Slovenes | 99.9 /100 | #54 | Exceptional 92.0% |
| Immigrants | Afghanistan | 99.9 /100 | #55 | Exceptional 92.0% |
| Immigrants | Venezuela | 99.9 /100 | #56 | Exceptional 92.0% |
| Iraqis | 99.8 /100 | #57 | Exceptional 91.9% |
| Immigrants | Mexico | 99.8 /100 | #58 | Exceptional 91.9% |
| Venezuelans | 99.8 /100 | #59 | Exceptional 91.9% |