Colville vs Immigrants from Russia College, 1 year or more
COMPARE
Colville
Immigrants from Russia
College, 1 year or more
College, 1 year or more Comparison
Colville
Immigrants from Russia
54.1%
COLLEGE, 1 YEAR OR MORE
0.1/ 100
METRIC RATING
281st/ 347
METRIC RANK
64.7%
COLLEGE, 1 YEAR OR MORE
99.9/ 100
METRIC RATING
43rd/ 347
METRIC RANK
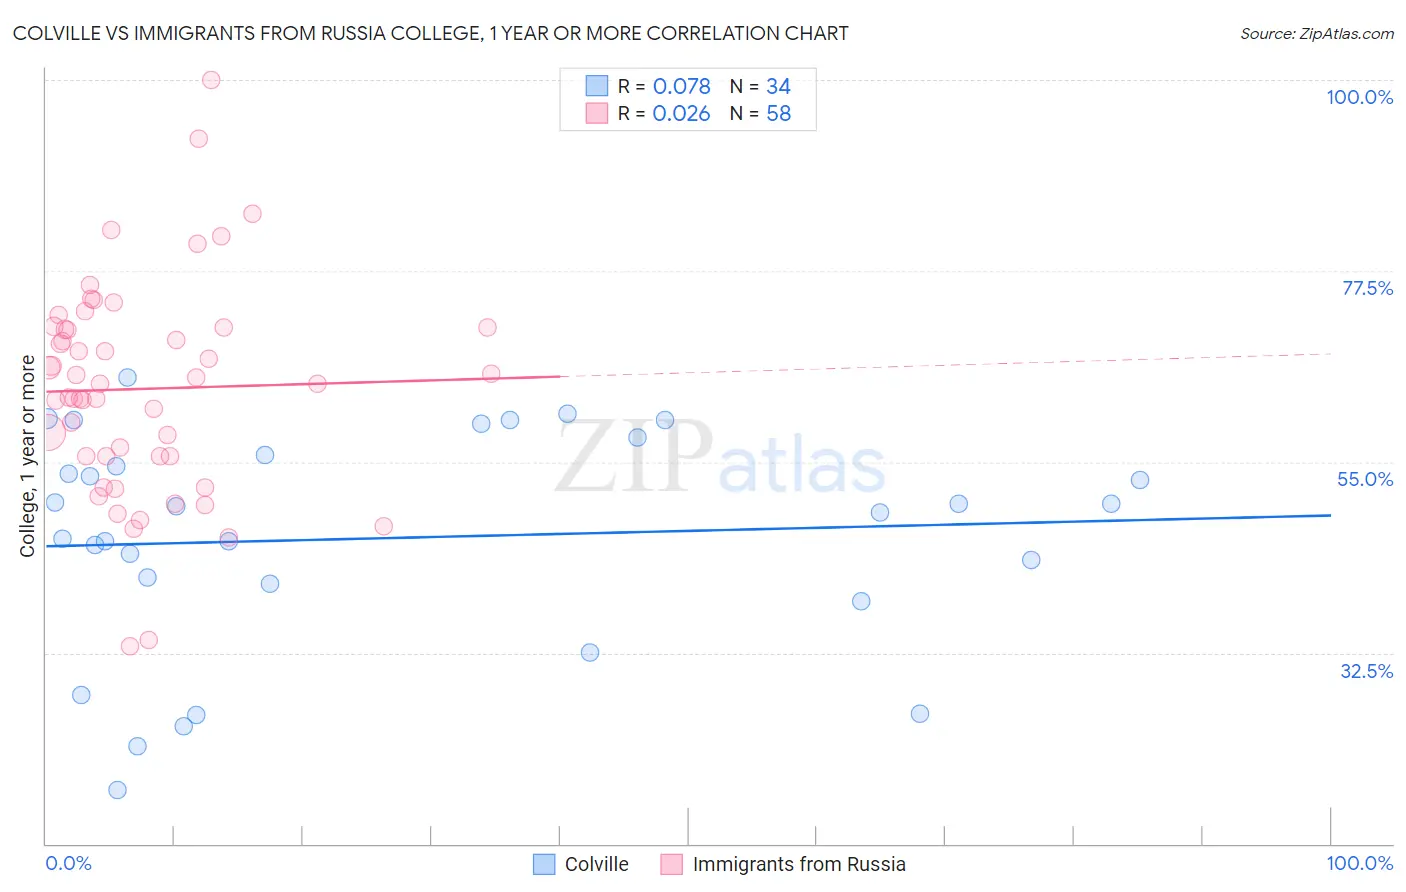
Colville vs Immigrants from Russia College, 1 year or more Correlation Chart
The statistical analysis conducted on geographies consisting of 34,687,707 people shows a slight positive correlation between the proportion of Colville and percentage of population with at least college, 1 year or more education in the United States with a correlation coefficient (R) of 0.078 and weighted average of 54.1%. Similarly, the statistical analysis conducted on geographies consisting of 347,945,922 people shows no correlation between the proportion of Immigrants from Russia and percentage of population with at least college, 1 year or more education in the United States with a correlation coefficient (R) of 0.026 and weighted average of 64.7%, a difference of 19.7%.
College, 1 year or more Correlation Summary
| Measurement | Colville | Immigrants from Russia |
| Minimum | 16.3% | 33.2% |
| Maximum | 64.9% | 100.0% |
| Range | 48.6% | 66.8% |
| Mean | 46.0% | 63.6% |
| Median | 49.4% | 64.2% |
| Interquartile 25% (IQ1) | 40.7% | 55.7% |
| Interquartile 75% (IQ3) | 55.8% | 70.8% |
| Interquartile Range (IQR) | 15.1% | 15.1% |
| Standard Deviation (Sample) | 13.0% | 12.6% |
| Standard Deviation (Population) | 12.8% | 12.5% |
Similar Demographics by College, 1 year or more
Demographics Similar to Colville by College, 1 year or more
In terms of college, 1 year or more, the demographic groups most similar to Colville are Cheyenne (54.1%, a difference of 0.010%), Guyanese (54.1%, a difference of 0.040%), Arapaho (54.1%, a difference of 0.070%), Immigrants from Jamaica (54.2%, a difference of 0.090%), and Nicaraguan (53.9%, a difference of 0.40%).
| Demographics | Rating | Rank | College, 1 year or more |
| Belizeans | 0.2 /100 | #274 | Tragic 54.4% |
| Americans | 0.2 /100 | #275 | Tragic 54.4% |
| Shoshone | 0.2 /100 | #276 | Tragic 54.3% |
| Ecuadorians | 0.2 /100 | #277 | Tragic 54.3% |
| Immigrants | Jamaica | 0.1 /100 | #278 | Tragic 54.2% |
| Arapaho | 0.1 /100 | #279 | Tragic 54.1% |
| Cheyenne | 0.1 /100 | #280 | Tragic 54.1% |
| Colville | 0.1 /100 | #281 | Tragic 54.1% |
| Guyanese | 0.1 /100 | #282 | Tragic 54.1% |
| Nicaraguans | 0.1 /100 | #283 | Tragic 53.9% |
| Ute | 0.1 /100 | #284 | Tragic 53.8% |
| Immigrants | Guyana | 0.1 /100 | #285 | Tragic 53.5% |
| Central American Indians | 0.1 /100 | #286 | Tragic 53.5% |
| Immigrants | Belize | 0.1 /100 | #287 | Tragic 53.5% |
| Alaska Natives | 0.0 /100 | #288 | Tragic 53.4% |
Demographics Similar to Immigrants from Russia by College, 1 year or more
In terms of college, 1 year or more, the demographic groups most similar to Immigrants from Russia are Immigrants from Norway (64.7%, a difference of 0.020%), Immigrants from Latvia (64.8%, a difference of 0.12%), Mongolian (64.8%, a difference of 0.13%), Immigrants from Lithuania (64.6%, a difference of 0.19%), and Bhutanese (64.6%, a difference of 0.20%).
| Demographics | Rating | Rank | College, 1 year or more |
| Immigrants | South Africa | 99.9 /100 | #36 | Exceptional 65.1% |
| Russians | 99.9 /100 | #37 | Exceptional 65.1% |
| Immigrants | Saudi Arabia | 99.9 /100 | #38 | Exceptional 65.0% |
| Estonians | 99.9 /100 | #39 | Exceptional 65.0% |
| Immigrants | Kuwait | 99.9 /100 | #40 | Exceptional 65.0% |
| Mongolians | 99.9 /100 | #41 | Exceptional 64.8% |
| Immigrants | Latvia | 99.9 /100 | #42 | Exceptional 64.8% |
| Immigrants | Russia | 99.9 /100 | #43 | Exceptional 64.7% |
| Immigrants | Norway | 99.9 /100 | #44 | Exceptional 64.7% |
| Immigrants | Lithuania | 99.9 /100 | #45 | Exceptional 64.6% |
| Bhutanese | 99.9 /100 | #46 | Exceptional 64.6% |
| Australians | 99.9 /100 | #47 | Exceptional 64.6% |
| Immigrants | Bulgaria | 99.9 /100 | #48 | Exceptional 64.6% |
| New Zealanders | 99.9 /100 | #49 | Exceptional 64.6% |
| Immigrants | Austria | 99.8 /100 | #50 | Exceptional 64.4% |