Serbian vs Immigrants from Dominican Republic No Vehicles in Household
COMPARE
Serbian
Immigrants from Dominican Republic
No Vehicles in Household
No Vehicles in Household Comparison
Serbians
Immigrants from Dominican Republic
9.4%
NO VEHICLES IN HOUSEHOLD
94.3/ 100
METRIC RATING
114th/ 347
METRIC RANK
31.4%
NO VEHICLES IN HOUSEHOLD
0.0/ 100
METRIC RATING
344th/ 347
METRIC RANK
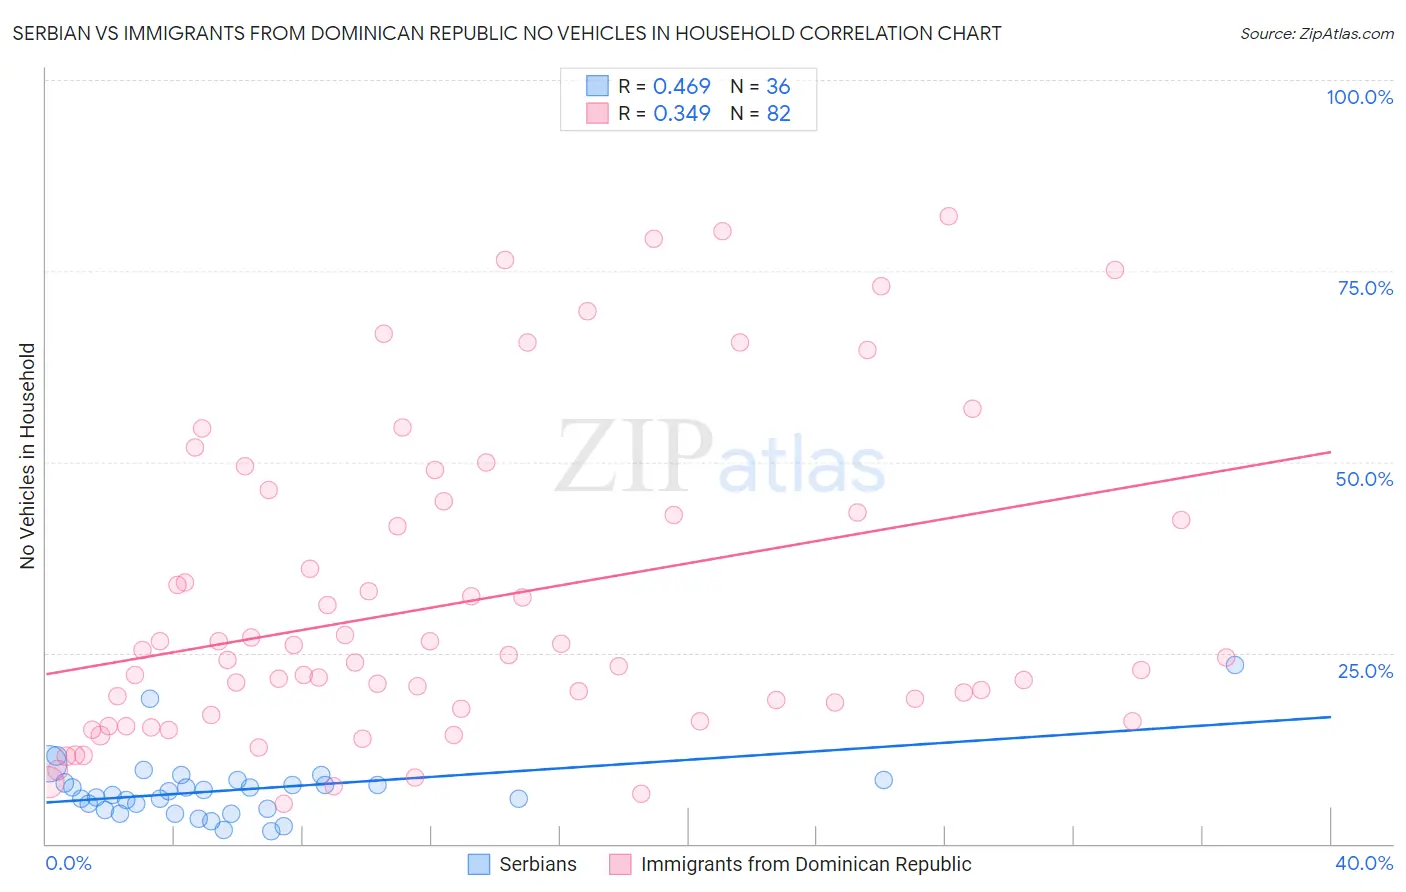
Serbian vs Immigrants from Dominican Republic No Vehicles in Household Correlation Chart
The statistical analysis conducted on geographies consisting of 267,180,680 people shows a moderate positive correlation between the proportion of Serbians and percentage of households with no vehicle available in the United States with a correlation coefficient (R) of 0.469 and weighted average of 9.4%. Similarly, the statistical analysis conducted on geographies consisting of 274,700,556 people shows a mild positive correlation between the proportion of Immigrants from Dominican Republic and percentage of households with no vehicle available in the United States with a correlation coefficient (R) of 0.349 and weighted average of 31.4%, a difference of 233.7%.
No Vehicles in Household Correlation Summary
| Measurement | Serbian | Immigrants from Dominican Republic |
| Minimum | 1.6% | 5.3% |
| Maximum | 23.5% | 82.1% |
| Range | 21.9% | 76.8% |
| Mean | 7.1% | 31.7% |
| Median | 6.6% | 24.2% |
| Interquartile 25% (IQ1) | 4.5% | 16.8% |
| Interquartile 75% (IQ3) | 8.2% | 43.3% |
| Interquartile Range (IQR) | 3.7% | 26.5% |
| Standard Deviation (Sample) | 4.2% | 20.3% |
| Standard Deviation (Population) | 4.2% | 20.2% |
Similar Demographics by No Vehicles in Household
Demographics Similar to Serbians by No Vehicles in Household
In terms of no vehicles in household, the demographic groups most similar to Serbians are Navajo (9.4%, a difference of 0.070%), Japanese (9.4%, a difference of 0.13%), Chippewa (9.4%, a difference of 0.30%), Immigrants from Netherlands (9.4%, a difference of 0.43%), and Armenian (9.4%, a difference of 0.52%).
| Demographics | Rating | Rank | No Vehicles in Household |
| Hispanics or Latinos | 97.7 /100 | #107 | Exceptional 9.1% |
| Mexican American Indians | 97.6 /100 | #108 | Exceptional 9.1% |
| Maltese | 97.6 /100 | #109 | Exceptional 9.1% |
| Delaware | 97.2 /100 | #110 | Exceptional 9.2% |
| Immigrants | Kuwait | 95.1 /100 | #111 | Exceptional 9.4% |
| Armenians | 95.0 /100 | #112 | Exceptional 9.4% |
| Immigrants | Netherlands | 94.8 /100 | #113 | Exceptional 9.4% |
| Serbians | 94.3 /100 | #114 | Exceptional 9.4% |
| Navajo | 94.2 /100 | #115 | Exceptional 9.4% |
| Japanese | 94.1 /100 | #116 | Exceptional 9.4% |
| Chippewa | 93.8 /100 | #117 | Exceptional 9.4% |
| Greeks | 92.9 /100 | #118 | Exceptional 9.5% |
| Fijians | 92.7 /100 | #119 | Exceptional 9.5% |
| Immigrants | Thailand | 92.6 /100 | #120 | Exceptional 9.5% |
| Puget Sound Salish | 92.4 /100 | #121 | Exceptional 9.5% |
Demographics Similar to Immigrants from Dominican Republic by No Vehicles in Household
In terms of no vehicles in household, the demographic groups most similar to Immigrants from Dominican Republic are Inupiat (29.9%, a difference of 5.2%), British West Indian (29.7%, a difference of 5.7%), Immigrants from Guyana (29.5%, a difference of 6.6%), Immigrants from Barbados (29.5%, a difference of 6.6%), and Dominican (29.4%, a difference of 6.9%).
| Demographics | Rating | Rank | No Vehicles in Household |
| Immigrants | Trinidad and Tobago | 0.0 /100 | #333 | Tragic 24.6% |
| Immigrants | Bangladesh | 0.0 /100 | #334 | Tragic 25.8% |
| Barbadians | 0.0 /100 | #335 | Tragic 26.1% |
| Vietnamese | 0.0 /100 | #336 | Tragic 26.2% |
| Immigrants | Uzbekistan | 0.0 /100 | #337 | Tragic 26.7% |
| Guyanese | 0.0 /100 | #338 | Tragic 29.3% |
| Dominicans | 0.0 /100 | #339 | Tragic 29.4% |
| Immigrants | Barbados | 0.0 /100 | #340 | Tragic 29.5% |
| Immigrants | Guyana | 0.0 /100 | #341 | Tragic 29.5% |
| British West Indians | 0.0 /100 | #342 | Tragic 29.7% |
| Inupiat | 0.0 /100 | #343 | Tragic 29.9% |
| Immigrants | Dominican Republic | 0.0 /100 | #344 | Tragic 31.4% |
| Immigrants | St. Vincent and the Grenadines | 0.0 /100 | #345 | Tragic 35.4% |
| Immigrants | Grenada | 0.0 /100 | #346 | Tragic 37.5% |
| Yup'ik | 0.0 /100 | #347 | Tragic 45.9% |