Immigrants from Scotland vs Immigrants from Denmark No Vehicles in Household
COMPARE
Immigrants from Scotland
Immigrants from Denmark
No Vehicles in Household
No Vehicles in Household Comparison
Immigrants from Scotland
Immigrants from Denmark
8.3%
NO VEHICLES IN HOUSEHOLD
99.7/ 100
METRIC RATING
67th/ 347
METRIC RANK
11.1%
NO VEHICLES IN HOUSEHOLD
12.1/ 100
METRIC RATING
214th/ 347
METRIC RANK
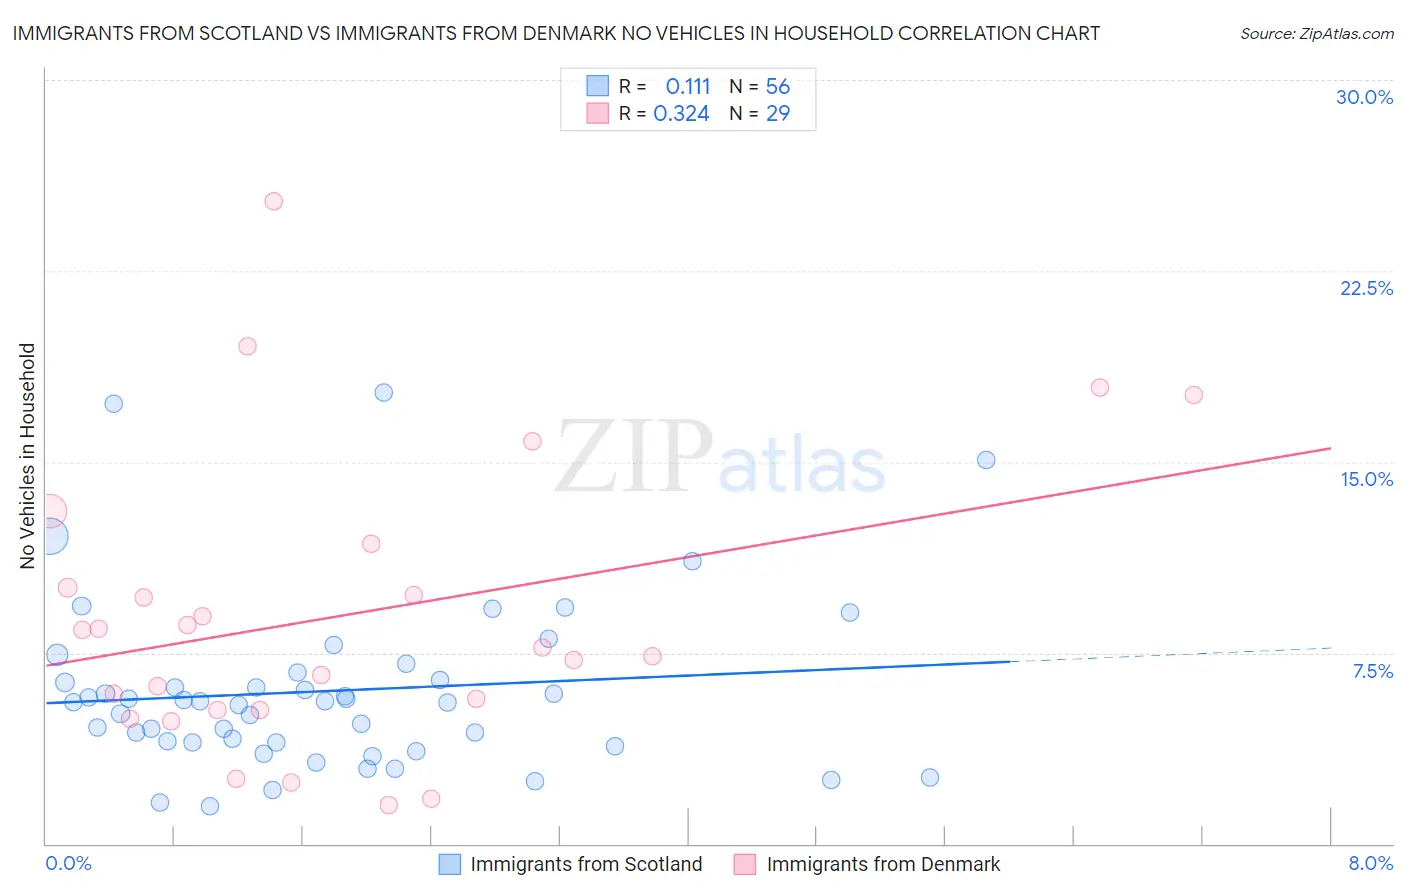
Immigrants from Scotland vs Immigrants from Denmark No Vehicles in Household Correlation Chart
The statistical analysis conducted on geographies consisting of 196,071,616 people shows a poor positive correlation between the proportion of Immigrants from Scotland and percentage of households with no vehicle available in the United States with a correlation coefficient (R) of 0.111 and weighted average of 8.3%. Similarly, the statistical analysis conducted on geographies consisting of 136,239,096 people shows a mild positive correlation between the proportion of Immigrants from Denmark and percentage of households with no vehicle available in the United States with a correlation coefficient (R) of 0.324 and weighted average of 11.1%, a difference of 33.3%.
No Vehicles in Household Correlation Summary
| Measurement | Immigrants from Scotland | Immigrants from Denmark |
| Minimum | 1.4% | 1.5% |
| Maximum | 17.7% | 25.2% |
| Range | 16.3% | 23.7% |
| Mean | 6.0% | 9.0% |
| Median | 5.6% | 7.7% |
| Interquartile 25% (IQ1) | 4.0% | 5.2% |
| Interquartile 75% (IQ3) | 6.6% | 10.9% |
| Interquartile Range (IQR) | 2.6% | 5.7% |
| Standard Deviation (Sample) | 3.4% | 5.7% |
| Standard Deviation (Population) | 3.4% | 5.6% |
Similar Demographics by No Vehicles in Household
Demographics Similar to Immigrants from Scotland by No Vehicles in Household
In terms of no vehicles in household, the demographic groups most similar to Immigrants from Scotland are Palestinian (8.3%, a difference of 0.010%), Canadian (8.3%, a difference of 0.12%), Immigrants from Iran (8.4%, a difference of 0.40%), Spaniard (8.4%, a difference of 0.45%), and Croatian (8.3%, a difference of 0.87%).
| Demographics | Rating | Rank | No Vehicles in Household |
| Immigrants | Laos | 99.8 /100 | #60 | Exceptional 8.2% |
| Thais | 99.8 /100 | #61 | Exceptional 8.2% |
| Chinese | 99.8 /100 | #62 | Exceptional 8.2% |
| Slovaks | 99.8 /100 | #63 | Exceptional 8.3% |
| Croatians | 99.8 /100 | #64 | Exceptional 8.3% |
| Canadians | 99.7 /100 | #65 | Exceptional 8.3% |
| Palestinians | 99.7 /100 | #66 | Exceptional 8.3% |
| Immigrants | Scotland | 99.7 /100 | #67 | Exceptional 8.3% |
| Immigrants | Iran | 99.7 /100 | #68 | Exceptional 8.4% |
| Spaniards | 99.7 /100 | #69 | Exceptional 8.4% |
| Cajuns | 99.6 /100 | #70 | Exceptional 8.4% |
| Immigrants | Lebanon | 99.6 /100 | #71 | Exceptional 8.4% |
| Lithuanians | 99.6 /100 | #72 | Exceptional 8.4% |
| Poles | 99.6 /100 | #73 | Exceptional 8.4% |
| Cubans | 99.5 /100 | #74 | Exceptional 8.5% |
Demographics Similar to Immigrants from Denmark by No Vehicles in Household
In terms of no vehicles in household, the demographic groups most similar to Immigrants from Denmark are Immigrants from Hungary (11.1%, a difference of 0.070%), Immigrants from Sri Lanka (11.2%, a difference of 0.46%), Immigrants from Argentina (11.2%, a difference of 0.46%), Immigrants from Western Asia (11.0%, a difference of 0.51%), and Crow (11.0%, a difference of 0.59%).
| Demographics | Rating | Rank | No Vehicles in Household |
| Sierra Leoneans | 15.7 /100 | #207 | Poor 11.0% |
| Immigrants | Italy | 15.6 /100 | #208 | Poor 11.0% |
| Pennsylvania Germans | 15.5 /100 | #209 | Poor 11.0% |
| Apache | 14.8 /100 | #210 | Poor 11.0% |
| Crow | 14.2 /100 | #211 | Poor 11.0% |
| Immigrants | Western Asia | 13.9 /100 | #212 | Poor 11.0% |
| Immigrants | Hungary | 12.3 /100 | #213 | Poor 11.1% |
| Immigrants | Denmark | 12.1 /100 | #214 | Poor 11.1% |
| Immigrants | Sri Lanka | 10.6 /100 | #215 | Poor 11.2% |
| Immigrants | Argentina | 10.6 /100 | #216 | Poor 11.2% |
| Dutch West Indians | 10.2 /100 | #217 | Poor 11.2% |
| Immigrants | Guatemala | 10.0 /100 | #218 | Tragic 11.2% |
| Argentineans | 9.6 /100 | #219 | Tragic 11.2% |
| Immigrants | Zaire | 9.6 /100 | #220 | Tragic 11.2% |
| Peruvians | 8.4 /100 | #221 | Tragic 11.2% |