Argentinean vs Immigrants from China 4 or more Vehicles in Household
COMPARE
Argentinean
Immigrants from China
4 or more Vehicles in Household
4 or more Vehicles in Household Comparison
Argentineans
Immigrants from China
6.2%
4 OR MORE VEHICLES IN HOUSEHOLD
27.0/ 100
METRIC RATING
195th/ 347
METRIC RANK
6.0%
4 OR MORE VEHICLES IN HOUSEHOLD
13.8/ 100
METRIC RATING
215th/ 347
METRIC RANK
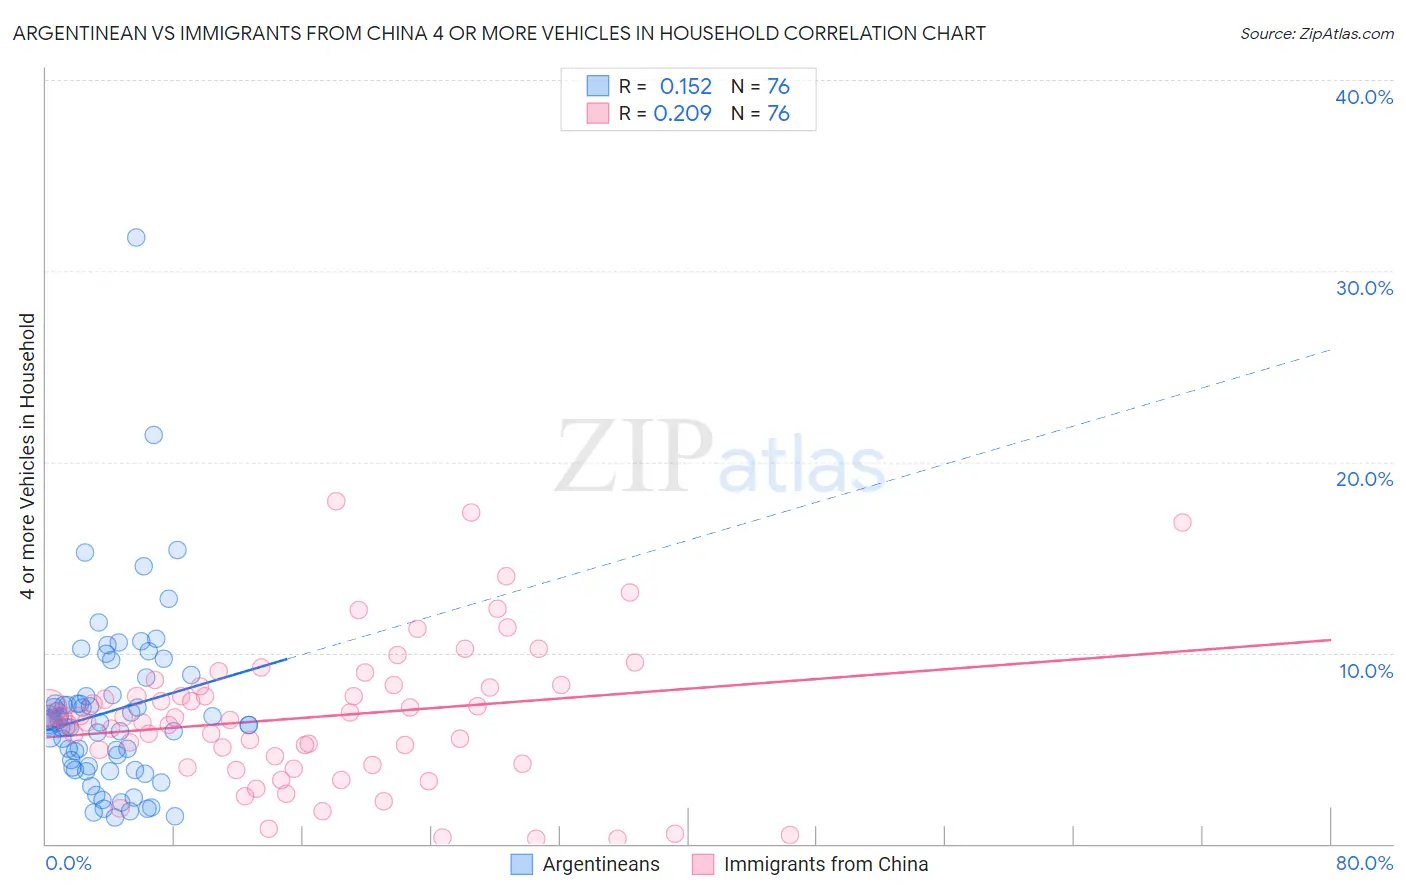
Argentinean vs Immigrants from China 4 or more Vehicles in Household Correlation Chart
The statistical analysis conducted on geographies consisting of 295,773,782 people shows a poor positive correlation between the proportion of Argentineans and percentage of households with 4 or more vehicles available in the United States with a correlation coefficient (R) of 0.152 and weighted average of 6.2%. Similarly, the statistical analysis conducted on geographies consisting of 454,562,757 people shows a weak positive correlation between the proportion of Immigrants from China and percentage of households with 4 or more vehicles available in the United States with a correlation coefficient (R) of 0.209 and weighted average of 6.0%, a difference of 2.2%.
4 or more Vehicles in Household Correlation Summary
| Measurement | Argentinean | Immigrants from China |
| Minimum | 1.3% | 0.27% |
| Maximum | 31.8% | 17.9% |
| Range | 30.4% | 17.7% |
| Mean | 6.9% | 6.6% |
| Median | 6.3% | 6.6% |
| Interquartile 25% (IQ1) | 4.0% | 4.1% |
| Interquartile 75% (IQ3) | 7.8% | 8.3% |
| Interquartile Range (IQR) | 3.7% | 4.1% |
| Standard Deviation (Sample) | 4.6% | 3.8% |
| Standard Deviation (Population) | 4.6% | 3.8% |
Demographics Similar to Argentineans and Immigrants from China by 4 or more Vehicles in Household
In terms of 4 or more vehicles in household, the demographic groups most similar to Argentineans are Tsimshian (6.2%, a difference of 0.070%), Immigrants from Sri Lanka (6.1%, a difference of 0.45%), Immigrants from Portugal (6.1%, a difference of 0.66%), Immigrants from Norway (6.1%, a difference of 0.74%), and Latvian (6.1%, a difference of 0.74%). Similarly, the demographic groups most similar to Immigrants from China are Immigrants from Austria (6.0%, a difference of 0.11%), Arab (6.0%, a difference of 0.13%), Immigrants from Egypt (6.0%, a difference of 0.19%), Panamanian (6.0%, a difference of 0.20%), and Immigrants from Zimbabwe (6.0%, a difference of 0.28%).
| Demographics | Rating | Rank | 4 or more Vehicles in Household |
| Argentineans | 27.0 /100 | #195 | Fair 6.2% |
| Tsimshian | 26.4 /100 | #196 | Fair 6.2% |
| Immigrants | Sri Lanka | 23.7 /100 | #197 | Fair 6.1% |
| Immigrants | Portugal | 22.3 /100 | #198 | Fair 6.1% |
| Immigrants | Norway | 21.8 /100 | #199 | Fair 6.1% |
| Latvians | 21.7 /100 | #200 | Fair 6.1% |
| Egyptians | 21.4 /100 | #201 | Fair 6.1% |
| Immigrants | South Central Asia | 21.3 /100 | #202 | Fair 6.1% |
| Immigrants | Sierra Leone | 20.5 /100 | #203 | Fair 6.1% |
| Immigrants | Belize | 19.8 /100 | #204 | Poor 6.1% |
| Hondurans | 19.3 /100 | #205 | Poor 6.1% |
| Kenyans | 18.5 /100 | #206 | Poor 6.1% |
| Immigrants | Chile | 16.9 /100 | #207 | Poor 6.1% |
| Immigrants | Nigeria | 15.6 /100 | #208 | Poor 6.1% |
| Immigrants | Honduras | 15.4 /100 | #209 | Poor 6.1% |
| Immigrants | Zimbabwe | 15.1 /100 | #210 | Poor 6.0% |
| Panamanians | 14.8 /100 | #211 | Poor 6.0% |
| Immigrants | Egypt | 14.7 /100 | #212 | Poor 6.0% |
| Arabs | 14.4 /100 | #213 | Poor 6.0% |
| Immigrants | Austria | 14.3 /100 | #214 | Poor 6.0% |
| Immigrants | China | 13.8 /100 | #215 | Poor 6.0% |