Alsatian vs Canadian No Vehicles in Household
COMPARE
Alsatian
Canadian
No Vehicles in Household
No Vehicles in Household Comparison
Alsatians
Canadians
13.2%
NO VEHICLES IN HOUSEHOLD
0.0/ 100
METRIC RATING
280th/ 347
METRIC RANK
8.3%
NO VEHICLES IN HOUSEHOLD
99.7/ 100
METRIC RATING
65th/ 347
METRIC RANK
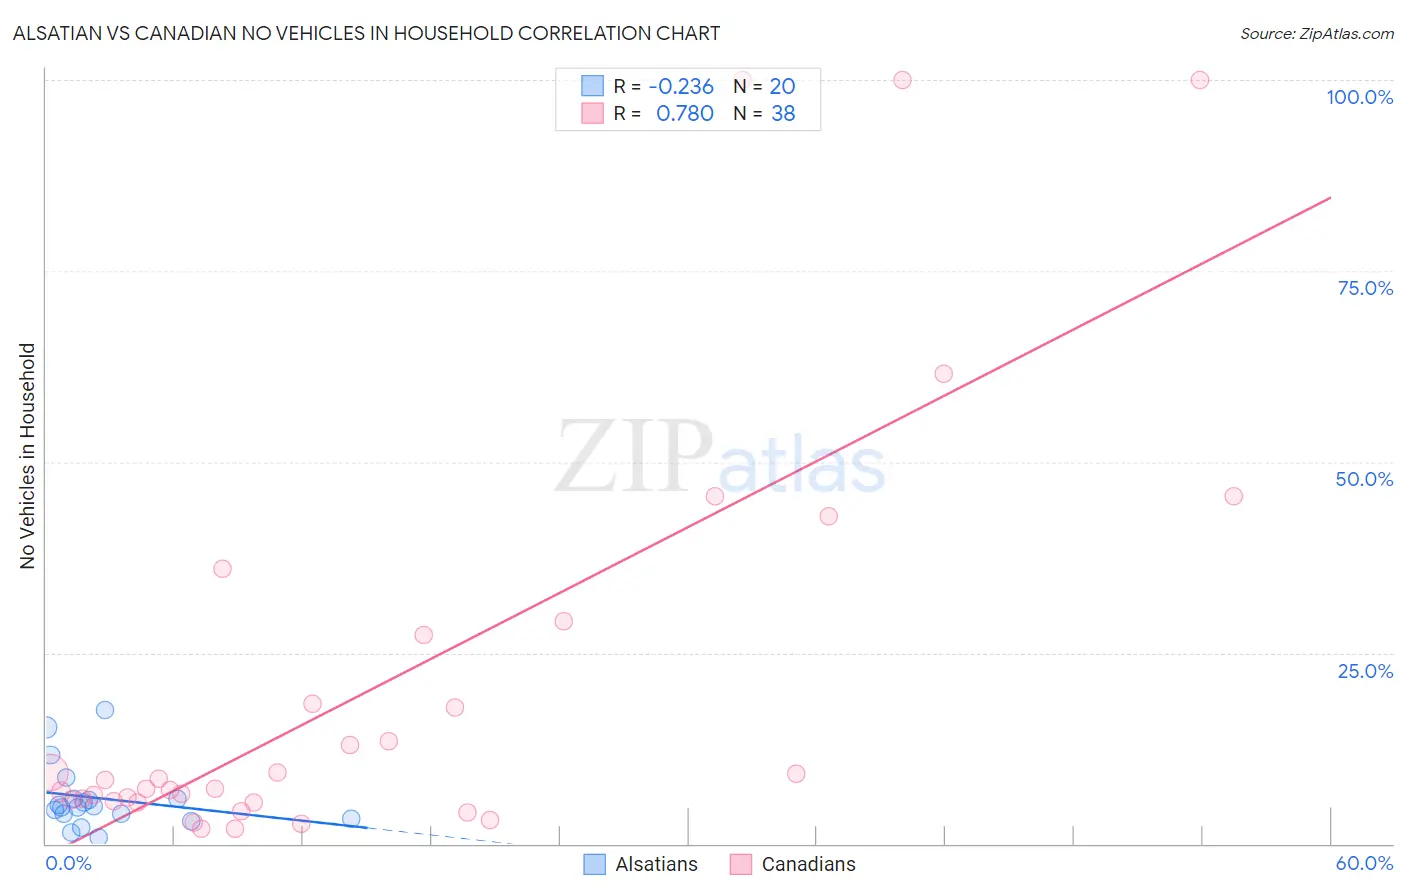
Alsatian vs Canadian No Vehicles in Household Correlation Chart
The statistical analysis conducted on geographies consisting of 82,625,632 people shows a weak negative correlation between the proportion of Alsatians and percentage of households with no vehicle available in the United States with a correlation coefficient (R) of -0.236 and weighted average of 13.2%. Similarly, the statistical analysis conducted on geographies consisting of 435,931,333 people shows a strong positive correlation between the proportion of Canadians and percentage of households with no vehicle available in the United States with a correlation coefficient (R) of 0.780 and weighted average of 8.3%, a difference of 58.1%.
No Vehicles in Household Correlation Summary
| Measurement | Alsatian | Canadian |
| Minimum | 0.84% | 1.9% |
| Maximum | 17.5% | 100.0% |
| Range | 16.6% | 98.1% |
| Mean | 5.9% | 20.8% |
| Median | 4.8% | 7.8% |
| Interquartile 25% (IQ1) | 3.6% | 5.6% |
| Interquartile 75% (IQ3) | 5.9% | 27.3% |
| Interquartile Range (IQR) | 2.4% | 21.7% |
| Standard Deviation (Sample) | 4.3% | 27.6% |
| Standard Deviation (Population) | 4.2% | 27.2% |
Similar Demographics by No Vehicles in Household
Demographics Similar to Alsatians by No Vehicles in Household
In terms of no vehicles in household, the demographic groups most similar to Alsatians are Mongolian (13.1%, a difference of 0.27%), Immigrants from Croatia (13.0%, a difference of 0.96%), Aleut (13.0%, a difference of 1.0%), Immigrants from Southern Europe (13.0%, a difference of 1.1%), and Central American Indian (13.3%, a difference of 1.4%).
| Demographics | Rating | Rank | No Vehicles in Household |
| Immigrants | France | 0.1 /100 | #273 | Tragic 12.9% |
| Immigrants | Singapore | 0.1 /100 | #274 | Tragic 12.9% |
| Immigrants | Albania | 0.1 /100 | #275 | Tragic 13.0% |
| Immigrants | Southern Europe | 0.1 /100 | #276 | Tragic 13.0% |
| Aleuts | 0.1 /100 | #277 | Tragic 13.0% |
| Immigrants | Croatia | 0.1 /100 | #278 | Tragic 13.0% |
| Mongolians | 0.0 /100 | #279 | Tragic 13.1% |
| Alsatians | 0.0 /100 | #280 | Tragic 13.2% |
| Central American Indians | 0.0 /100 | #281 | Tragic 13.3% |
| Immigrants | Eastern Asia | 0.0 /100 | #282 | Tragic 13.5% |
| Immigrants | Kazakhstan | 0.0 /100 | #283 | Tragic 13.6% |
| Immigrants | Malaysia | 0.0 /100 | #284 | Tragic 13.6% |
| Immigrants | Eastern Europe | 0.0 /100 | #285 | Tragic 13.6% |
| Colville | 0.0 /100 | #286 | Tragic 13.7% |
| Immigrants | Ireland | 0.0 /100 | #287 | Tragic 13.7% |
Demographics Similar to Canadians by No Vehicles in Household
In terms of no vehicles in household, the demographic groups most similar to Canadians are Palestinian (8.3%, a difference of 0.11%), Immigrants from Scotland (8.3%, a difference of 0.12%), Immigrants from Iran (8.4%, a difference of 0.52%), Spaniard (8.4%, a difference of 0.57%), and Croatian (8.3%, a difference of 0.75%).
| Demographics | Rating | Rank | No Vehicles in Household |
| Immigrants | Mexico | 99.8 /100 | #58 | Exceptional 8.1% |
| Immigrants | India | 99.8 /100 | #59 | Exceptional 8.2% |
| Immigrants | Laos | 99.8 /100 | #60 | Exceptional 8.2% |
| Thais | 99.8 /100 | #61 | Exceptional 8.2% |
| Chinese | 99.8 /100 | #62 | Exceptional 8.2% |
| Slovaks | 99.8 /100 | #63 | Exceptional 8.3% |
| Croatians | 99.8 /100 | #64 | Exceptional 8.3% |
| Canadians | 99.7 /100 | #65 | Exceptional 8.3% |
| Palestinians | 99.7 /100 | #66 | Exceptional 8.3% |
| Immigrants | Scotland | 99.7 /100 | #67 | Exceptional 8.3% |
| Immigrants | Iran | 99.7 /100 | #68 | Exceptional 8.4% |
| Spaniards | 99.7 /100 | #69 | Exceptional 8.4% |
| Cajuns | 99.6 /100 | #70 | Exceptional 8.4% |
| Immigrants | Lebanon | 99.6 /100 | #71 | Exceptional 8.4% |
| Lithuanians | 99.6 /100 | #72 | Exceptional 8.4% |