Colville vs European Female Unemployment
COMPARE
Colville
European
Female Unemployment
Female Unemployment Comparison
Colville
Europeans
6.0%
FEMALE UNEMPLOYMENT
0.0/ 100
METRIC RATING
282nd/ 347
METRIC RANK
4.7%
FEMALE UNEMPLOYMENT
99.9/ 100
METRIC RATING
22nd/ 347
METRIC RANK
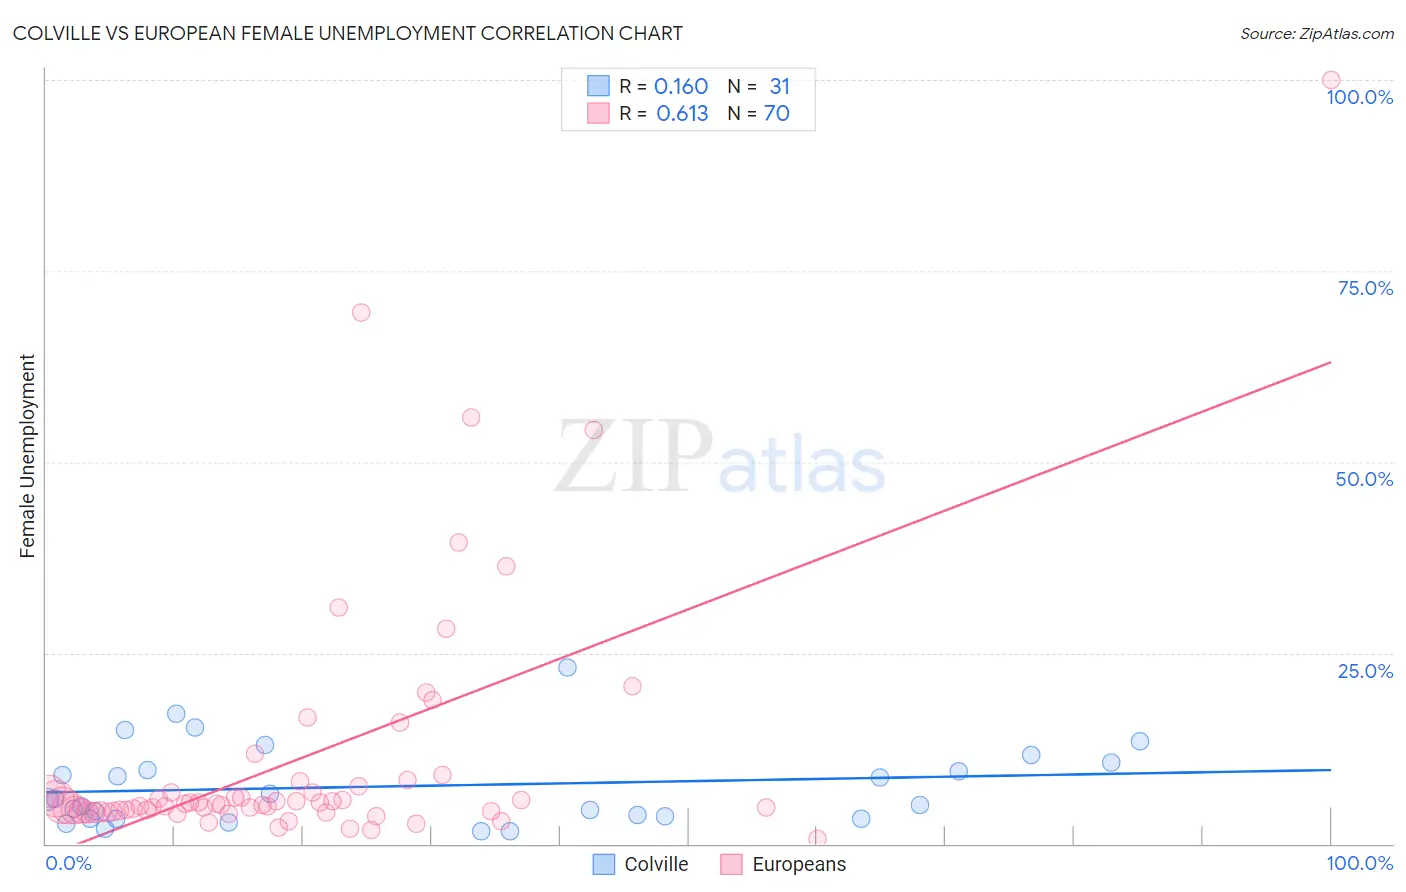
Colville vs European Female Unemployment Correlation Chart
The statistical analysis conducted on geographies consisting of 34,651,422 people shows a poor positive correlation between the proportion of Colville and unemploymnet rate among females in the United States with a correlation coefficient (R) of 0.160 and weighted average of 6.0%. Similarly, the statistical analysis conducted on geographies consisting of 549,789,782 people shows a significant positive correlation between the proportion of Europeans and unemploymnet rate among females in the United States with a correlation coefficient (R) of 0.613 and weighted average of 4.7%, a difference of 28.7%.
Female Unemployment Correlation Summary
| Measurement | Colville | European |
| Minimum | 1.6% | 0.60% |
| Maximum | 23.1% | 100.0% |
| Range | 21.5% | 99.4% |
| Mean | 7.6% | 11.3% |
| Median | 5.8% | 5.2% |
| Interquartile 25% (IQ1) | 3.3% | 4.3% |
| Interquartile 75% (IQ3) | 10.6% | 7.6% |
| Interquartile Range (IQR) | 7.3% | 3.3% |
| Standard Deviation (Sample) | 5.3% | 17.0% |
| Standard Deviation (Population) | 5.2% | 16.9% |
Similar Demographics by Female Unemployment
Demographics Similar to Colville by Female Unemployment
In terms of female unemployment, the demographic groups most similar to Colville are Salvadoran (6.0%, a difference of 0.10%), Guatemalan (6.0%, a difference of 0.27%), Mexican American Indian (6.0%, a difference of 0.31%), Armenian (6.0%, a difference of 0.37%), and Immigrants from Senegal (6.1%, a difference of 0.44%).
| Demographics | Rating | Rank | Female Unemployment |
| Senegalese | 0.0 /100 | #275 | Tragic 6.0% |
| Bahamians | 0.0 /100 | #276 | Tragic 6.0% |
| Immigrants | Ghana | 0.0 /100 | #277 | Tragic 6.0% |
| Yaqui | 0.0 /100 | #278 | Tragic 6.0% |
| Armenians | 0.0 /100 | #279 | Tragic 6.0% |
| Mexican American Indians | 0.0 /100 | #280 | Tragic 6.0% |
| Guatemalans | 0.0 /100 | #281 | Tragic 6.0% |
| Colville | 0.0 /100 | #282 | Tragic 6.0% |
| Salvadorans | 0.0 /100 | #283 | Tragic 6.0% |
| Immigrants | Senegal | 0.0 /100 | #284 | Tragic 6.1% |
| Immigrants | Cabo Verde | 0.0 /100 | #285 | Tragic 6.1% |
| Chippewa | 0.0 /100 | #286 | Tragic 6.1% |
| Immigrants | Guatemala | 0.0 /100 | #287 | Tragic 6.1% |
| Haitians | 0.0 /100 | #288 | Tragic 6.1% |
| Trinidadians and Tobagonians | 0.0 /100 | #289 | Tragic 6.1% |
Demographics Similar to Europeans by Female Unemployment
In terms of female unemployment, the demographic groups most similar to Europeans are Fijian (4.7%, a difference of 0.020%), Bulgarian (4.7%, a difference of 0.030%), Polish (4.7%, a difference of 0.11%), Latvian (4.7%, a difference of 0.12%), and Croatian (4.7%, a difference of 0.26%).
| Demographics | Rating | Rank | Female Unemployment |
| English | 100.0 /100 | #15 | Exceptional 4.6% |
| Carpatho Rusyns | 99.9 /100 | #16 | Exceptional 4.7% |
| Croatians | 99.9 /100 | #17 | Exceptional 4.7% |
| Latvians | 99.9 /100 | #18 | Exceptional 4.7% |
| Poles | 99.9 /100 | #19 | Exceptional 4.7% |
| Bulgarians | 99.9 /100 | #20 | Exceptional 4.7% |
| Fijians | 99.9 /100 | #21 | Exceptional 4.7% |
| Europeans | 99.9 /100 | #22 | Exceptional 4.7% |
| Scottish | 99.9 /100 | #23 | Exceptional 4.7% |
| Welsh | 99.9 /100 | #24 | Exceptional 4.7% |
| Immigrants | India | 99.9 /100 | #25 | Exceptional 4.7% |
| Immigrants | Bosnia and Herzegovina | 99.9 /100 | #26 | Exceptional 4.7% |
| British | 99.9 /100 | #27 | Exceptional 4.7% |
| Irish | 99.9 /100 | #28 | Exceptional 4.7% |
| Cypriots | 99.9 /100 | #29 | Exceptional 4.7% |