Yugoslavian vs Assyrian/Chaldean/Syriac Unemployment Among Women with Children Ages 6 to 17 years
COMPARE
Yugoslavian
Assyrian/Chaldean/Syriac
Unemployment Among Women with Children Ages 6 to 17 years
Unemployment Among Women with Children Ages 6 to 17 years Comparison
Yugoslavians
Assyrians/Chaldeans/Syriacs
8.5%
UNEMPLOYMENT AMONG WOMEN WITH CHILDREN AGES 6 TO 17 YEARS
99.0/ 100
METRIC RATING
90th/ 347
METRIC RANK
7.2%
UNEMPLOYMENT AMONG WOMEN WITH CHILDREN AGES 6 TO 17 YEARS
100.0/ 100
METRIC RATING
9th/ 347
METRIC RANK
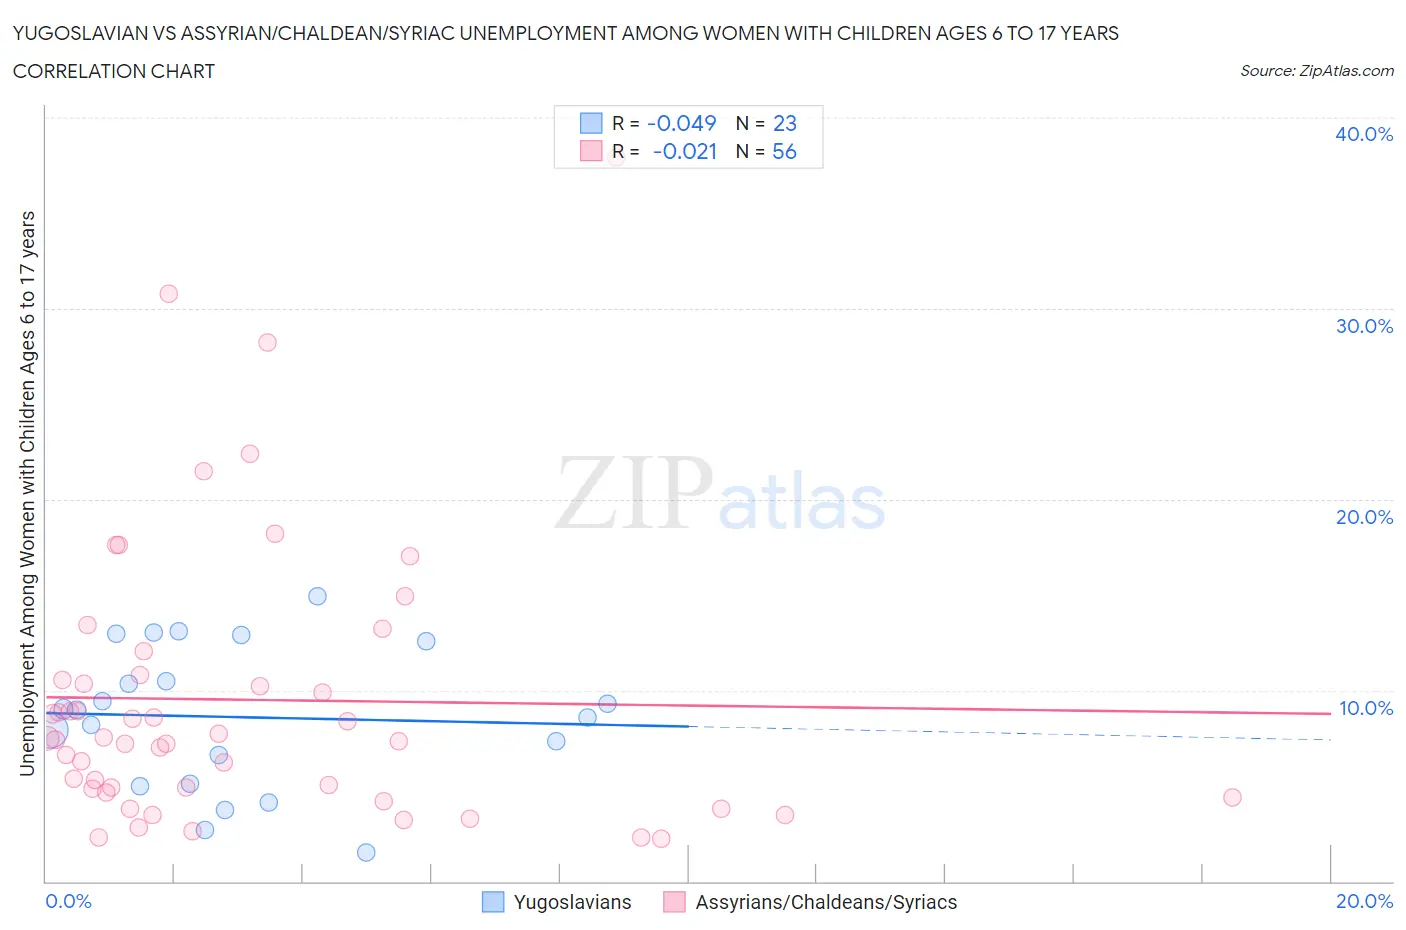
Yugoslavian vs Assyrian/Chaldean/Syriac Unemployment Among Women with Children Ages 6 to 17 years Correlation Chart
The statistical analysis conducted on geographies consisting of 213,370,013 people shows no correlation between the proportion of Yugoslavians and unemployment rate among women with children between the ages 6 and 17 in the United States with a correlation coefficient (R) of -0.049 and weighted average of 8.5%. Similarly, the statistical analysis conducted on geographies consisting of 94,071,494 people shows no correlation between the proportion of Assyrians/Chaldeans/Syriacs and unemployment rate among women with children between the ages 6 and 17 in the United States with a correlation coefficient (R) of -0.021 and weighted average of 7.2%, a difference of 17.9%.
Unemployment Among Women with Children Ages 6 to 17 years Correlation Summary
| Measurement | Yugoslavian | Assyrian/Chaldean/Syriac |
| Minimum | 1.5% | 2.2% |
| Maximum | 14.9% | 37.9% |
| Range | 13.4% | 35.7% |
| Mean | 8.6% | 9.5% |
| Median | 9.0% | 7.4% |
| Interquartile 25% (IQ1) | 5.1% | 4.7% |
| Interquartile 75% (IQ3) | 12.6% | 10.7% |
| Interquartile Range (IQR) | 7.5% | 5.9% |
| Standard Deviation (Sample) | 3.7% | 7.4% |
| Standard Deviation (Population) | 3.6% | 7.3% |
Similar Demographics by Unemployment Among Women with Children Ages 6 to 17 years
Demographics Similar to Yugoslavians by Unemployment Among Women with Children Ages 6 to 17 years
In terms of unemployment among women with children ages 6 to 17 years, the demographic groups most similar to Yugoslavians are Paiute (8.5%, a difference of 0.040%), Immigrants from Eastern Europe (8.5%, a difference of 0.060%), Potawatomi (8.5%, a difference of 0.090%), Immigrants from Vietnam (8.5%, a difference of 0.12%), and Immigrants from Israel (8.5%, a difference of 0.13%).
| Demographics | Rating | Rank | Unemployment Among Women with Children Ages 6 to 17 years |
| Bulgarians | 99.5 /100 | #83 | Exceptional 8.4% |
| Japanese | 99.5 /100 | #84 | Exceptional 8.4% |
| Immigrants | North Macedonia | 99.4 /100 | #85 | Exceptional 8.5% |
| Alaskan Athabascans | 99.4 /100 | #86 | Exceptional 8.5% |
| Immigrants | Israel | 99.1 /100 | #87 | Exceptional 8.5% |
| Immigrants | Vietnam | 99.1 /100 | #88 | Exceptional 8.5% |
| Paiute | 99.1 /100 | #89 | Exceptional 8.5% |
| Yugoslavians | 99.0 /100 | #90 | Exceptional 8.5% |
| Immigrants | Eastern Europe | 99.0 /100 | #91 | Exceptional 8.5% |
| Potawatomi | 99.0 /100 | #92 | Exceptional 8.5% |
| Australians | 98.9 /100 | #93 | Exceptional 8.5% |
| Immigrants | Barbados | 98.8 /100 | #94 | Exceptional 8.5% |
| Sri Lankans | 98.7 /100 | #95 | Exceptional 8.5% |
| German Russians | 98.6 /100 | #96 | Exceptional 8.5% |
| Bolivians | 98.5 /100 | #97 | Exceptional 8.5% |
Demographics Similar to Assyrians/Chaldeans/Syriacs by Unemployment Among Women with Children Ages 6 to 17 years
In terms of unemployment among women with children ages 6 to 17 years, the demographic groups most similar to Assyrians/Chaldeans/Syriacs are Immigrants from Hong Kong (7.2%, a difference of 0.31%), Immigrants from Fiji (7.3%, a difference of 0.97%), Immigrants from Taiwan (7.3%, a difference of 1.7%), Soviet Union (7.1%, a difference of 1.7%), and Tlingit-Haida (7.1%, a difference of 1.8%).
| Demographics | Rating | Rank | Unemployment Among Women with Children Ages 6 to 17 years |
| Fijians | 100.0 /100 | #2 | Exceptional 6.6% |
| Tongans | 100.0 /100 | #3 | Exceptional 6.7% |
| Ute | 100.0 /100 | #4 | Exceptional 7.0% |
| Okinawans | 100.0 /100 | #5 | Exceptional 7.0% |
| Tlingit-Haida | 100.0 /100 | #6 | Exceptional 7.1% |
| Soviet Union | 100.0 /100 | #7 | Exceptional 7.1% |
| Immigrants | Hong Kong | 100.0 /100 | #8 | Exceptional 7.2% |
| Assyrians/Chaldeans/Syriacs | 100.0 /100 | #9 | Exceptional 7.2% |
| Immigrants | Fiji | 100.0 /100 | #10 | Exceptional 7.3% |
| Immigrants | Taiwan | 100.0 /100 | #11 | Exceptional 7.3% |
| Bangladeshis | 100.0 /100 | #12 | Exceptional 7.4% |
| Indonesians | 100.0 /100 | #13 | Exceptional 7.4% |
| Sudanese | 100.0 /100 | #14 | Exceptional 7.4% |
| Puget Sound Salish | 100.0 /100 | #15 | Exceptional 7.5% |
| Immigrants | Burma/Myanmar | 100.0 /100 | #16 | Exceptional 7.5% |