Yugoslavian vs Assyrian/Chaldean/Syriac 12th Grade, No Diploma
COMPARE
Yugoslavian
Assyrian/Chaldean/Syriac
12th Grade, No Diploma
12th Grade, No Diploma Comparison
Yugoslavians
Assyrians/Chaldeans/Syriacs
92.1%
12TH GRADE, NO DIPLOMA
96.5/ 100
METRIC RATING
114th/ 347
METRIC RANK
91.8%
12TH GRADE, NO DIPLOMA
89.6/ 100
METRIC RATING
130th/ 347
METRIC RANK
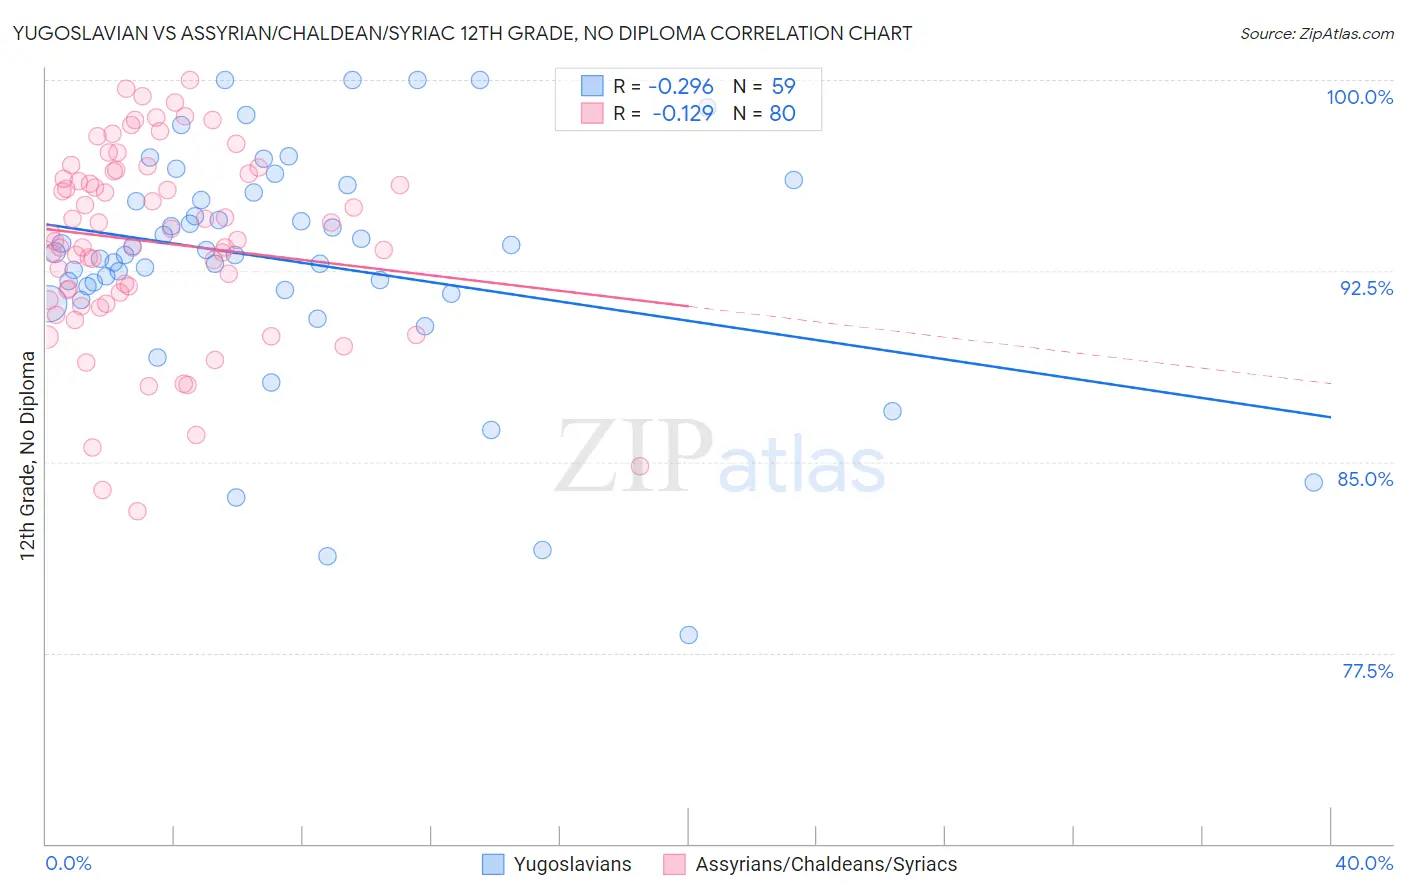
Yugoslavian vs Assyrian/Chaldean/Syriac 12th Grade, No Diploma Correlation Chart
The statistical analysis conducted on geographies consisting of 285,719,638 people shows a weak negative correlation between the proportion of Yugoslavians and percentage of population with at least 12th grade (no diploma) education in the United States with a correlation coefficient (R) of -0.296 and weighted average of 92.1%. Similarly, the statistical analysis conducted on geographies consisting of 110,318,125 people shows a poor negative correlation between the proportion of Assyrians/Chaldeans/Syriacs and percentage of population with at least 12th grade (no diploma) education in the United States with a correlation coefficient (R) of -0.129 and weighted average of 91.8%, a difference of 0.35%.
12th Grade, No Diploma Correlation Summary
| Measurement | Yugoslavian | Assyrian/Chaldean/Syriac |
| Minimum | 78.2% | 83.1% |
| Maximum | 100.0% | 100.0% |
| Range | 21.8% | 16.9% |
| Mean | 92.9% | 93.6% |
| Median | 93.2% | 93.8% |
| Interquartile 25% (IQ1) | 91.8% | 91.5% |
| Interquartile 75% (IQ3) | 95.6% | 96.4% |
| Interquartile Range (IQR) | 3.8% | 4.9% |
| Standard Deviation (Sample) | 4.6% | 3.8% |
| Standard Deviation (Population) | 4.5% | 3.7% |
Demographics Similar to Yugoslavians and Assyrians/Chaldeans/Syriacs by 12th Grade, No Diploma
In terms of 12th grade, no diploma, the demographic groups most similar to Yugoslavians are Immigrants from Zimbabwe (92.1%, a difference of 0.0%), Immigrants from Sri Lanka (92.1%, a difference of 0.010%), Aleut (92.1%, a difference of 0.010%), Immigrants from Eastern Europe (92.1%, a difference of 0.020%), and Israeli (92.1%, a difference of 0.030%). Similarly, the demographic groups most similar to Assyrians/Chaldeans/Syriacs are German Russian (91.8%, a difference of 0.0%), Mongolian (91.8%, a difference of 0.010%), Albanian (91.8%, a difference of 0.010%), Immigrants from Eastern Asia (91.8%, a difference of 0.010%), and Immigrants from Jordan (91.8%, a difference of 0.050%).
| Demographics | Rating | Rank | 12th Grade, No Diploma |
| Israelis | 96.8 /100 | #112 | Exceptional 92.1% |
| Immigrants | Zimbabwe | 96.5 /100 | #113 | Exceptional 92.1% |
| Yugoslavians | 96.5 /100 | #114 | Exceptional 92.1% |
| Immigrants | Sri Lanka | 96.4 /100 | #115 | Exceptional 92.1% |
| Aleuts | 96.3 /100 | #116 | Exceptional 92.1% |
| Immigrants | Eastern Europe | 96.3 /100 | #117 | Exceptional 92.1% |
| Puget Sound Salish | 95.8 /100 | #118 | Exceptional 92.0% |
| Immigrants | Germany | 95.5 /100 | #119 | Exceptional 92.0% |
| Immigrants | Kazakhstan | 94.2 /100 | #120 | Exceptional 91.9% |
| Menominee | 93.5 /100 | #121 | Exceptional 91.9% |
| Ottawa | 93.1 /100 | #122 | Exceptional 91.9% |
| Egyptians | 92.5 /100 | #123 | Exceptional 91.9% |
| Immigrants | Ukraine | 91.6 /100 | #124 | Exceptional 91.8% |
| Whites/Caucasians | 91.6 /100 | #125 | Exceptional 91.8% |
| Basques | 91.3 /100 | #126 | Exceptional 91.8% |
| Immigrants | Jordan | 91.0 /100 | #127 | Exceptional 91.8% |
| Mongolians | 89.9 /100 | #128 | Excellent 91.8% |
| German Russians | 89.8 /100 | #129 | Excellent 91.8% |
| Assyrians/Chaldeans/Syriacs | 89.6 /100 | #130 | Excellent 91.8% |
| Albanians | 89.3 /100 | #131 | Excellent 91.8% |
| Immigrants | Eastern Asia | 89.3 /100 | #132 | Excellent 91.8% |