Yaqui vs Immigrants from Argentina Unemployment Among Ages 35 to 44 years
COMPARE
Yaqui
Immigrants from Argentina
Unemployment Among Ages 35 to 44 years
Unemployment Among Ages 35 to 44 years Comparison
Yaqui
Immigrants from Argentina
5.3%
UNEMPLOYMENT AMONG AGES 35 TO 44 YEARS
0.1/ 100
METRIC RATING
265th/ 347
METRIC RANK
4.4%
UNEMPLOYMENT AMONG AGES 35 TO 44 YEARS
97.6/ 100
METRIC RATING
53rd/ 347
METRIC RANK
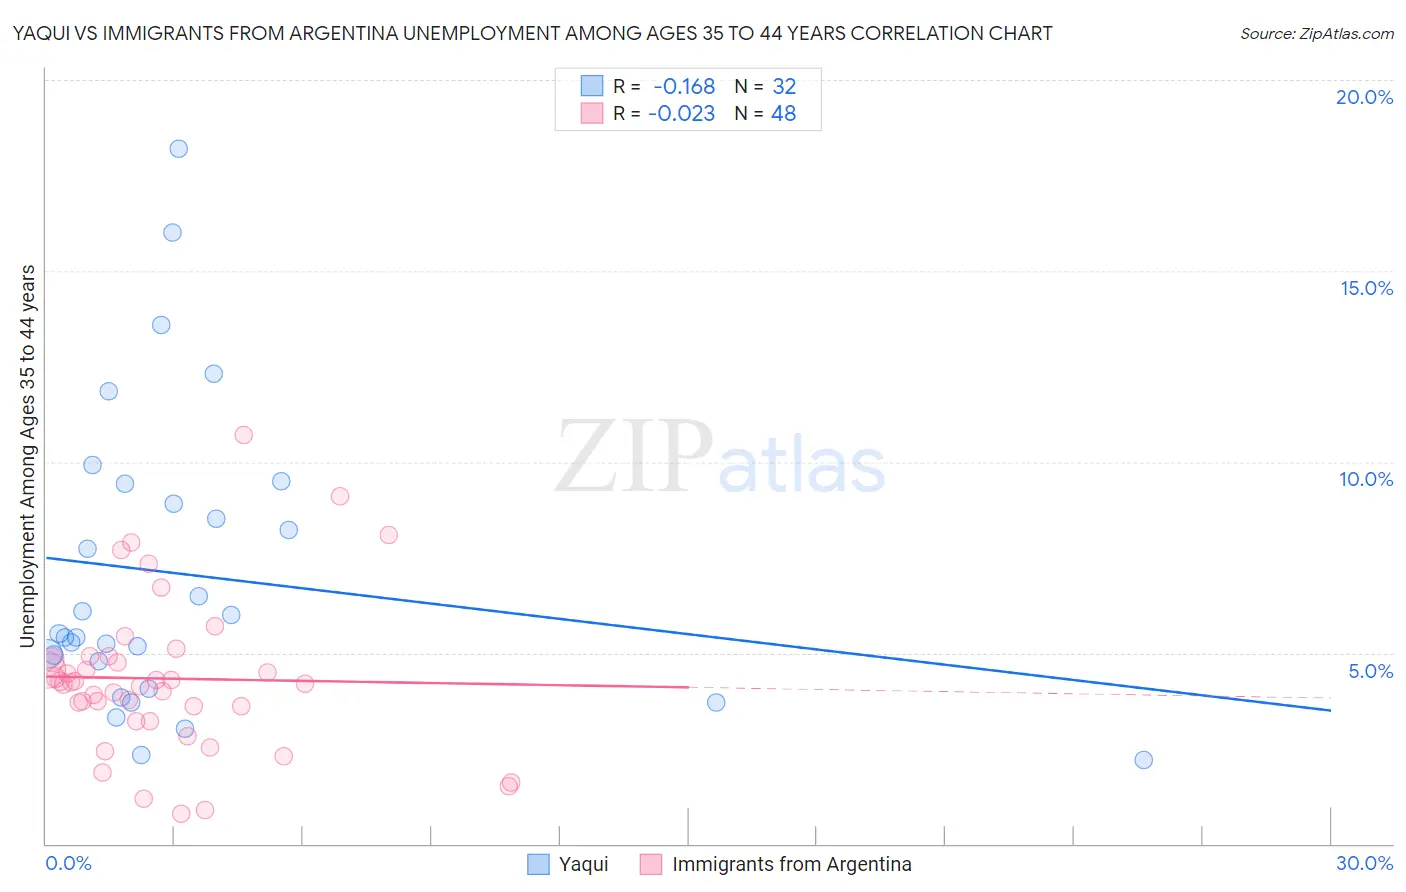
Yaqui vs Immigrants from Argentina Unemployment Among Ages 35 to 44 years Correlation Chart
The statistical analysis conducted on geographies consisting of 107,134,847 people shows a poor negative correlation between the proportion of Yaqui and unemployment rate among population between the ages 35 and 44 in the United States with a correlation coefficient (R) of -0.168 and weighted average of 5.3%. Similarly, the statistical analysis conducted on geographies consisting of 261,352,801 people shows no correlation between the proportion of Immigrants from Argentina and unemployment rate among population between the ages 35 and 44 in the United States with a correlation coefficient (R) of -0.023 and weighted average of 4.4%, a difference of 21.3%.
Unemployment Among Ages 35 to 44 years Correlation Summary
| Measurement | Yaqui | Immigrants from Argentina |
| Minimum | 2.2% | 0.80% |
| Maximum | 18.2% | 10.7% |
| Range | 16.0% | 9.9% |
| Mean | 7.0% | 4.3% |
| Median | 5.4% | 4.2% |
| Interquartile 25% (IQ1) | 4.4% | 3.4% |
| Interquartile 75% (IQ3) | 9.2% | 4.9% |
| Interquartile Range (IQR) | 4.7% | 1.5% |
| Standard Deviation (Sample) | 3.9% | 2.0% |
| Standard Deviation (Population) | 3.9% | 2.0% |
Similar Demographics by Unemployment Among Ages 35 to 44 years
Demographics Similar to Yaqui by Unemployment Among Ages 35 to 44 years
In terms of unemployment among ages 35 to 44 years, the demographic groups most similar to Yaqui are Immigrants from Bangladesh (5.3%, a difference of 0.020%), Immigrants from Western Africa (5.3%, a difference of 0.14%), Ghanaian (5.3%, a difference of 0.19%), Choctaw (5.3%, a difference of 0.20%), and Hawaiian (5.3%, a difference of 0.22%).
| Demographics | Rating | Rank | Unemployment Among Ages 35 to 44 years |
| Immigrants | Latin America | 0.1 /100 | #258 | Tragic 5.3% |
| Mexicans | 0.1 /100 | #259 | Tragic 5.3% |
| Sub-Saharan Africans | 0.1 /100 | #260 | Tragic 5.3% |
| Spanish Americans | 0.1 /100 | #261 | Tragic 5.3% |
| Immigrants | Central America | 0.1 /100 | #262 | Tragic 5.3% |
| Choctaw | 0.1 /100 | #263 | Tragic 5.3% |
| Ghanaians | 0.1 /100 | #264 | Tragic 5.3% |
| Yaqui | 0.1 /100 | #265 | Tragic 5.3% |
| Immigrants | Bangladesh | 0.1 /100 | #266 | Tragic 5.3% |
| Immigrants | Western Africa | 0.0 /100 | #267 | Tragic 5.3% |
| Hawaiians | 0.0 /100 | #268 | Tragic 5.3% |
| Cajuns | 0.0 /100 | #269 | Tragic 5.3% |
| Blackfeet | 0.0 /100 | #270 | Tragic 5.3% |
| Ute | 0.0 /100 | #271 | Tragic 5.3% |
| Senegalese | 0.0 /100 | #272 | Tragic 5.3% |
Demographics Similar to Immigrants from Argentina by Unemployment Among Ages 35 to 44 years
In terms of unemployment among ages 35 to 44 years, the demographic groups most similar to Immigrants from Argentina are Okinawan (4.4%, a difference of 0.14%), Immigrants from Eastern Asia (4.4%, a difference of 0.16%), Asian (4.4%, a difference of 0.16%), Immigrants from Turkey (4.4%, a difference of 0.18%), and Immigrants from Moldova (4.4%, a difference of 0.19%).
| Demographics | Rating | Rank | Unemployment Among Ages 35 to 44 years |
| Immigrants | Belgium | 98.4 /100 | #46 | Exceptional 4.3% |
| British | 98.3 /100 | #47 | Exceptional 4.4% |
| Bhutanese | 98.2 /100 | #48 | Exceptional 4.4% |
| Swiss | 98.2 /100 | #49 | Exceptional 4.4% |
| Immigrants | Turkey | 97.8 /100 | #50 | Exceptional 4.4% |
| Immigrants | Eastern Asia | 97.8 /100 | #51 | Exceptional 4.4% |
| Okinawans | 97.7 /100 | #52 | Exceptional 4.4% |
| Immigrants | Argentina | 97.6 /100 | #53 | Exceptional 4.4% |
| Asians | 97.4 /100 | #54 | Exceptional 4.4% |
| Immigrants | Moldova | 97.3 /100 | #55 | Exceptional 4.4% |
| Chileans | 97.3 /100 | #56 | Exceptional 4.4% |
| Immigrants | Hong Kong | 97.2 /100 | #57 | Exceptional 4.4% |
| English | 97.2 /100 | #58 | Exceptional 4.4% |
| Greeks | 97.1 /100 | #59 | Exceptional 4.4% |
| Taiwanese | 97.1 /100 | #60 | Exceptional 4.4% |