Yaqui vs Immigrants from Argentina Kindergarten
COMPARE
Yaqui
Immigrants from Argentina
Kindergarten
Kindergarten Comparison
Yaqui
Immigrants from Argentina
97.6%
KINDERGARTEN
0.7/ 100
METRIC RATING
256th/ 347
METRIC RANK
97.9%
KINDERGARTEN
40.7/ 100
METRIC RATING
184th/ 347
METRIC RANK
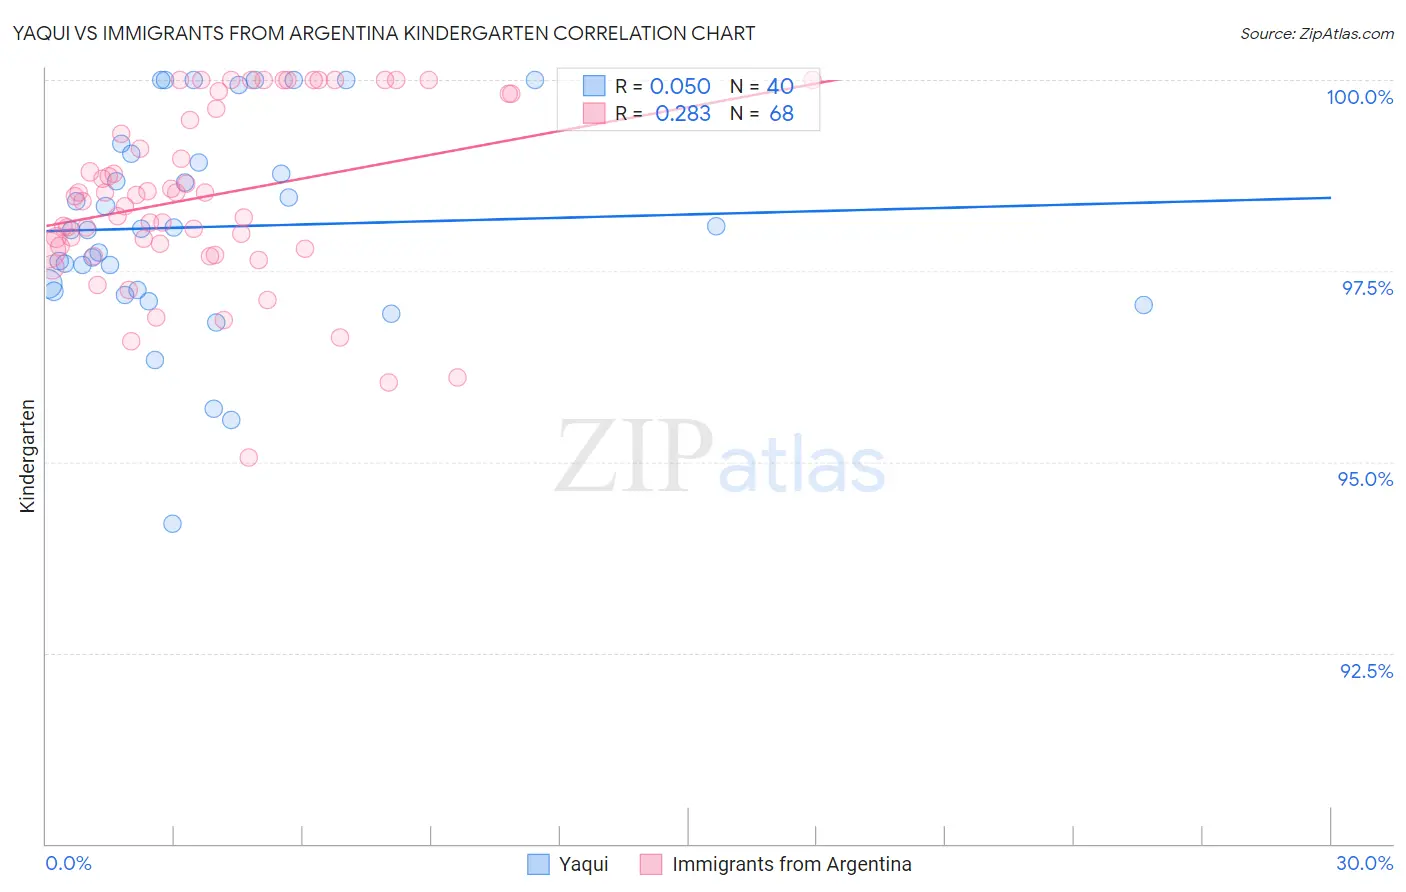
Yaqui vs Immigrants from Argentina Kindergarten Correlation Chart
The statistical analysis conducted on geographies consisting of 107,732,380 people shows no correlation between the proportion of Yaqui and percentage of population with at least kindergarten education in the United States with a correlation coefficient (R) of 0.050 and weighted average of 97.6%. Similarly, the statistical analysis conducted on geographies consisting of 264,435,492 people shows a weak positive correlation between the proportion of Immigrants from Argentina and percentage of population with at least kindergarten education in the United States with a correlation coefficient (R) of 0.283 and weighted average of 97.9%, a difference of 0.35%.
Kindergarten Correlation Summary
| Measurement | Yaqui | Immigrants from Argentina |
| Minimum | 94.2% | 95.1% |
| Maximum | 100.0% | 100.0% |
| Range | 5.8% | 4.9% |
| Mean | 98.1% | 98.5% |
| Median | 98.0% | 98.5% |
| Interquartile 25% (IQ1) | 97.2% | 97.8% |
| Interquartile 75% (IQ3) | 99.0% | 99.7% |
| Interquartile Range (IQR) | 1.7% | 1.9% |
| Standard Deviation (Sample) | 1.4% | 1.2% |
| Standard Deviation (Population) | 1.3% | 1.1% |
Similar Demographics by Kindergarten
Demographics Similar to Yaqui by Kindergarten
In terms of kindergarten, the demographic groups most similar to Yaqui are Immigrants from Asia (97.6%, a difference of 0.0%), Immigrants from Congo (97.6%, a difference of 0.0%), Immigrants from Iraq (97.6%, a difference of 0.010%), Immigrants from Africa (97.6%, a difference of 0.010%), and Immigrants from Colombia (97.6%, a difference of 0.010%).
| Demographics | Rating | Rank | Kindergarten |
| Peruvians | 1.0 /100 | #249 | Tragic 97.6% |
| Immigrants | Senegal | 0.9 /100 | #250 | Tragic 97.6% |
| Ethiopians | 0.9 /100 | #251 | Tragic 97.6% |
| Immigrants | Iraq | 0.9 /100 | #252 | Tragic 97.6% |
| Immigrants | Africa | 0.8 /100 | #253 | Tragic 97.6% |
| Immigrants | Asia | 0.8 /100 | #254 | Tragic 97.6% |
| Immigrants | Congo | 0.8 /100 | #255 | Tragic 97.6% |
| Yaqui | 0.7 /100 | #256 | Tragic 97.6% |
| Immigrants | Colombia | 0.6 /100 | #257 | Tragic 97.6% |
| Jamaicans | 0.6 /100 | #258 | Tragic 97.6% |
| Armenians | 0.5 /100 | #259 | Tragic 97.6% |
| Fijians | 0.5 /100 | #260 | Tragic 97.5% |
| Taiwanese | 0.4 /100 | #261 | Tragic 97.5% |
| Immigrants | Ethiopia | 0.4 /100 | #262 | Tragic 97.5% |
| Immigrants | South America | 0.4 /100 | #263 | Tragic 97.5% |
Demographics Similar to Immigrants from Argentina by Kindergarten
In terms of kindergarten, the demographic groups most similar to Immigrants from Argentina are Immigrants from Poland (97.9%, a difference of 0.0%), Immigrants from Belarus (97.9%, a difference of 0.0%), Portuguese (97.9%, a difference of 0.010%), Egyptian (97.9%, a difference of 0.010%), and Immigrants from Venezuela (97.9%, a difference of 0.020%).
| Demographics | Rating | Rank | Kindergarten |
| Immigrants | Venezuela | 47.9 /100 | #177 | Average 97.9% |
| Brazilians | 47.6 /100 | #178 | Average 97.9% |
| Argentineans | 46.8 /100 | #179 | Average 97.9% |
| Immigrants | Bosnia and Herzegovina | 46.7 /100 | #180 | Average 97.9% |
| Portuguese | 43.5 /100 | #181 | Average 97.9% |
| Egyptians | 42.4 /100 | #182 | Average 97.9% |
| Immigrants | Poland | 41.4 /100 | #183 | Average 97.9% |
| Immigrants | Argentina | 40.7 /100 | #184 | Average 97.9% |
| Immigrants | Belarus | 39.4 /100 | #185 | Fair 97.9% |
| Pakistanis | 36.0 /100 | #186 | Fair 97.9% |
| Immigrants | Kazakhstan | 35.9 /100 | #187 | Fair 97.9% |
| Arabs | 35.4 /100 | #188 | Fair 97.9% |
| Paiute | 34.7 /100 | #189 | Fair 97.9% |
| Panamanians | 33.3 /100 | #190 | Fair 97.9% |
| Immigrants | Taiwan | 30.7 /100 | #191 | Fair 97.9% |